

Abstract
Introduction
There are many fields other than safety of navigation at sea that have a need for detailed bathymetry. These fields include for example research, marine spatial planning, oceanographic modeling, offshore exploration, defense and environmental protection, just to name some important ones. Depth data is also being collected by various different stakeholders from fishermen to hydrographers and with very different levels of accuracy and quality control.
However, our seas are still far from being sufficiently mapped. This makes it vital that the best existing depth data is made available to the broadest possible audience.
In the Baltic Sea, an estimated 30% to 50% of the area is surveyed to modern standards, with the majority of surveying being conducted by the hydrographic offices of the surrounding states. Surveying activity has increased in recent years, and forecasts predict that the current intensity of surveying effort will be maintained for the foreseeable future (Korhonen, 2014).
Still, the majority of the bathymetry data is only being used for the production of nautical charts. Apart from the problems of actual data discovery, in some countries, detailed depth information is withheld for military security concerns or the hydrographic offices have an economic interest in selling data. Researchers have been forced to rely upon coarse depth models compiled mostly from soundings on published charts and data collected during sporadic research cruises. The IOWTOPO dataset compiled by Seifert et. al. (2001) is the most prominent example in the Baltic Sea. It accounted for two thirds of the bathymetry data citations in the scientific literature (Hell et. al., 2011). For anyone working in public administration, finding and accessing appropriate data has been laborious, and the general public are often not aware of the fact that topography continues to exist under the sea surface.
Not least considering the fragility of the Baltic Sea environment, it is now time to open the archives and unleash the potential of this hidden data treasure to spread knowledge of this marine region and thereby strengthen efforts to protect it. The Baltic Sea Bathymetry Database (BSBD), released in September 2013, is one step in this direction.
Methods
The work which has led to the development of the BSBD is based on a detailed survey of the end users’ needs (Hell et. al., 2011). To summarize that article:
- Users demand a high spatial resolution on the order of 5m to 50m – higher with decreasing water depth and decreasing distance to the coast.
- Bathymetry data for the shallow waters very close to the coast is most important from the end users’ perspective.
- A lack of data or problems accessing to data imposes severe and costly restrictions for administrative as well as research activities. Access restrictions limit the usefulness of the data being collected.
These factors were the basis for the compilation of the BSBD, and were taken into account in all decisions made. However, as shown below, the combination of high spatial resolution and coastal vicinity is a demanding requirement.
The Baltic Sea Hydrographic Commission
Since 1983, the Baltic Sea member states of the International Hydrographic Organization (IHO) have formed close ties under the umbrella of the Baltic Sea Hydrographic Commission (BSHC). In recent years the collaboration has intensified, leading to a number of projects tackled by BSHC working groups, as exemplified in this publication.
In 2009, Sweden took the initiative to restart a working group with the goal to produce and release a common digital bathymetry model, based on the best possible data from hydrographic surveying in all participating countries. The Swedish government was willing to fund the establishment of a pilot web portal for a publicly available bathymetry database of the Baltic Sea, in line with the EU INSPIRE directive. Data access would be provided at no cost and with limited use restrictions.
The working group includes members from all BSHC states and meets regularly to discuss the availability of data and determine the parameters for data release acceptable to all member states, such as grid resolution and terms of use. The work undertaken in compiling the model is mostly carried out at the Swedish Maritime Administration (SMA), which also hosts the BSBD web site. Being backed by the BSHC proved to be a prerequisite for the work with the BSBD, especially with regard to gaining access to data from many different countries and organisations.
Problems and challenges
At the beginning of the work in compiling the BSBD, it became clear that several challenges would have to be dealt with in order for the project to be successful: (1) Detailed depth information is withheld for defense reasons in Sweden and Finland. (2) The business models of several BSHC hydrographic offices have placed an economic value on depth data, requiring the data to be sold rather than distributed as open geodata. (3) The restrictions and caveats placed on the release of data by the individual Baltic Sea states vary significantly, which inevitably leads to compromises, such as when determining the possible grid resolution.
Agreement means compromises
As one of the main tasks was to produce a homogeneous model of the entire area, the only way to achieve this result is for the database to adopt the lowest common denominator for each of its compilation parameters, especially with regard to grid resolution. It is on a level that all Baltic Sea states could accept, without being restricted by legal, commercial or security reasons. The possibility of higher resolution grids covering specific areas is an option for future BSBD releases.
Security classification of depth information
In both Sweden and Finland, detailed information about the bathymetry along the coast of the Baltic Sea is considered critical for the defense strategy. Therefore, the release of such data for the territorial waters of these countries is restricted, and requires prior approval by the armed forces or responsible authorities. Even for users from other state authorities, the procedures to obtain the re- lease of this data have been proven to be complex, restrictive and costly (Hell et. al., 2011).
For the BSBD, in Sweden a spatial resolution of 500m was deemed to be sufficiently general so as not to provide any military advantage, and received general approval for release. In the future it will be possible to use higher resolution source data as input for the Swedish territory, but the final data will be distributed at the same 500m resolution as used today.
For the Finnish territorial waters, however, no such approval for release could be obtained. Therefore, these areas are only based on depth soundings taken from Finnish Electronic Nautical Charts (ENC), which are publicly available but problematic as a data source from which to compile a bathymetry model of high quality. The spatial resolution of selected chart soundings is rather low, they do not portray the sea floor morphology very well, and they introduce a shallow bias to the depth model in the areas where they are used.
In the exclusive economic zone (EEZ), no such defence restrictions apply in any of the participating countries.
Business with depth data
For some years open geodata have been a topic for political discussions in many countries. In the European Union the INSPIRE directive has resulted in a substantial number of data sets being distributed in standardized formats by administrative bodies, often at no cost and with minimal use restrictions. The situation looks very different from country to country, and a large proportion of state- owned data cannot be shared freely due to various restrictions imposed by each state.
In the Baltic Sea region, only the German federal government and the Estonian authorities distribute all their geodata openly, without cost and with minimal use restrictions. In Denmark, access to land data is open but access to most marine data remains restricted, at least for commercial applications. The Swedish and Finnish hydrographic offices are required by their respective business policies to sell high-resolution depth data, which makes it highly unlikely that they will undercut their commercial offerings with a no cost option at a higher resolution than the present 500m.
Data used
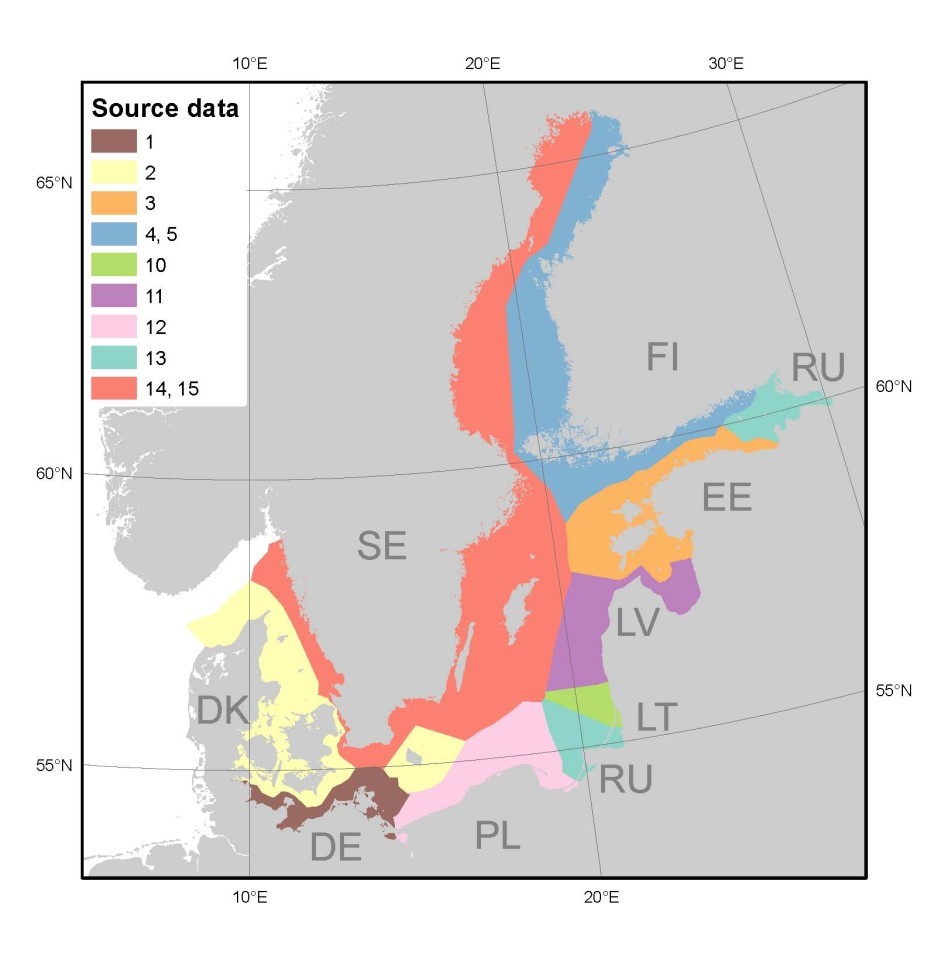
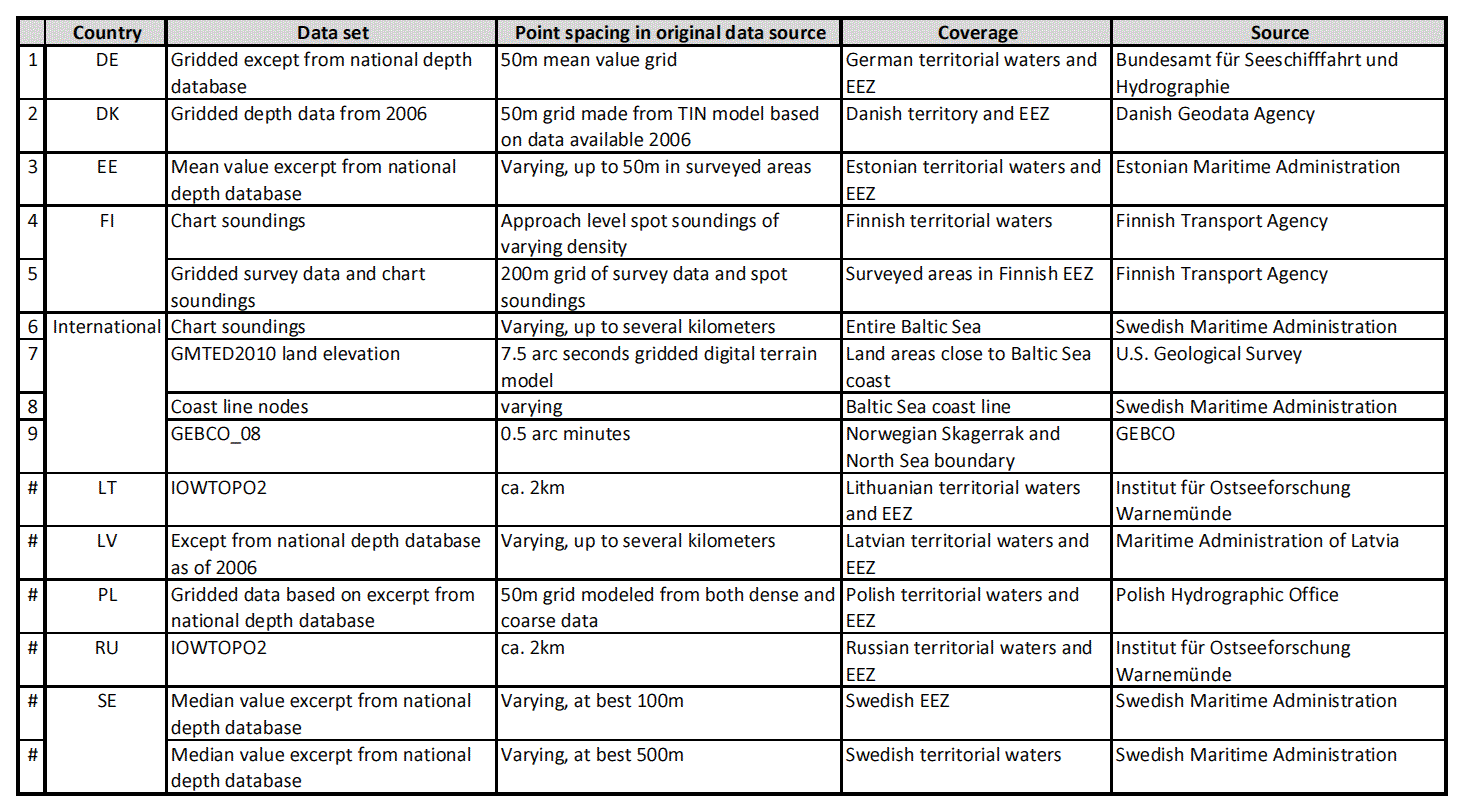
For the compilation of the BSBD, each BSHC hydrographic office has the responsibility to supply the most appropriate source data from the national hydrographic survey archives (Figure 1). The data listed in Table 1 range from medium resolution gridded multi-beam measurements to excerpts of soundings from ENCs. Preferably the source data has a higher resolution than the final 500m grid, is not interpolated between measurements, contains mean or median depths instead of minimum depths so as not to introduce a shallow bias, and uses Mean Sea Level as vertical datum. Its quality should also be known.
Additional data was also used in order to constrain the BSBD grid at its edges:
- In the North Sea: points were extracted from the GEBCO_08 grid (General Bathymetric Chart of the Oceans, 2010)
- At the coast line: nodes were extracted from the coast line used in charts produced by the Swedish Maritime Administration
- On land: points were extracted from the GMTED2010 7.5 arc second global elevation model (Danielson and Gesch, 2011)
This additional source data ensures that the BSBD grid has zero depths along its edges after being clipped at the coast line. Furthermore, it will seamlessly blend with GEBCO_08 at its edge towards the North Sea.
Apart from the fact that large areas of the Baltic Sea are not yet surveyed to modern standards, various constraints exist in different countries, such as security issues, data usage restrictions or the lack a survey database from which the data can be easily extracted.
As mentioned previously, less than half of the Baltic Sea has been mapped to modern standards. The density of the existing older surveys varies substantially, depending on their age and location. In the open sea, sounding separations of several kilometers are not uncommon in deeper areas, and distances up to 16km between soundings can be found on rare occasions.
Therefore, the BSBD source dataset is inhomogeneous, imperfect and incomplete, and it will probably always remain so. Nevertheless, the data listed in Table 1 is the best data currently available for this work. As discussed below, it still yields results far superior to the depth models previously available.
Data compilation
The source data is gridded using the Stacked continuous curvature splines in tension method (Hell and Jakobsson, 2010). In summary, the process works as follows:
- Each grid cell is median filtered, keeping only one sounding corresponding to the median depth of all data points in the cell.
- These data points serve as input to compute a continuous surface with one value for every grid cell, using the spline in tension algorithm (Smith and Wessel, 1990). This surface connects the data points and interpolates values for cells devoid of data.
- Depending on the source data coverage in each place, interpolated grid cells with insufficient data support are deleted, i.e. the ones too far away from the closest data points. Specifically, each grid cell itself and at least two of the cells next to it must each contain a data point.
- In order to fill these now-empty cells, the entire gridding process is repeated, but on a grid with double the cell spacing. With larger grid cells the data support is generally better and larger areas can be kept.
- This process is repeated until the entire area is filled, resulting in a series of increasingly coarser grids with a decreasing number of holes.
- In a last step, all the grids are stacked together, with values originating from smaller grid cells taking precedence over those from larger ones.
- The result is a uniform 500 m grid covering the complete area.
In the stacking process a grid showing the parent cell resolution of each place is also produced. This gives an indication of the underlying source data density at a point and may serve as one way to judge the quality of the final grid.
For the online presentation of the grid, it is further combined with the GMTED2010 land elevation dataset, as well as the GEBCO_08 bathymetry grid covering waters outside the Baltic Sea. Finally, the data is colored for depth and shaded, and map imagery is rendered.
The grid is produced in a Lambert Azimuthal Equal Area projection, centered on the European continent, ETRS89-LAEA (EPSG:3035), following the INSPIRE recommendations for pan-European maps. It is being distributed in a variety of coordinate systems, including WGS84 geographic coordinates and all relevant UTM projections.
Results
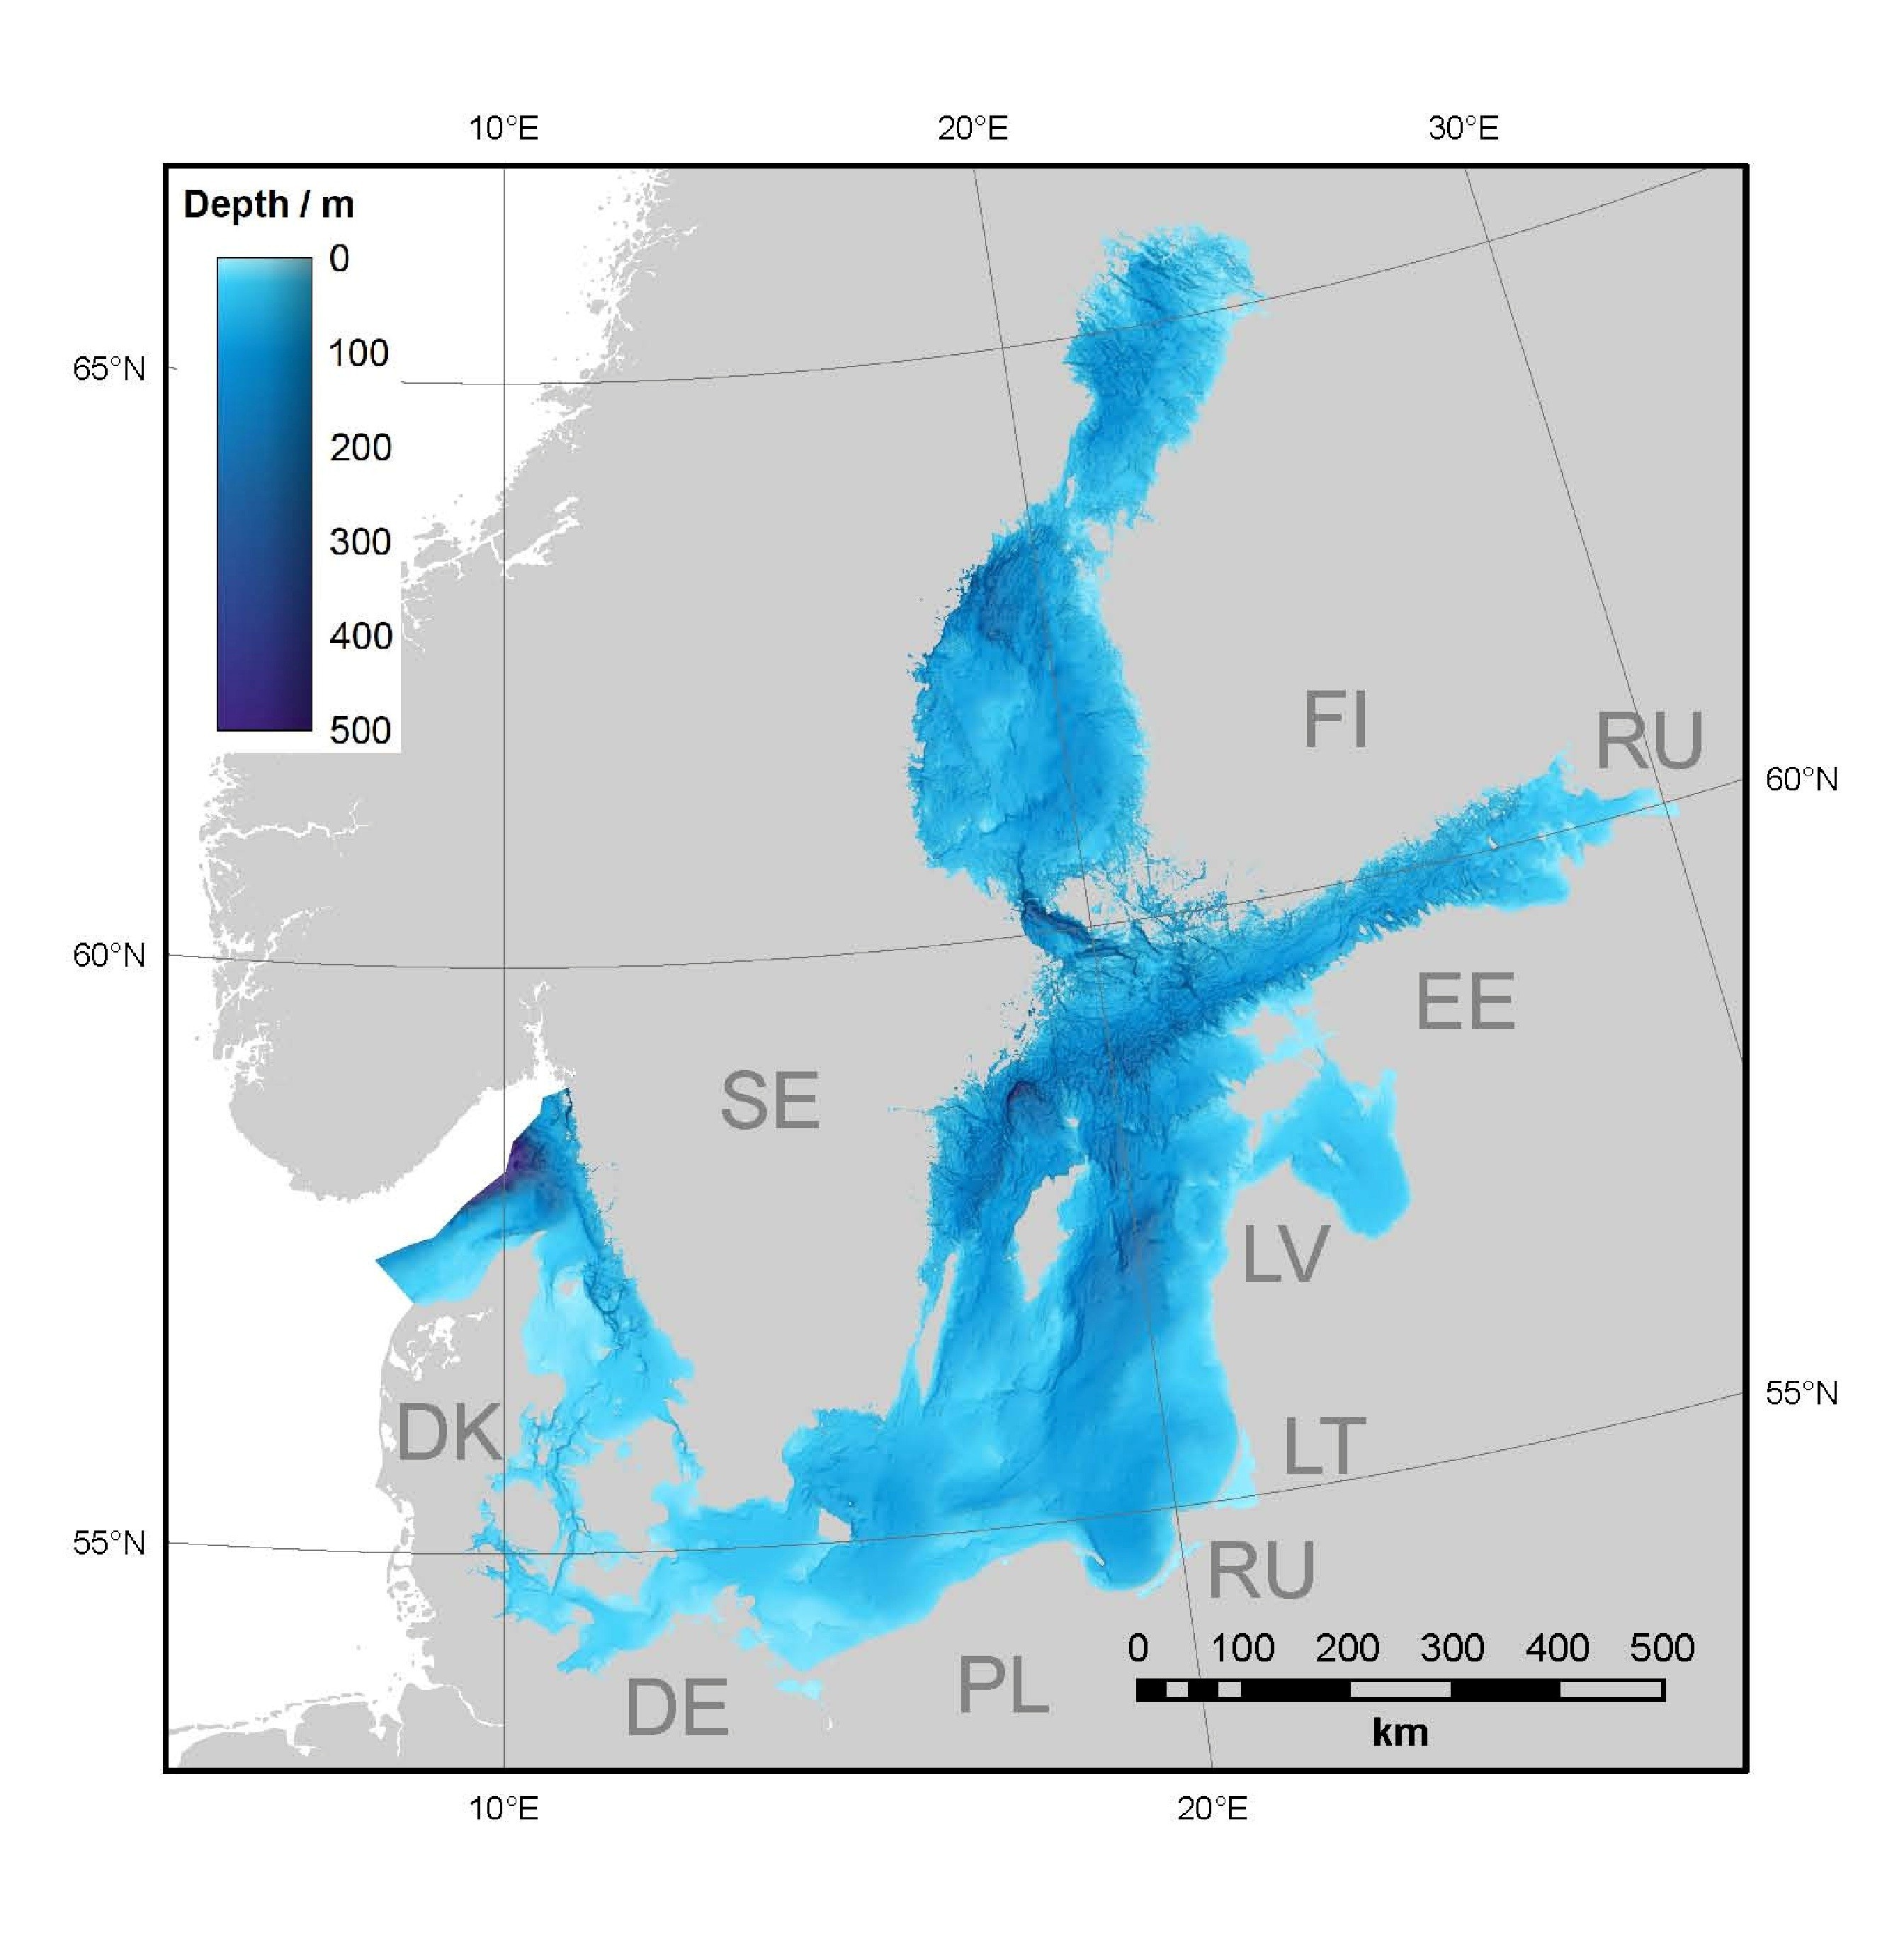
The first public version 0.9.1 of the BSBD grid was published online 10 September, 2013. It featured a 500m grid based on data covering the areas of Denmark, Sweden, Finland, Estonia, Latvia and Germany. Today’s version 0.9.3 (Figure 2) also includes data from Poland. The areas of the two remaining countries, Lithuania and Russia, are still based on the GEBCO_08 grid. As new source data becomes available the grid is updated. Currently the approximate update frequency is two times per year. All grids are version numbered and a history of earlier versions of the BSBD is being kept on the web site, including possibilities to download legacy data.
The data is freely available under a Creative Commons Attribution license, with the provision that it may not be used for safety of navigation purposes. The BSBD is a non-shoal biased, interpolated and blended grid of limited cell size which is unsuitable for navigation. The grid is being distributed through a dedicated web site (http:// data.bshc.pro/) featuring an interactive map with functions to download a specified area in a variety of formats; as well as metadata according to the ISO 19115 and ISO 19139 standards; and further documentation. The data is also published through several Open Geospatial Consortium (OGC) services, namely a standard Web Map Service (WMS) for map imagery and a still more exotic Web Coverage Service (WCS) for client side grid processing.
The grid homogeneously covers the entire Baltic Sea area, including Kattegat, Sound and Belts, as well as the Danish parts of Skagerrak, at a spatial resolution of 500m. Future versions will also include data for the Norwegian Skagerrak, and thereby cover the entire area of IOWTOPO2. Because of the varying density of the source data used, only part of the area is sufficiently covered with data to allow for this resolution without the need to interpolate between sparse data points. Many grid cells are interpolated between sparse data points. In order to give an indication about the underlying data coverage, a map showing the grid- ding resolution at each point is available alongside with the data grid (see methods above).
Discussion
Data quality
Compared to the IOWTOPO data sets, which often have been used for applications requiring complete and homogeneous coverage of the Baltic Sea, the BSBD grid is a major improvement regarding spatial resolution; precision and accuracy; and being compiled from the most complete and comprehensive set of source data available to the BSHC.
At a grid resolution of 500m, BSBD can convey 4 to 8 times more information as IOWTOPO1 and IOWTOPO2, with their resolutions of approximately 1km and 2km, respectively. Where the source data permits, much smaller morphologic details can be resolved. Many of the morphologically interesting features of the Baltic Sea are rather small, e.g. the deep channels through the Belts or remnants of ice age glaciations. But even larger features, such as the Landsort Deep, are portrayed in much higher clarity than previously available.
As the BSBD is entirely based on quality-controlled data from the archives of the BSHC member hydrographic offices, one can expect a high accuracy regarding both the lateral placement of features and the depths reported. However, a large portion of the area has not yet been mapped to modern standards. As a consequence, the accuracy of the BSBD source data varies and thereby also the accuracy of the BSBD grid, even though the best possible data is included for the majority of the coverage.
As described above, the source data is as complete as possible with regard to producing a 500m grid resolution product. In many places, surveys with much higher resolution have been down sampled to a level sufficient for the target resolution. This does not depreciate the value by any means of the final grid at its given resolution, and simplifies handling of the large source data set. However, in limited places additional and better data may exist, e.g. where high-resolution industry data has not been supplied to the respective hydrographic office. It is not a regulatory requirement in all countries for industry to supply the national hydrographic authority with hydrographic data from surveys performed in that country’s area of charting responsibility.
Public reception
The BSBD web site, where data can be viewed and downloaded, has been visited by more than 10,000 unique users between its launch in September 2013 and June 2014. About one third of the visitors have returned to the web site at least once. The visitors come from more than 100 countries, with a large majority from Sweden, the other Baltic Sea states, France, the United Kingdom, Norway and the United States. The large proportion of Swedish visitors can be accounted for by the fact that the BSBD is being developed and hosted in Sweden, and has been promoted most actively here. The site has been referenced by hyperlink from about 100 different World Wide Web sites. Search engines account for only 10% of the site’s traffic to date.
There have been approaching 4000 downloads of data from the web site. The following statistics are being collected through the download form on the web site:
- timestamp
- data format
- use category (research, administration, education, other)
- downloaded area
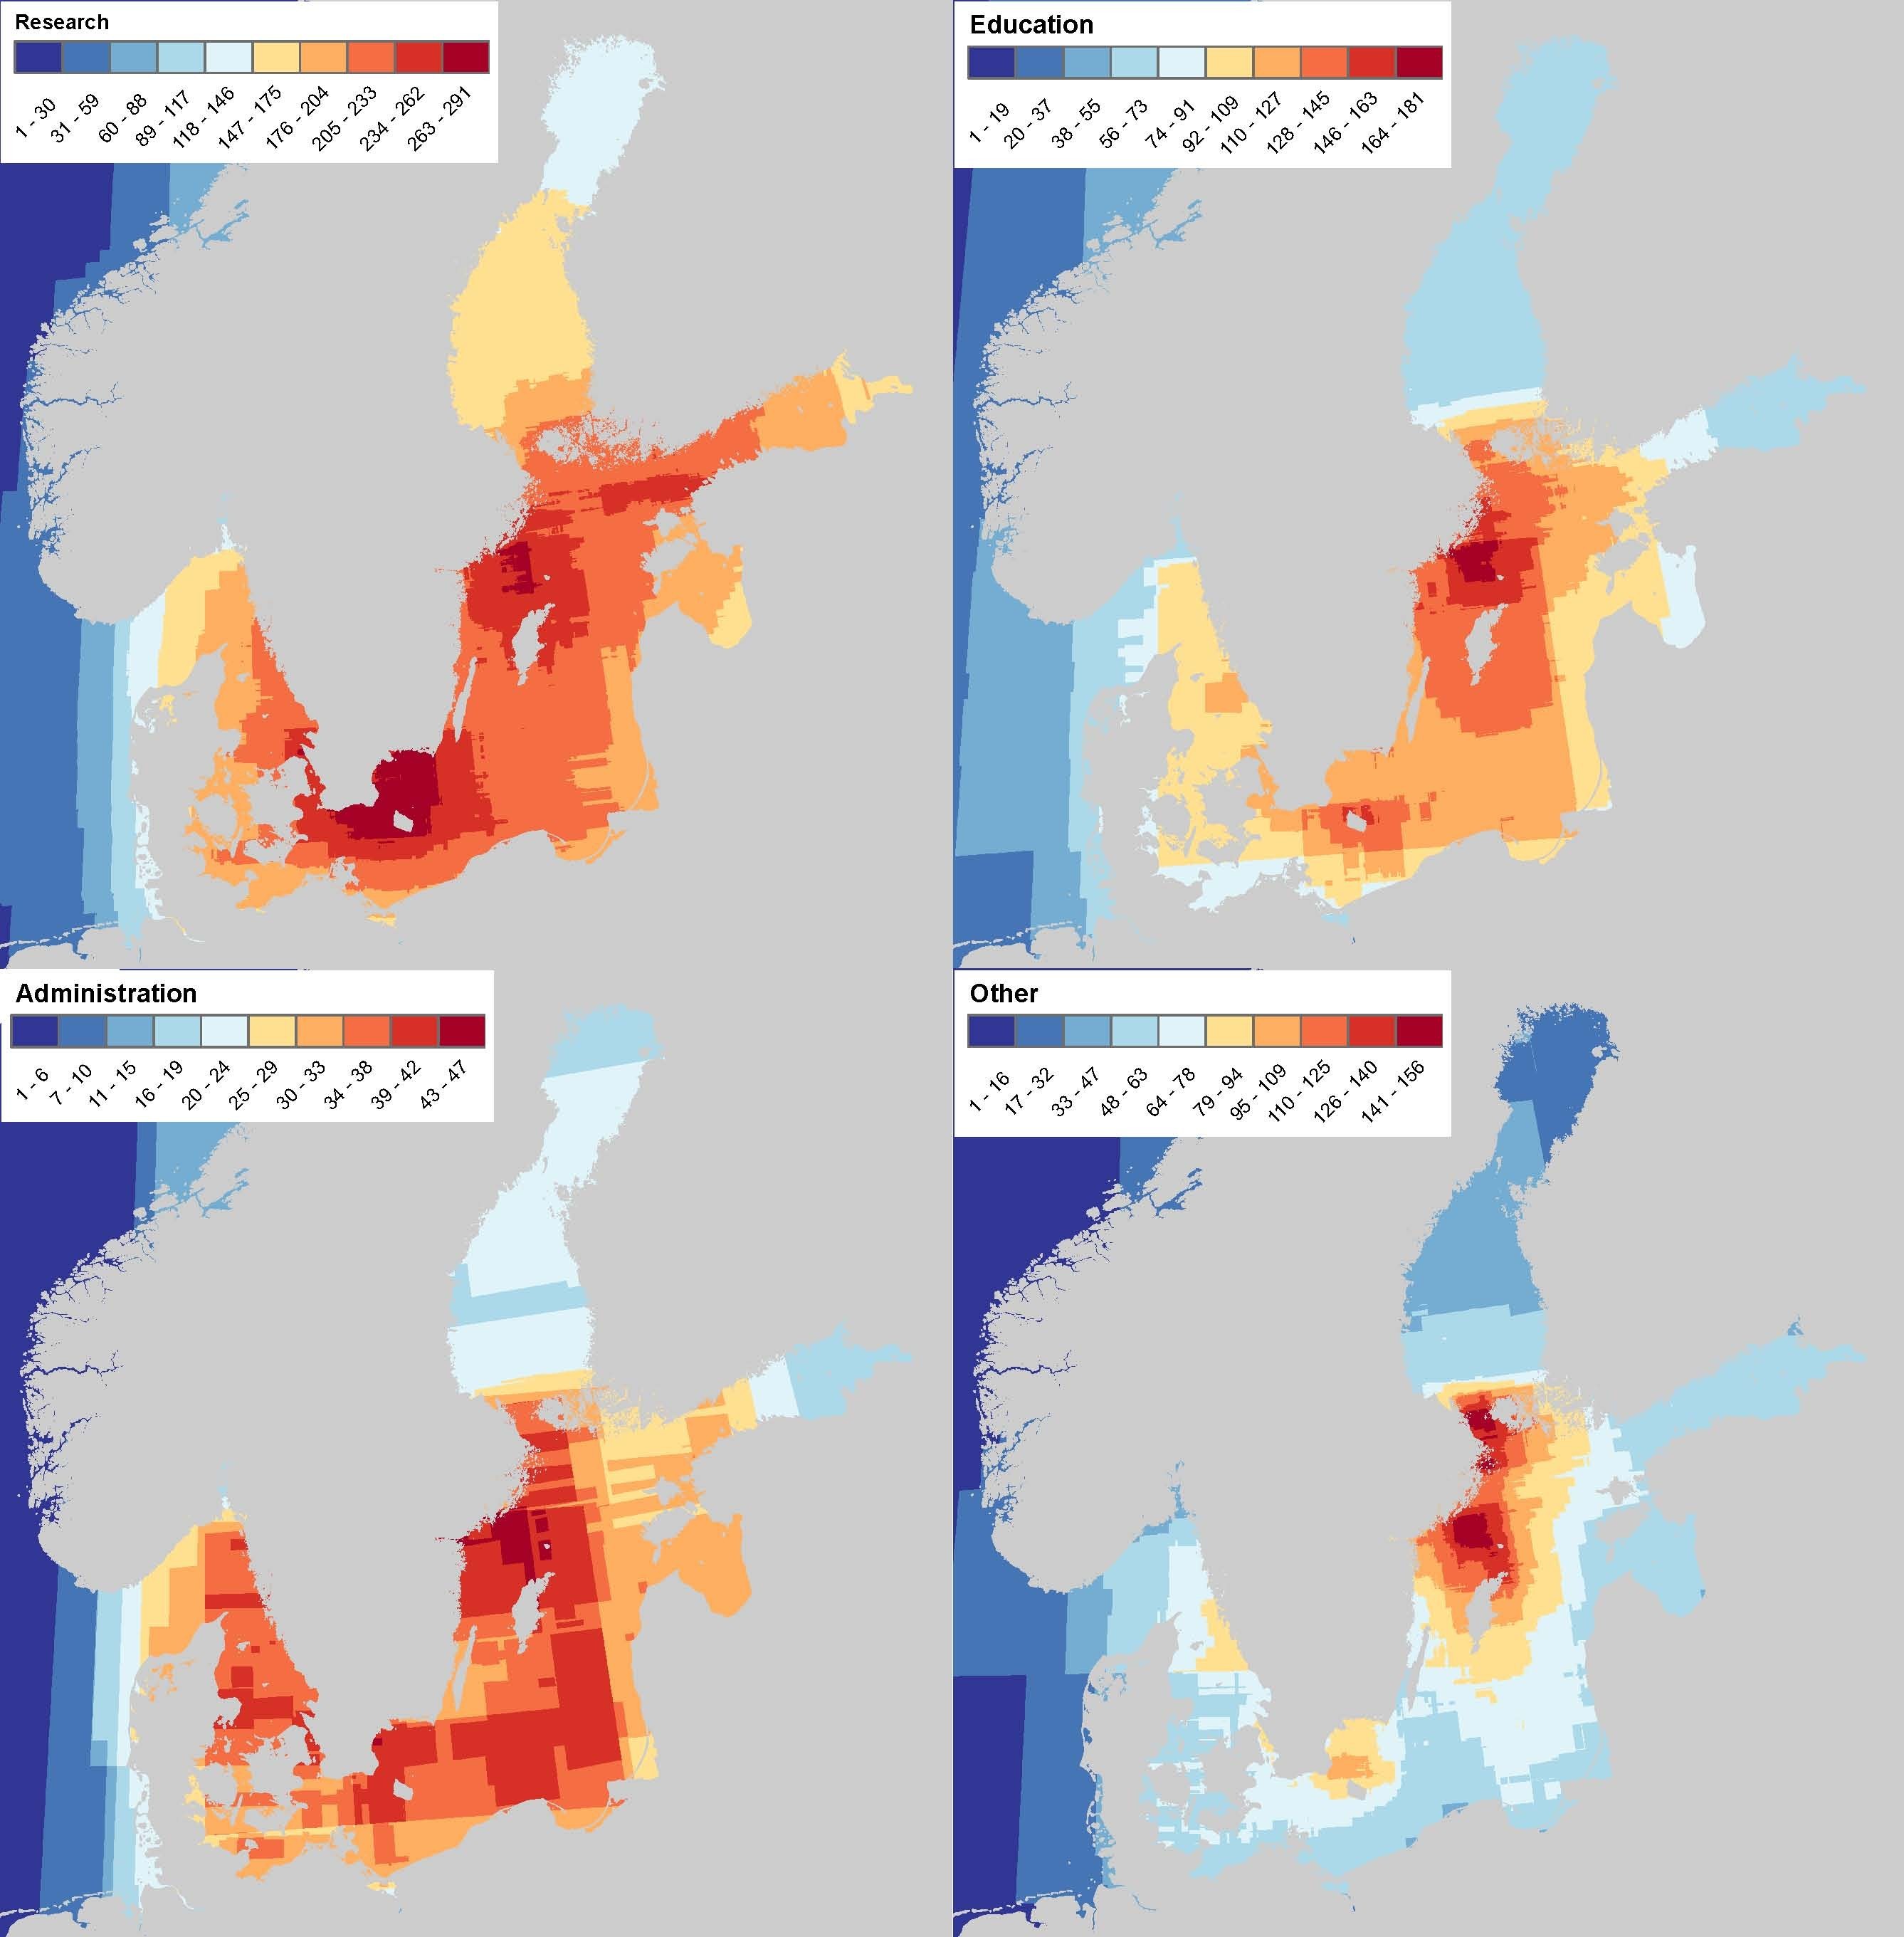
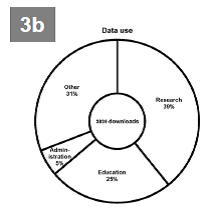
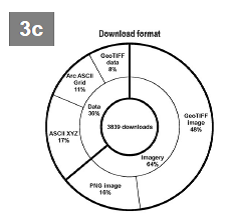
Figures 3a-c summarize (a) how frequently a specific area has been downloaded for each use category; (b) data use; and (c) format of the downloaded data. Note that this only includes the downloads requested through the web site, and not utilization via the OGC services, for which it is more difficult to obtain accurate usage statistics.
The maps showing the frequency with which areas of the BSBD are downloaded (Figure 3a) is quite similar to the research intensity map published by Hell et. al. (2011), namely in showing a much higher interest in the Southern Baltic, as opposed to say the Bay of Finland or Bay of Bothnia. The comparably higher interest in the Swedish part of the Baltic Proper is probably due to the fact that the largest portion of BSBD users are from Sweden, whereas there has been a bias towards Germany for the IOWTOPO grids.
As shown in Figure 3b, most of the data is being downloaded for academic purposes, namely research and education. Administrative use accounts for only 5%. Apparently almost one-third of the download requests do not fit into the predefined use categories. The areas where data is downloaded most frequently varies between the use categories (Figure 3a): Research is most spread over the entire Baltic Sea area and most intensive between the Swedish south coast and the island of Bornholm. Administrative uses are quite homogeneously distributed, except for the Bothnian Sea and the Gulf of Finland. Data downloaded for education is focused around the Landsort Deep. The deepest point of the Baltic Sea also attracts most downloads that do not fall into any of the previously named categories. Probably a lot of these downloads originate from the general public, which would explain the high interest in prominent regions such as the Landsort Deep or the Stockholm archipelago.
Regarding download formats (Figure 3c), almost two-thirds of the download requests are for imagery (GeoTIFF colored and shaded relief; PNG), rather than actual data grids (ASCII XYZ; Arc ASCII Grid; GeoTIFF single channel 32-bit depth data). ASCII XYZ data is the most commonly requested data format of the formats offered. There have, however, been requests for NetCDF, which now is supported by Web Coverage Service.
Collaboration with other data compilation initiatives
After its release, the BSBD has quickly gained interest from other bathymetry data compilation efforts, namely the IHO/IOC General Bathymetric Chart of the Ocean (GEBCO) and the European Marine Observation and Data Network (EMODnet).
GEBCO is an international group of experts who provide a global bathymetry grid of the World Ocean at a resolution of one arc-minute. It was established in 1921 and is governed by both the UNESCO’s Intergovernmental Oceanographic Commission (IOC) and the IHO. Until now, most of the Baltic Sea in GEBCO was derived from IOW-TOPO2. BSBD version 0.9.3 has been delivered to GEBCO for inclusion in the upcoming GEBCO 2014 model.
During phase 2 of the EU initiative EMODnet, a one-eighth arc-minute bathymetry grid of the European seas is being developed. BSHC represented by the BSBD working group acts as data provider for the Baltic Sea and data derived from the BSBD will be included in EMODnet at a spatial resolution of one-quarter arc-minute.
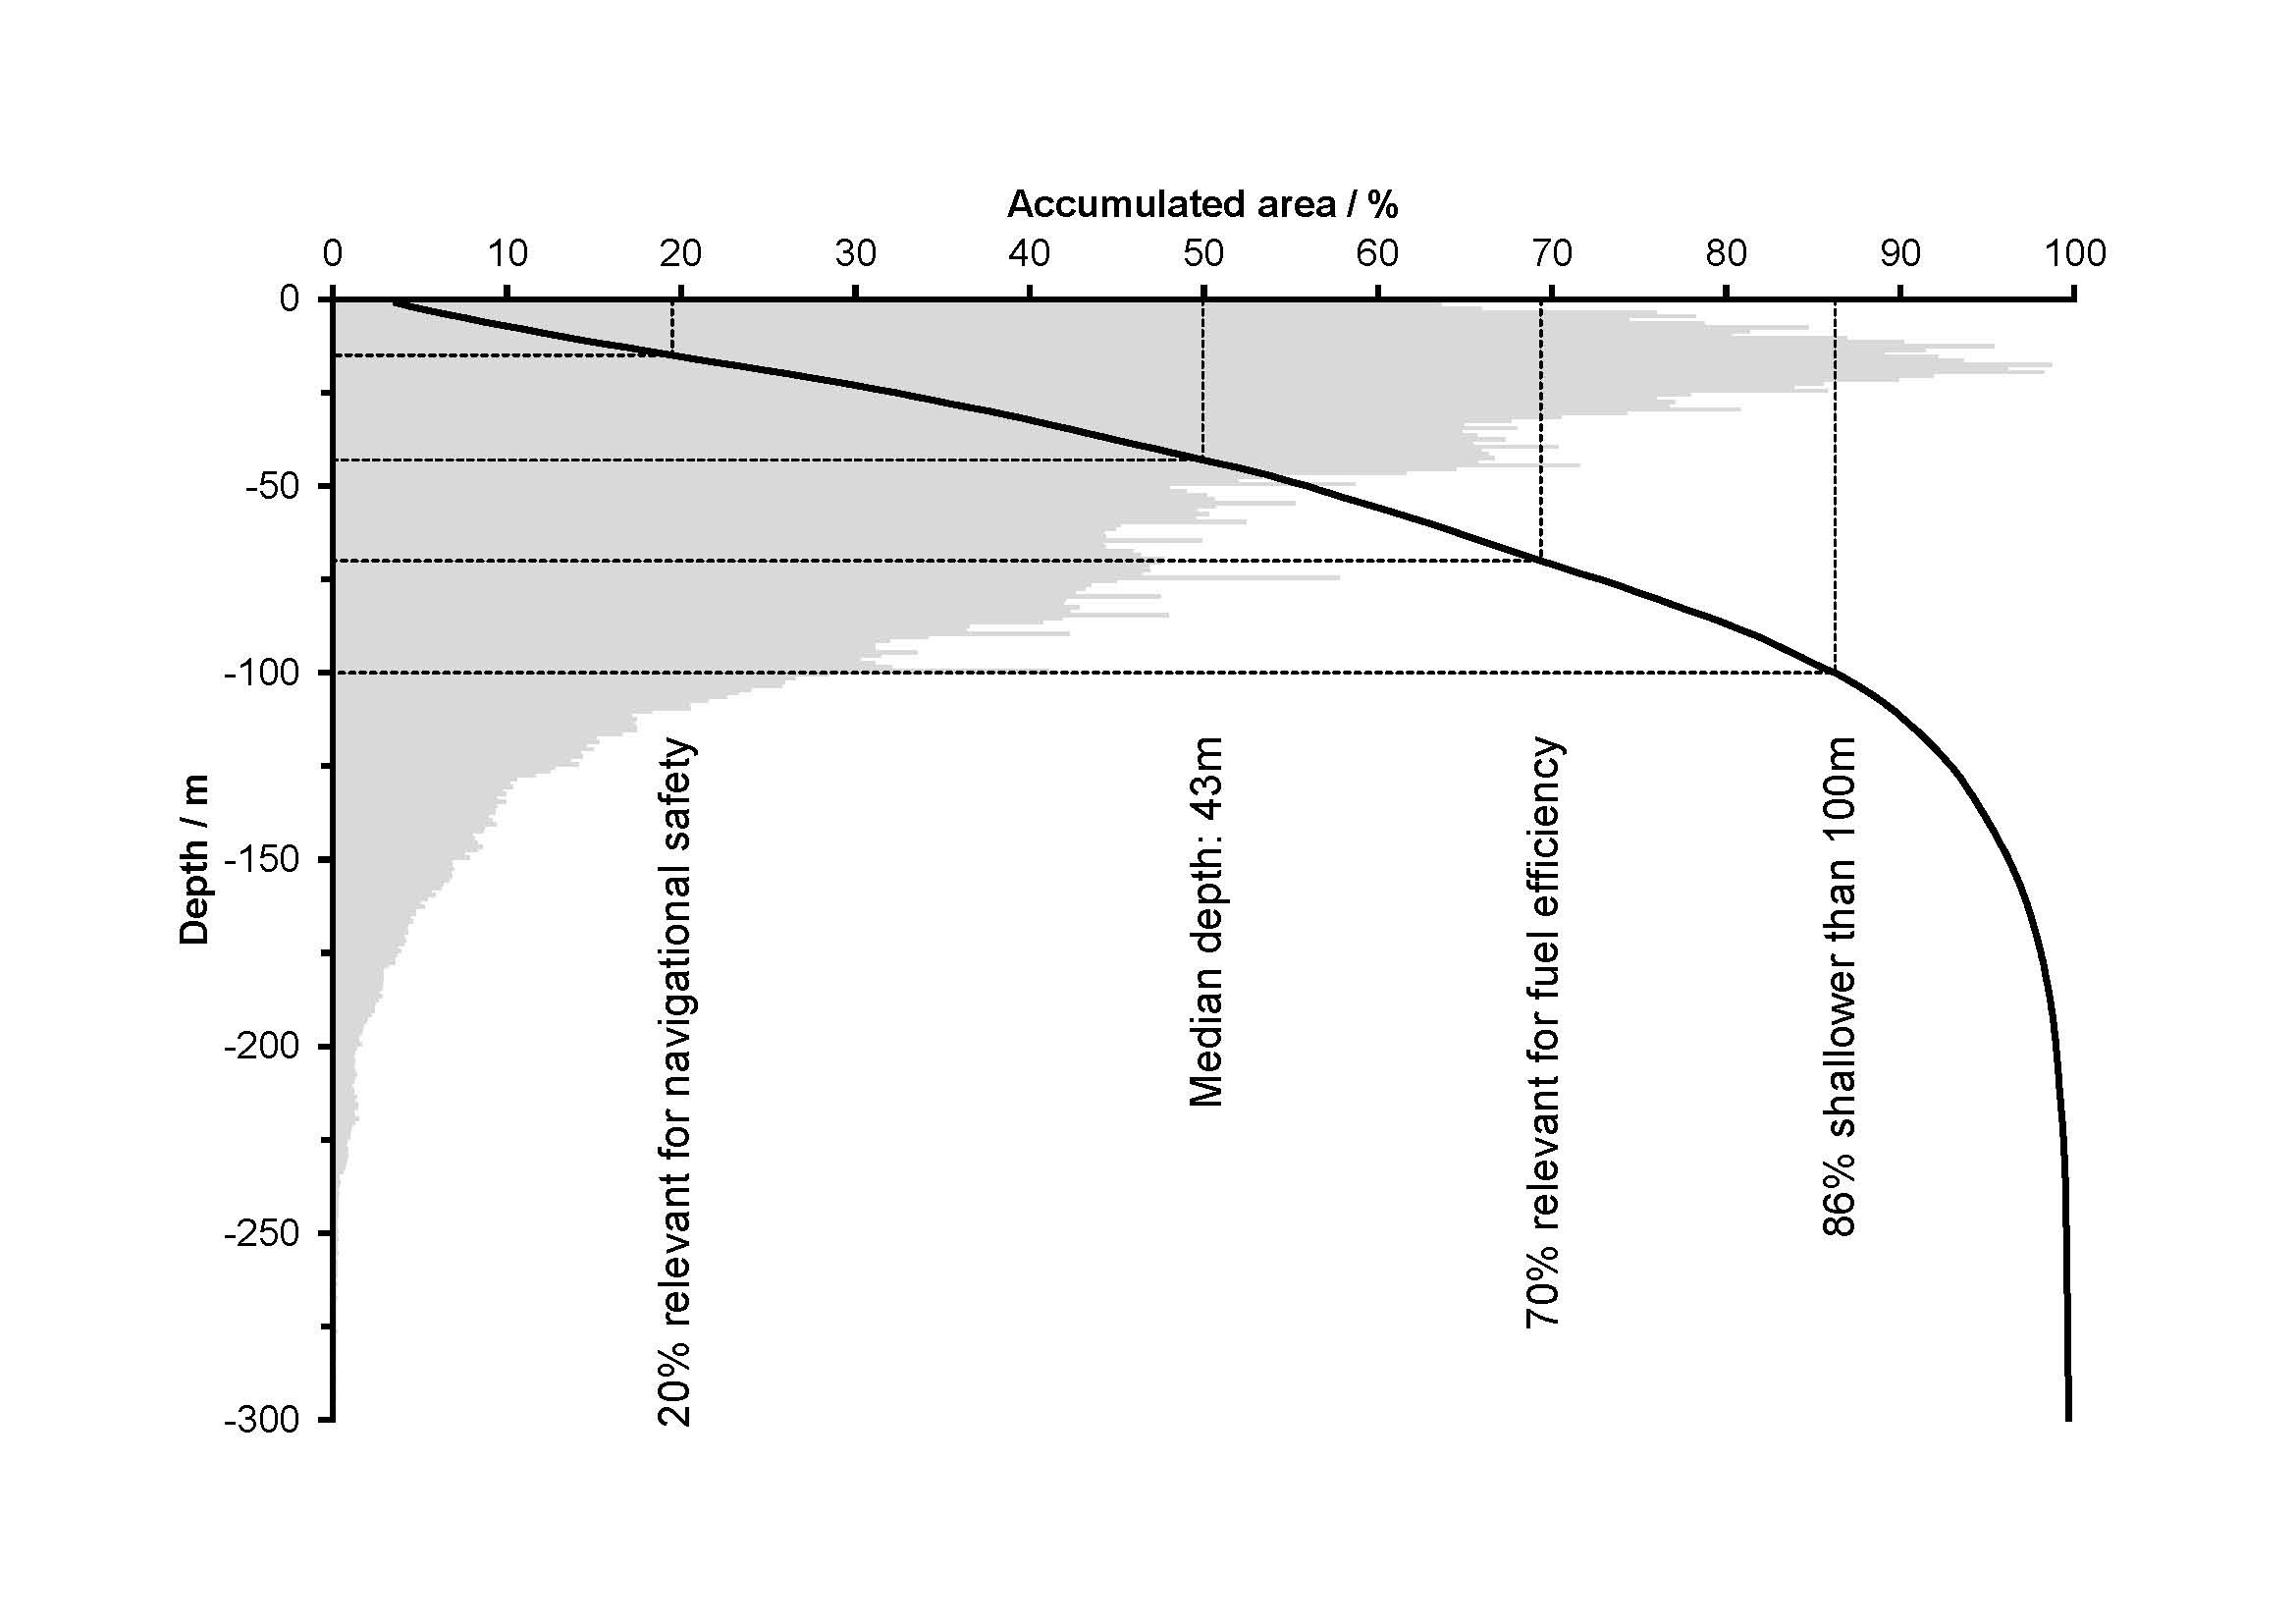
The hypsometry of the Baltic Sea
Figure 4 shows the hypsometry derived from the BSBD grid, i.e. the total area of each specific depth value. Even though the deepest point in the Baltic Sea reaches 456.5m in the Landsort Deep, 86% of the Baltic Sea is shallower than 100m. The median depth of the Baltic Sea is 43m, only a little more than one per cent of the World’s oceans median depth.
Approximately 20% of the Baltic Sea is shallower than 15m, the maximum draft of vessels navigating in the Baltic. Almost 70% of the area is shallower than 70m, about the maximum depth for squat effects to be relevant for the fuel consumption of large vessels. Even these relatively shallow areas are yet to be completely mapped. More hydrographic surveying needs to be done to ensure safe vessel navigation can occur with minimal environmental impact.
Conclusions
The Baltic Sea Bathymetry Database (BSBD) presented in this article is one significant step forward since our study of the needs regarding bathymetry data in a highly vulnerable but economically important and shallow sea such as the Baltic (Hell et. al., 2011). With the release of the BSBD grid, a single access point for detailed Baltic Sea bathymetry data has been established. Nevertheless, the work is far from finished with large parts of the area yet to be sufficiently mapped. Furthermore, legal, defence and economic aspects prohibit releasing a depth model with higher resolution at no cost at this time. Such a model would be required to fully satisfy the users’ needs as outlined in our previous study.
Therefore, the BSBD must be seen as ongoing work. It will receive regular updates — up to a few times per year — as better source data becomes available, or when legal, defence or economic circumstances change.
Already today, the Estonian and German hydrographic offices would allow their data to be re-distributed in much higher resolution than the present 500m. Although this would imply the BSHC abandoning the concept of a homogeneous model for the entire Baltic Sea, an additional high resolution model is being considered for these countries.
Acknowledgements
The authors are grateful for the comments by two anonymous reviewers, which significantly improved the manuscript. This work was co-financed by the European Union Trans- European Transport Network and received funding from the Swedish government.
References
- Danielson, J.J., and Gesch, D.B., (2011), Global multi-resolution terrain elevation data 2010 (GMTED2010): U.S. Geological Survey Open-File Report 2011–1073, 26 p., http://pubs.usgs.gov/of/2011/1073/pdf/of2011-1073.pdf. Accessed Jun. 12, 2014.
- General Bathymetric Chart of the Oceans, The GEBCO_08 Grid, version 20100927, 2010. http://www.gebco.net/. Accessed Jun. 2, 2014.
- Hell, B. and M. Jakobsson (2010). Gridding heterogeneous bathymetric data sets with stacked continuous curvature splines in tension. Marine Geophysical Research, 32(4): 493-501. DOI: 10.1007/s11001-011-9141-1.
- Hell, B., B. Broman, L. Jakobsson, M. Jakobsson, Å. Magnusson and P. Wiberg (2011). The Use of Bathymetric Data in Society and Science: A Review from the Baltic Sea. AMBIO, 41 (2): 138-150. DOI: 10.1007/s13280-011-0192-y.
- Korhonen, J. (2014). Baltic Sea Hydrographic Re-survey Scheme, International Hydrographic Review, November 2014.
- Seifert, T., F. Tauber and B. Kayser (2001). A high resolution spherical grid topography of the Baltic Sea – 2nd edition. In Baltic Sea Science Congress. Poster 147. Stockholm.
- Smith, W. H. F. and P. Wessel (1990). Gridding with continuous curvature splines in tension. Geophysics, 55(3): 293-305
Biographies
Benjamin Hell: A geophysicist by training, he has started working with the Baltic Sea Bathymetry Database while he obtained a PhD in marine geoscience from Stockholm University. Today, he is working as a project leader for the Swedish Maritime Administration.
benjamin.hell@sjofartsverket.se
Hans Öiås has a High School degree in Electric Engineering at the Ebersteinska Higher Techno- logical School in Norrköping. He has also studied a Higher Course in Computer science specializing in Logistics and Production Management as well as some courses in structured programming and GIS at the Linköping University. He has worked for the SMA since 1986 as a survey systems engineer and hydrographic surveyor. He has experiences in system development, system integration as well as procurements of both survey systems and hydrographic surveys. He was appointed as Project Manager for the development of the Baltic Sea Bathymetric Database within the MonaLisa Project.