
Abstract
This paper provides a brief description of the Estonian Hydrographic Information System (HIS) as implemented in the Hydrographic Department of the Estonian Maritime Administration (EMA). The paper outlines the purpose, structure and usage of the HIS. The HIS is a seamless depth database, survey maintenance system, survey planner and data provider. The HIS can be accessed over the web.
Preface
Modern hydrographic surveys have been performed in Estonia since 1995. Surveys with multi-channel and multi-beam systems had led to an increasing amount of data which have to be maintained. Also the need for survey data by different users for different purposes is increasing every year. Compiling sea charts is only one of many uses of the data. Users want to get data quickly, easily and preferably over the web.
These issues, together with other problems have raised the importance of establishing a database-driven system. This capability makes it possible to plan and control different survey stages, store and access data, create automatic backups, prepare and share data for different uses accessible by an intuitive web-based interface.
Basic Concepts
The HIS has been designed considering a number of important spatial concepts such as:
Survey Areas:
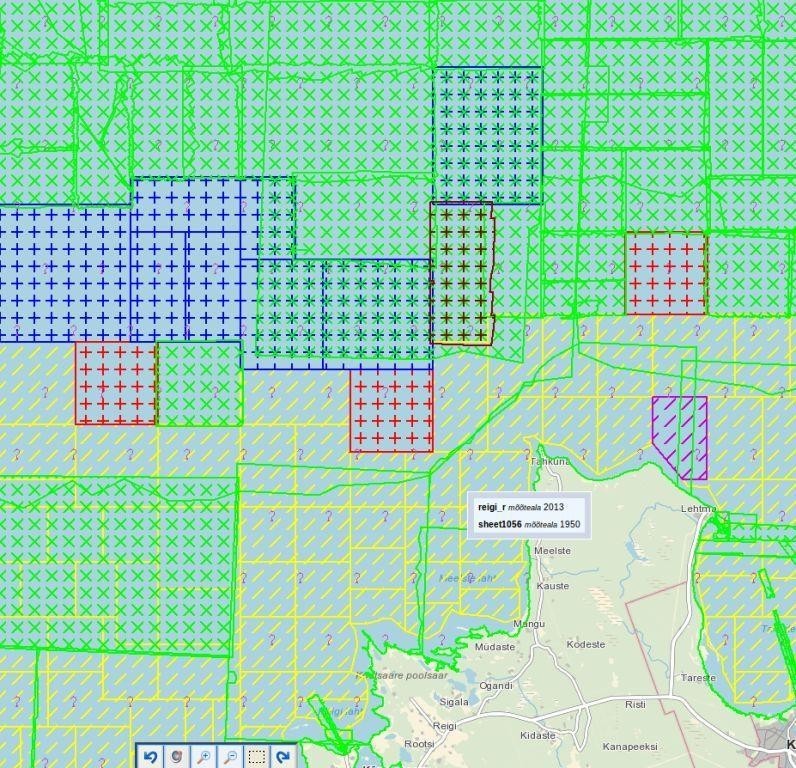
The most important concept for the HIS is Survey Areas. All Estonian waters including larger inland water bodies are divided into survey areas. A Survey area is a folder with data from survey lines and some additional data files. The additional data files include area borders, statistics, defined underwater objects and all processed depths. These files are in a simple ASCII format enabling the HIS to read these files and automatically populate the databases. Survey areas have different statuses according to their survey stage. The stages define the survey work-flow and include:
- planned;
- under survey;
- surveyed;
- under processing;
- processed;
- under validation; and validated
Only the last status (i.e. validated) makes data from this survey area accessible by users. The areas can be viewed and maintained through the HIS but also in survey and post-processing software. This makes it possible for planning, maintaining and controlling surveys.
- Cells: Estonia is divided into 10×10 km cells, which match exactly with the Estonian base land chart layout. HIS uses these cells for seamless depth and contours database. Depths are stored in cells in different resolutions. Viewing and querying the depth data means getting the data from the relevant cells in the resolution needed. That makes it possible to view data in web mapping services quickly. The same is true about depth contours. The cells are filled automatically from survey areas when new validated data are available.
- Overlap Handling: In order to query depths or objects from overlapping survey areas, some automatic procedures have to be performed. First topological analysis of area borders gives exact areas where overlapping occurs. A second procedure analyses relevant survey areas and finds which ones have better quality and/or newer data. These data will have precedence over others. Querying depths from the HIS, provides only the newest and better quality data irrespec- tive of the overlap. The above-mentioned cells are filled the same way.
- HIS Data: The HIS does not store all available data. This would be simply too much information. Depths are stored in approximately 1m resolution in depth tables (one table per survey area) and a maximum 4m resolution in cells. Data in full resolution from survey areas are stored as files, so a higher resolution is available if needed. For most uses, a resolution up to 1m has been satisfactory.
Data
The HIS stores and displays the following data:
- Survey areas – borders and meta-data: Meta-data includes area status, area size, total survey line lengths, amount of survey lines, survey time, equipment, ship, surveyor, data cleaner, data validator, statistical data (min/max depths and coordinates, amount of points), quality estimators (standard deviation, mean, IHO S-44 order evaluations). Quality estimation is based on overlapping depths from different survey lines.
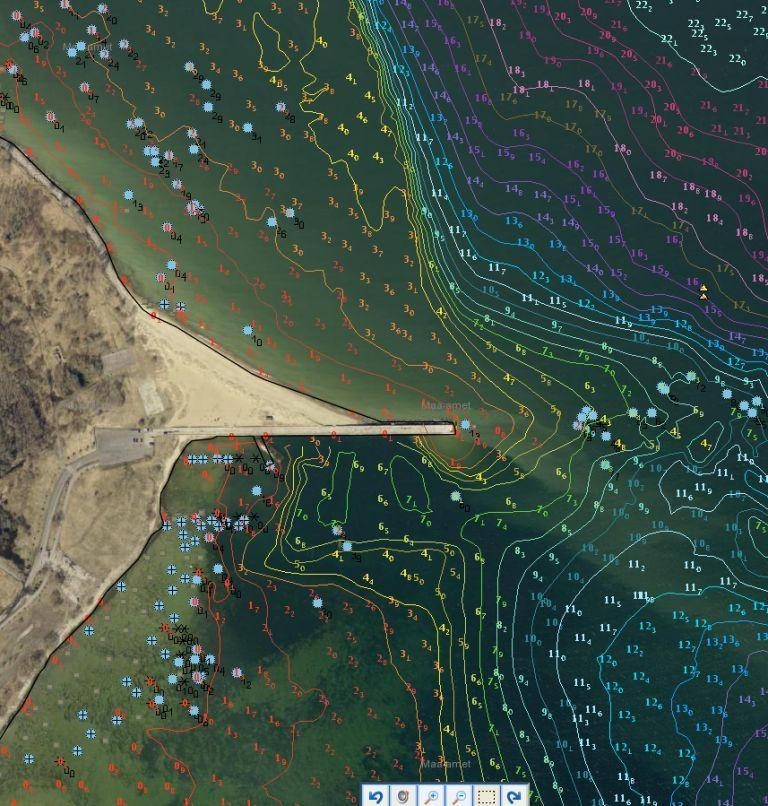
- Depths in up to 1m resolution: Cells store depths in 11 different resolutions from 4m to 200m. On a web map, depths are shown from cells, so starting from 4m resolution. Cells also store depth contours at 1m intervals.
- Underwater objects: These include rocks, wrecks and obstructions. Wrecks can have a number of different information ranging from simple dimensions and coordinates through to lengthy records comprising ship’s history and different pictures of the wreck and the ship.
The HIS is also linked to some other databases and this shows information about aids to navigation and harbours. This is useful for getting a complete overview of data in some regions. The HIS also shows WMS data in the background – currently Estonian land maps, orthophotos and S-57 cells from PRIMAR.
The HIS does not store only data collected by the EMA, but also data collected in Estonian waters by private companies. These data needs to be converted into ASCII formats readable by the HIS and the storage procedure is the same as with EMA-sourced data. According to Estonian laws, all private compa- nies doing surveys for navigational purposes in Estonia must get permission for the survey and then provide their data to the EMA. Also any foreign surveyors must provide the collected data to EMA.
For viewing of the map, the data are organized as different layers which can be switched on/off depending on needs.
Queries
Queries can be textual, spatial and combined. Textual queries are performed using query builders for any data type in HIS. Spatial queries are performed by keying in coordinates or drawing polygons on a map. Such defined areas act as additional restriction to textual query if so desired. Outputs can be redirected to tables on screen or to different types of files.
Selecting objects on the map brings up the full information about the particular object. Hovering the cursor over objects brings up tool-tips with basic information. Query results can be seen on the map as highlighted objects.
HIS Usage
The HIS can be accessed in restricted, semi-restricted and public versions.
- Restricted version is used by workers of the Hydrographic Department of EMA for loading and accessing raw survey data. Of course, they can do also everything else that the HIS supports. Surveyed areas are loaded into HIS and then are downloaded from HIS for data processing and loaded back after processing. The data is then extracted for validation and loaded back after validation. Each processing stage is recorded in the HIS and this provides transparency and an audit trail on the survey data and which person is dealing with certain survey areas.
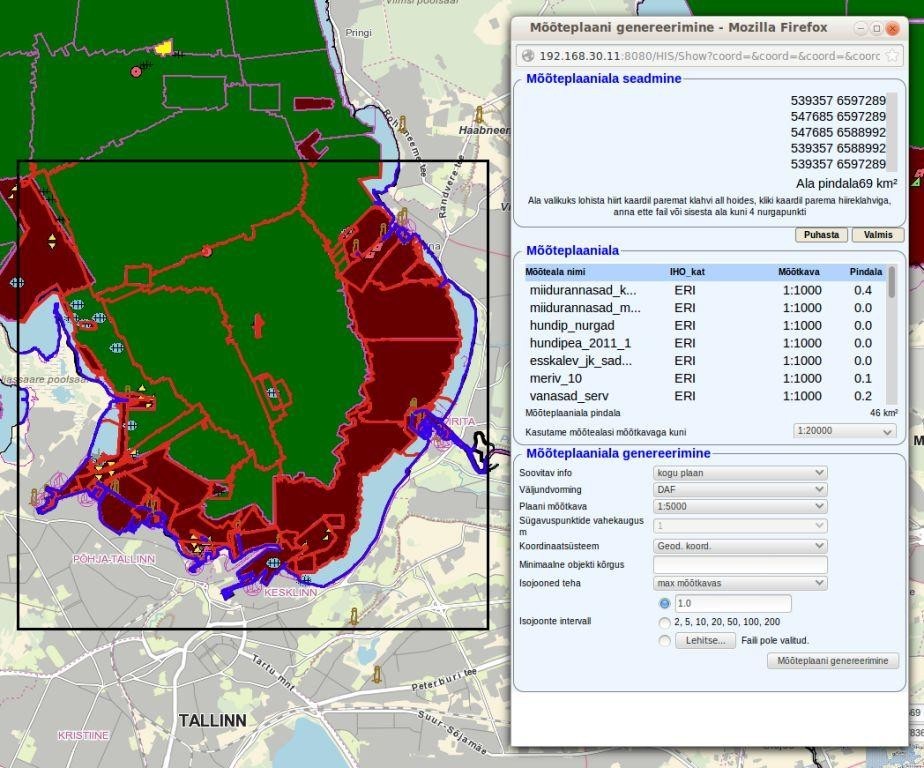
- Semi-restricted version is used by other EMA workers to obtain validated survey data. The biggest users are the Cartographic Department (CD) for compiling charts and the Waterways Department for planning new waterways and dredging works. For chart compilation, Dkart DAF (Dkart Ascii Format) format is used as it is S-57 in simple ASCII format and the CD uses Dkart for chart compilation. Obtaining data for charting means first defining the required area (by coordinates or interactively from map), scale and contour intervals. The HIS then finds survey areas inside the defined area, analyses overlaps, extracts depths, objects and contours, performs sounding generalization into the desired scale, creates necessary meta-objects from survey areas and saves all data into the DAF format. Alternatively, DXF and ESRI Shape formats are also available but they do not represent S-57 objects, and also do not include meta- objects. Depths and contour output depends on the desired scale or output resolution. Starting from a scale of 1:5000 or depth resolution of 4m, the data are taken from cells instead of depth tables of survey areas. This significantly decreases depth extraction time as data in cells are already prepared into the desired scale. It also makes possible depth extraction from very large areas, even from all Estonia (total area of larger water bodies is around 36,000 km 2 ). For exam- ple, extracting data in 50m resolution to help populate the Baltic Sea Bathymetric Database (www.bshc.pro), developed under the umbrella of BSHC and hosted by Swedish Maritime Administration, is done this way. There have been many uses requiring data from large areas in different resolutions, mostly for varying scientific purposes.
- Public version is available for the public but currently only for viewing data. Direct downloads from HIS for the public will be allowed. Obtaining data for persons outside EMA is possible by asking HD for data from interested areas. All requests are tracked to know to whom and which data has been prepared. Data are available for free, in all resolutions that HIS supports and in several formats. So far XYZ, DXF and ESRI Shape formats have been mostly used.
The HIS also provides a web map service (WMS). The same data and the same resolutions as on HIS web page are available from this site: http://195.80.112.238:8080/HIS/WMS?REQUEST=GetCapabilities
Technology
The HIS is based on open source technology. HIS consists of the following: PostgreSQL with PostGIS, Apache web server, GMT, GDAL/OGR, Fopen map server. All this runs on a linux server. There are also other linux servers for backups which are done automatically using mostly pgdump and rsync. The HIS has been developed by joint cooperation between EMA and a small Estonian company called R-systems.
Conclusion
The HIS has for some years been a very valuable tool for many different tasks starting from surveys management and ending with data viewing/extracting for very different purposes. Compilation of sea charts is much easier and less time consuming using HIS as there is no need for dealing with individual surveys. HIS creates a basic chart automatically. The cartographers need only to add additional data and do final compilation.
Processes in the HIS do not consume very much resources, are traceable in all stages and easy to use for both specialists and ordinary persons. The HIS has made dealing with survey data easier for everyone who needs such data.
Biography
Peeter Väling was born in Tallinn, Estonia and graduated from the Tartu University in Geology in 1992. He worked as a marine geologist in the Estonian Geological Survey during 1992 – 1994. Since 1994, Peeter has worked in the Estonian Maritime Administration as a Hydrographer. From 2006 he was the Chief Hydrographer and since 2013 he has been the Head of the Hydrographic Department.