


Abstract
Introduction
Airborne laser bathymetry (ALB) has been used in the very clear waters of Australia and other regions for a few decades [Banic et al., 1987]. Similar to topographic airborne laser scanning, ALB uses optical laser distance measurements, but normally with two laser beams (red and green). The red laser is reflected from the water surface, and the green primarily from the sea floor. The difference between the two values is the slant distance in the water, and provides the water depth. The green laser also gives a response from the water surface, and this has led to development of a new compact system that only uses the green signal to calculate the slant distance. The systems are now receiving full waveform data and analysing the full waveform and extracting further information about the water column and the seabed seems to have a great potential for enhancing the final outcome of Bathymetric LiDAR.
Although the turbidity of the Baltic Sea is considerably higher than the Australian waters, several hydrographic services in the Baltic Sea region have investigated whether it makes sense to use this technology in shallow coastal areas. Test campaigns in recent years provided quite disappointing results. The seabed was not reached in deeper areas, there were many gaps in the data, and the obstruction detection was poor.
Recently, new systems have been developed, and more recent test campaigns have resulted in greatly improved results in European waters. Of particular note are several surveys with ALB along the French coast [Pastol, 2011], which has inspired new test projects in several European countries. To initiate better coordination and awareness of the potential value of this new technology, the Baltic Sea Hydrographic Commission tasked Germany to host a seminar on LiDAR bathymetry. This seminar took place in May 2014 in Hannover; this paper will highlight some of the relevant discussions from that seminar.
Finnish Laser Bathymetry test in 1999
An early test of LiDAR bathymetry in Finnish waters was performed in 1999. LADS Corporation Ltd. from Adelaide, Australia performed a laser bathymetry survey for Finnish Maritime Administration (FMA) Hydrographic Surveys Division in the Finnish Archipelago Sea.
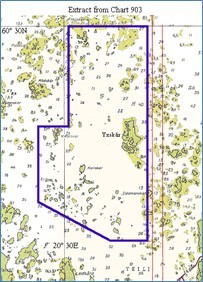
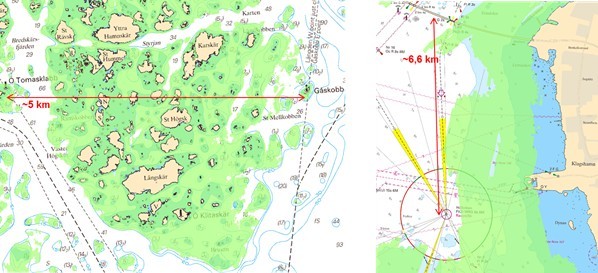
The test area was shallow and previously uncharted, and is located to the northeast of Åland Island. Figure 1 is an earlier chart extract from the survey area. The size of the survey area was 160 km²; after taking into account the line ends and swath coverage, about 190 km² were actually surveyed.
About 27 km² of the area is dry land (islands).
Prior to the survey, a reconnaissance survey was performed in the end of July 1999, and gave 6-7 meter Secchi disc depths. The same Secchi results were obtained in a second survey in September. The survey itself was conducted in November, and took two full eight-hour survey flights to complete due to short lines; patching and reruns were done on a subsequent third flight. Some of the survey lines were resurveyed from the opposite direction, as the presence of islands and dry areas shut the laser down automatically. The survey was able to record depths between 3 – 15 meters, and covered about 82 km², about 50% of the total survey area.
The survey resulted in a total data amount of 10 GB, consisting of about 5 million depth values. The values covered a 5 m x 5 m grid, and values for a 15 m x 15 m grid were automatically generated from the raw data. The sounding rate of the LiDAR system was 900 soundings per second, which is considerably lower than modern systems can achieve. The operating height was 500 m and 370 m, and the survey speed was 175 knots. Kinematic GPS was calculated during post-processing of the data, in which the position of the plane’s GPS antenna was accurate to 0.2 m (2 drms).
The survey results demonstrated that the laser beam had penetrated about two to two and a half times the measured Secchi depths. The laser beam could be detected at 15 meter depths and, occasionally, at 16 to 17 meter depths. Following a northerly storm during the survey, the Secchi depths were reduced to 3-4 meters, and laser depths to maximum 7-8 meters.
Processing the survey data constituted a laborious process, especially in the very shallow waters of the 5 m x 5 m grid, as compared to 15 m x 15 m grid.
Conclusions of the Finnish survey
As a result of the test in 1999, it was deemed that the data were good for most purposes and it was considered that IHO S-44 Order 1 had been achieved for both position and depth measurement. However, some problems were encountered at shallow water. When the laser hit dry land, the red pulse lost the water level reference surface and there was difficulty regaining the reference surface instantly. Also, the reflection from the water surface was so strong that the reflections from the shallowest depths (0 m-3 m) were either over-powered in calm weather or were not accepted by the model algorithm as proper depth values.
Water clarity was an issue in the Baltic Sea and necessitates a comprehensive Secchi-depth measurement before performing LiDAR bathymetry surveys. Also environmental conditions have to be taken into account as they have an evident effect on the visibility in water. From an economic point of view LiDAR bathymetry was not considered to be cost-effective enough in Finland for hydrographic purposes.
The German laser bathymetry project
In the intervening years, ALB was not seen as an appropriate tool for hydrographic surveys in the Baltic. The main reasons were the poor clarity of the water, limited penetration of the laser beams, low density of reflected beams, large gaps and reduced detection of objects on the seafloor. Several coastal states carried out initial tests that showed rather poor results. Among these was a simple test performed in Germany in 2008.
More recent developments in ALB technology have made it necessary to review the former findings and to perform more comprehensive investigations as to the current possibilities and limitations. This can be done by conducting test survey campaigns that include a significant number of flight lines. The German Bundesamt für Seeschifffahrt und Hydrographie (BSH) has launched a research project consisting of three flight campaigns and a scientific partnership of the Institute of Photogrammetry and GeoInformation, Leibniz Universität Hannover [Niemeyer et al., 2013 and 2014]. Parallel to the project, a close cooperation with other ALB stakeholders has been established. The main stakeholders include coastal protection authorities, the German Navy, the Water and Shipping Administration, which is responsible for maintaining the fairways, the land survey authorities and scientific institutes such as the Leibniz Institut für Ostseeforschung.
The main goal of the research project is to answer the question: In which areas of the German part of the Baltic, and to what extent, does it make sense to add ALB to the portfolio of hydrographic surveying techniques? And is it reasonable from the economical point of view? This also leads to some further questions:
– For modelling of the sea bottom:
- What is the role of the environment (visibility, sea grass, etc.)?
- What is the maximum depth for a reasonable survey?
- Does it make sense to do ALB in the shallow lagoons behind the coast?
– For identification of obstructions:
- Are 2 m objects defined by IHO S-44 detectable?
- What size of an object is certainly detectable?
- Is the detectability dependent on the depth?
– For the determination of the coastline:
- Is it possible to determine a DTM in the region of -1m to +1m (referred to chart datum)?
- Can the coastline be determined from such a DTM?
- Are the data gaps in very shallow water a problem for the determination of the coast-line?
– For the tendering process of an ALB survey:
- What are the possible flight parameters for the different purposes, modelling of the sea bottom, detection of obstructions, and determination of coastlines?
- What has to be considered when writing a call for tenders?
- How to calculate a price for budget planning?
The first campaign was tendered as a high resolution flight and took place in November 2012. The flight was done by the company MILAN using a RIEGL VQ820G system, the area can be seen in Figure 2.
Although it was a high resolution flight, obstructions could not be detected. Areas of seabed deeper than 5 m could not be modelled with a sufficient data density. However, the question, what density is sufficient, should be examined in more detail.
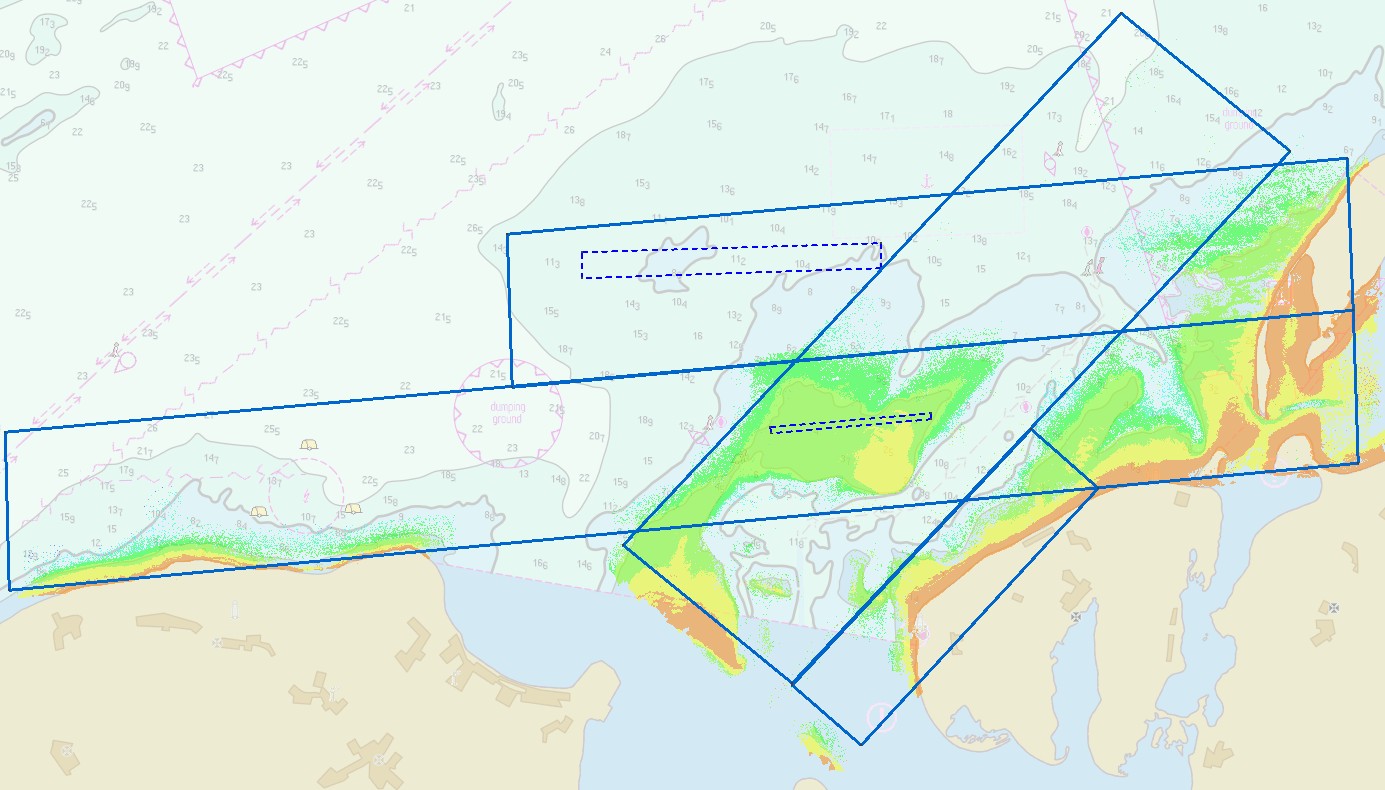
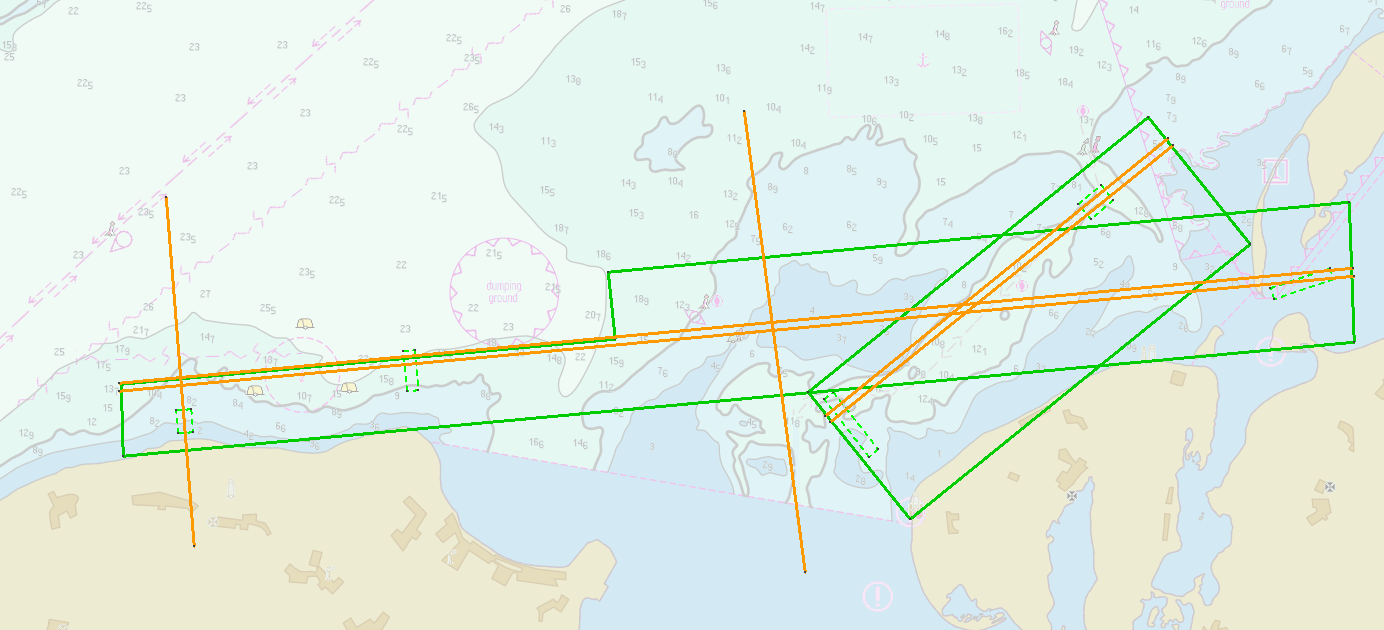
The second campaign took place in September 2013. Due to the fact that the first campaign only reached 5 m depth, this flight was tendered as a combined flight: one high resolution system together with a second system with higher penetration into the water column. The flight was done by AHAB together with the German company Top- Scan using the Systems Chiroptera and Hawkeye II.
Unfortunately, only a small airplane was available, so the two systems had to be used in two separate flights. Figure 3 shows the areas covered by both systems. Compared to the first campaign, the results reveal a much better coverage; however, the point density in deeper areas is much lower than in shallow areas. The processing of the data has required significant resources and is still underway at the time of writing.
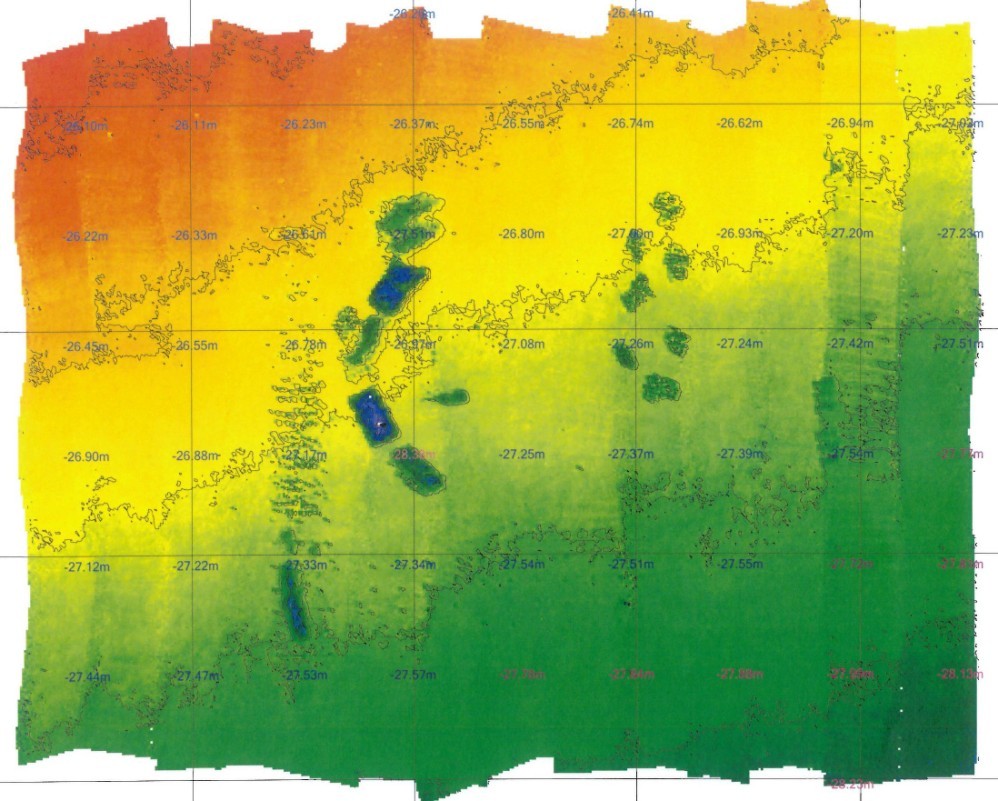
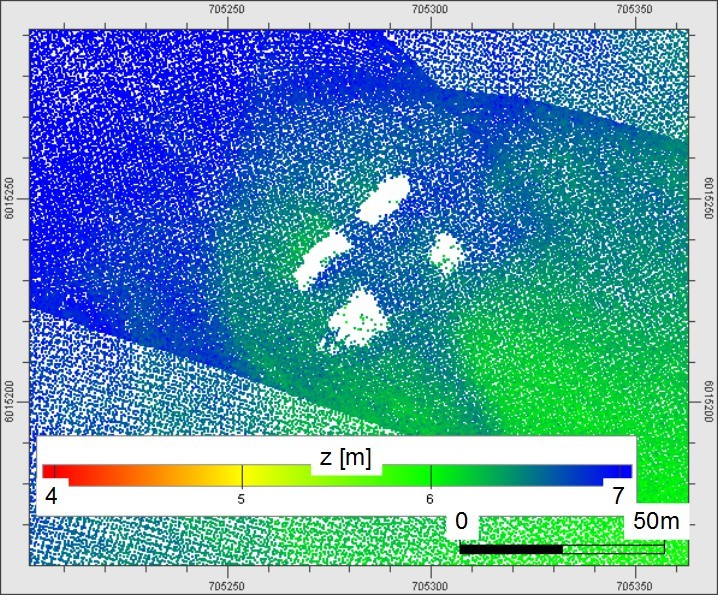
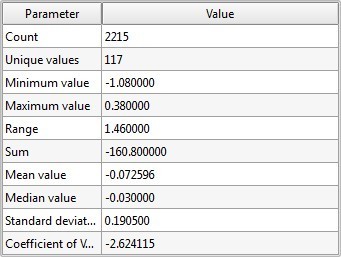
Additionally, it was decided in 2013 to survey two small areas with artificial reefs. These areas have been surveyed quite accurately with a multi-beam system (Figure 4), and may later be used as reference areas, and for checking the accuracy of a survey.
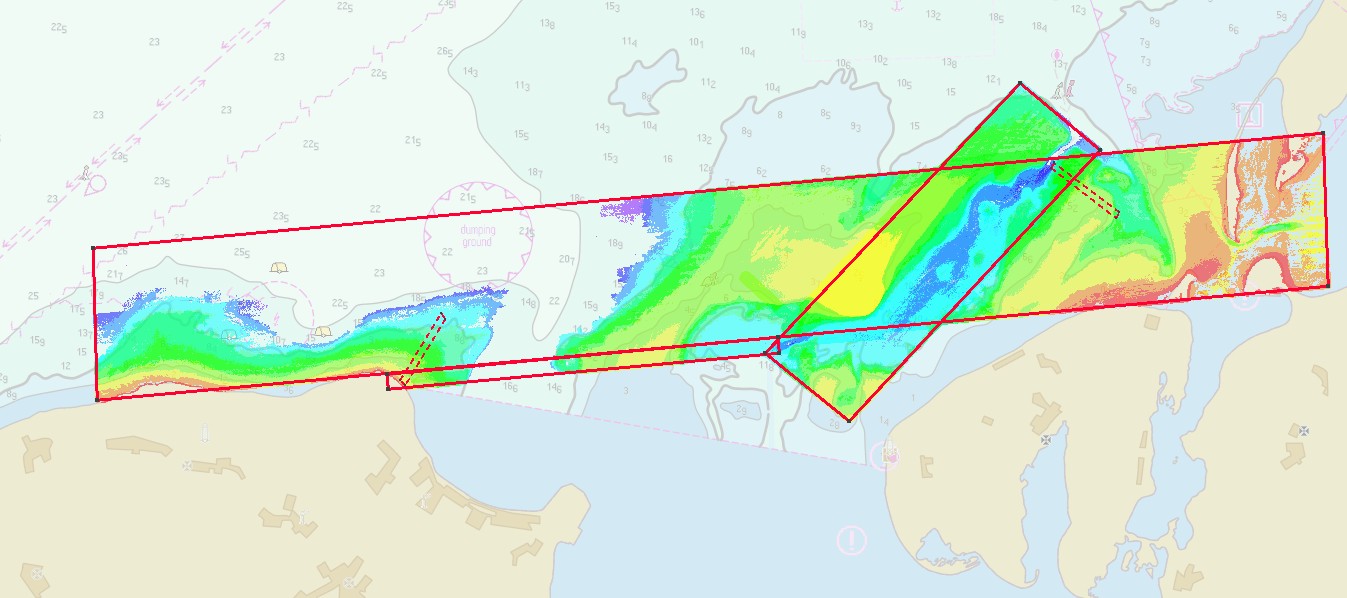
The third campaign in 2014 was tendered similar to the second one. The flight had to be done during the small window of good seasonal conditions in the spring. One goal is to compare surveys accomplished under different seasonal conditions. The flight has been offered by AHAB together with the Dutch/German company Aerodata using the new Hawkeye III. It has two green laser channels, one for shallow water (like Chiroptera), and one for deeper water (almost like Hawkeye II). However, this system was not available in April or May, so it was decided to fly in April/May with Chiroptera again and to repeat some flight lines in autumn, when Hawkeye III is available, cf. Figure 5. The Chiroptera data will be compared with the autumn data from 2013.
Thus three flights have been completed within the project, except for the additional flight in autumn 2014. The 2013 data still under evaluation and the 2014 data are just in the first phase of being processed. One of the first lessons to be learned is that processing and quality control of the data takes much more time than expected. Therefore, only very preliminary conclusions can be provided here.
The quality of the data is dependent on many factors. Accuracy seems not to be the most important one. The accuracy demands of S-44 order 1b can be reached in most cases if the data is processed carefully enough. But it is hard to describe what a careful processing means, and to find criteria that can be used when to decide on the acceptance of a processing result.
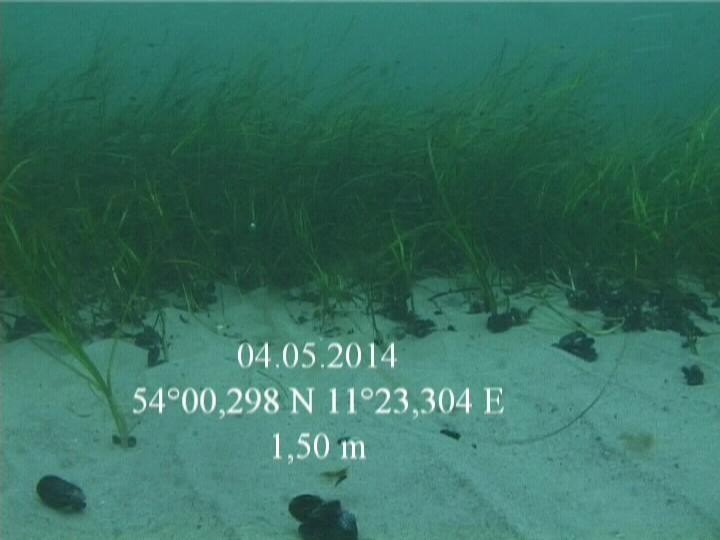
Further attention has to be directed to the data gaps. In greater depths the density of the data points becomes poorer. It is not easy to determine the density needed to calculate an appropriate DTM, or to derive the maximum depth to which the data can be used. This shall be an important outcome of the project, when all data are evaluated. Even in shallower areas there are larger gaps, each year almost at the same place. During the project some of these places have been inspected by diver. On all these places sea grass has been found abundantly, one example is shown in figure 6 (with Zostera marina). So it seems that optical absorption is the reason for the data gaps.
The same reasons may have led to data gaps on the positions of obstructions at the artificial reefs “Nienhagen” and “Rosenort” (Figure 7) – if it is not just the problem that the shallow depth data are considered as outliers during the processing. Processing the full waveform analysis will hopefully provide a clearer explanation.
Lessons learnt from Danish LiDAR Bathymetry
BLAST-project and the need for surveys in shallow water
Large areas of the inshore waters of Denmark are categorized as shallow water. Almost all of these shallow waters have only been surveyed by historically outdated technologies and methodologies. A significant number of these surveys date more than 100 years. Today, multi-beam can measure depth wherever surface navigation is possible, but experiences in Danish surveys show that it is not economically or practically feasible to measure Denmark’s shallow waters from the coastline out to 6 meters depth with multi-beam.
The numbers of stakeholders who have interest in the shallow waters are increasing due to new legislation, the need for administration and emergence of new opportunities and activities in the coastal zone. The Danish Geodata Agency (GST) has therefore taken an interest in new technologies that can survey the shallow waters in Denmark.
GST had the opportunity to test and evaluate bathymetric LiDAR as a tool for surveying shallow waters though the EU-project BLAST from 2009-2012 – “Bringing Land and Sea together” (http:// www.blast-project.eu). BLAST was a regional project for better integration of information across the costal margin in the North Sea region and focused on addressing the needs of marine spatial planning and the instruments to support coastal zone plan- ning and management (ICZM).
Bathymetric LiDAR appears to be a potential tool for gathering data that can support ICZM in general. Most often, a smooth seabed model is sufficient for this kind of general use, but for navigational purposes precise and robust object detection is a critical parameter for the credibility of a survey technology. These two perspectives have been the focus for the test and analyses described below.
The main goal with this investigation for GST is to find an economical feasible methodology for closing the gap between multi-beam surveys and the coastline and learning when and where to use it.
Pilot sites for acquisition of bathymetric LiDAR data in Denmark
When choosing pilot sites for LiDAR surveys, different strategies can be used. Choosing the ideal environment enables the opportunity to see different strategies can be used. Choosing the ideal environment enables the opportunity to see the full potential of the technology but may not reveal its limitations. Choosing a too rough environment may only show limitations.
For the Danish tests, the goal was to find representative areas that would demonstrate bathymetric LiDAR’s potential and limitations. In short, GST wanted to test the bathymetric LiDAR systems un- der realistic circumstances in a realistic environment. The areas that were selected are all representative of Danish waters in order to ensure the results and findings can be used for making the right decisions on when and where to use bathymetric LiDAR, and when and where not to.
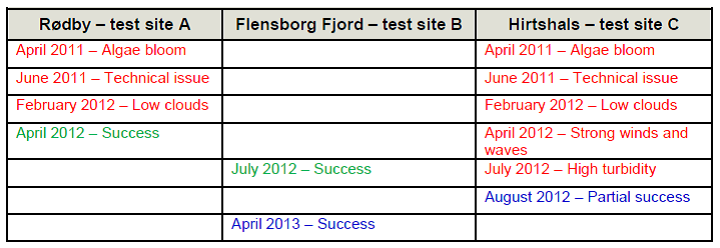
The project was planned to survey 2 test sites – Rødby and Hirtshals – but due to many delays in the survey and the problematic environmental conditions of Hirtshals, it was decided to extend the number of test sites to also include Flensborg Fjord on both the Danish and German sides. This corresponded very well with 2012 multi-beam production, when GST and BSH together surveyed the whole of Flensborg Fjord to the 6 meter depth contour.
Rødby (test site A): Typical Danish low land inshore area with dykes and a mix of coastal protection and small natural beach areas. The sedimentation transport is limited. The sea bottom is primarily sand covered with marine vegetation. The inland consists of both cultivated areas and flooding areas.
Flensborg Fjord (test site B): Well protected Danish and German inshore area with natural protection and small natural beach areas. The sedimentation transport is limited. The sea bottom is primarily sand and clay covered with marine vegetation. The inland consists primarily of cultivated areas.
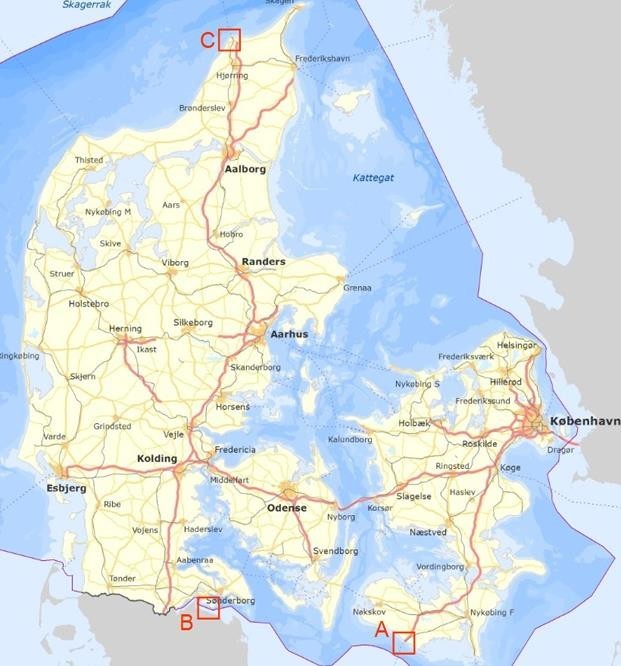
Hirtshals (test site C): Dynamic sand area with a lot of sedimentation transports both of sea and on land. The area is exposed to strong westerly winds and sometimes big waves and comprises a flat, wide sand beach with inland vegetation covered dunes. The sea bottom is primarily sand with limited marine vegetation.
Process for data acquisition
According to both experiences from the GST surveyors and environmental managers at the Danish Nature Agency, the best visibility in general in the inshore Danish waters occurs from February to April before the marine vegetation blooms. How- ever, planning a Bathymetric LiDAR data collection task and then executing one are two different things. As shown in table 1 both technical and local environmental issues were a challenge and caused several delays.
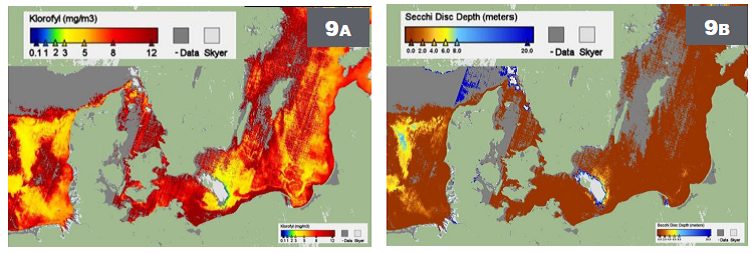
The environmental challenges were by far the greatest. GST experienced an unexpected Chatonella algae bloom, low hanging clouds, strong winds and waves and high turbidity that all made acceptable data acquisition impossible. Using satellite information on chlorophyll concentration (http://marcoast.dmi.dk) gives valuable information when not to survey since it is almost directly correlated to the turbidity in the water – as illustrated in figure 9A & 9B when the first Danish survey was postponed in April 2011.
In deciding when to survey, it is necessary to have both up-to-date and local knowledge of the environment. Using knowledge and observations from GST surveyors and harbor masters in the areas and even local divers from the Danish Emergency Management Agency all added valuable insight to the decision making process. But most important were the actual Secchi depth measurements in the survey area – at least in the Danish waters due to significant local variations.
When GST initiated contact to potential subcontractors in early 2010, only one supplier was interested in surveying minor test areas in Northern Europe. Few bathymetric LiDAR surveys in the region meant that new surveys required due to delays by either the local environment or technical problems, could not be rescheduled right away but had to wait until a logistical and an economically feasible opportunity appeared. Today, new systems have been launched and more subcontractors express interest in supplying bathymetric LiDAR services. Both the lack of system robustness and relative market immaturity seem to be less of an obstacle now in Northern Europe.
The data collected and the first findings
Two different subcontractors managed to survey all the three pilot sites using either Hawkeye II or Chiroptera. (See www.airbornehydro.com for further specifications). Part of Flensborg Fjord has been surveyed with both systems (Table 2). The most significant specification for the systems was the expected penetration depth, which for Hawkeye II is around 2½ times the Secchi depth and Chiroptera is around 1-1½ times the Secchi depth. Chiroptera compensates to the lack of penetration with much higher point density collected. In this section of the article, Hawkeye II is referred to as “Deep scan” LiDAR while Chiroptera is referred to as “High density” LiDAR.
The surveys in Rødby and Flensborg Fjord were successful even though the expected surveyed depths did not always correspond to the measured Secchi depth. This is primarily due to great local variations of turbidity. The measured Secchi depth may in general be representative for the area, but local strong current can have a negative influence on visibility.
By combining existing multi-beam data and topographic data with bathymetric LiDAR data, it has been possible to “close the gap” along the coastline and to establish a coherent elevation model for Flensborg Fjord – Figure 10 .
On the other hand, Hirtshals on Denmark’s west coast proved to be “just too rough” an environment for LiDAR bathymetry. Only the protected area northeast of the harbor produced a useful data set after a sixth attempt.
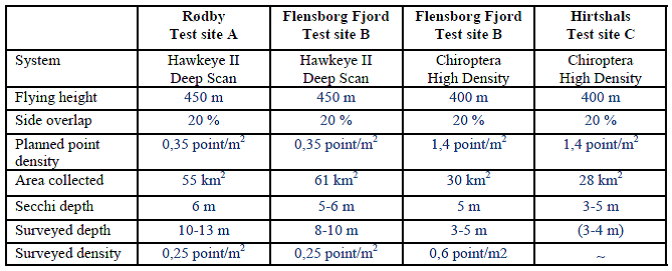
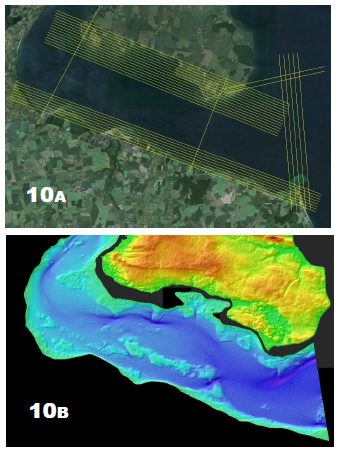
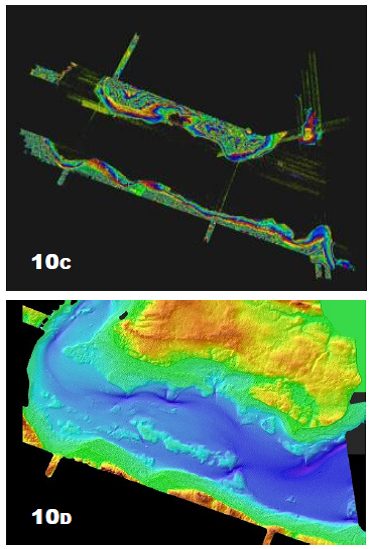
Figure 10: Closing the Gap in Flensborg Fjord : A)Planned survey, B) the Gap, C) Collected data, D)Coherent model.
Data analysis and evaluation – accuracy and precision
Accuracy tests have shown that the data without ground control points are well within 10 cm with an RMS of 30-40 cm compared to multi-beam data. The tests were done on a 0.5 km2 area at the Rødby location, which has a mainly sandy bottom. This result is well within what is deemed usable. The challenge is that we have a multi-beam sur- face at the deeper areas of the survey, but no sub- merged control points. Based on the comparison between the multi-beam data and the Bathymetric LiDAR data and tests of the associated topographic LiDAR data set against very well defined points on land, which revealed an accuracy of 8 cm with an RMS of 10 cm, we choose to conclude that the general horizontal and vertical accuracy is within the usable range.
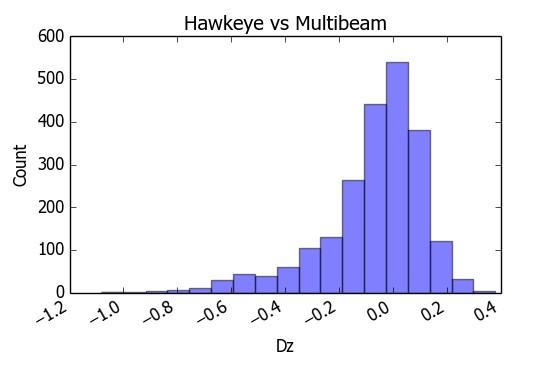
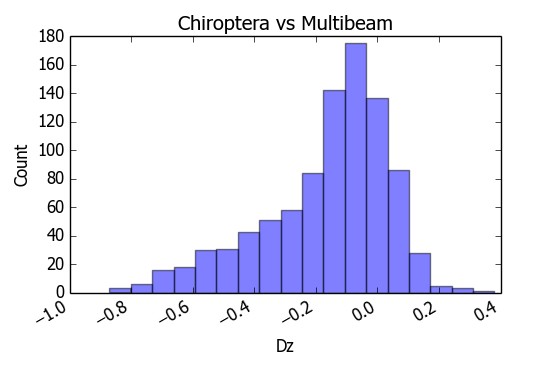
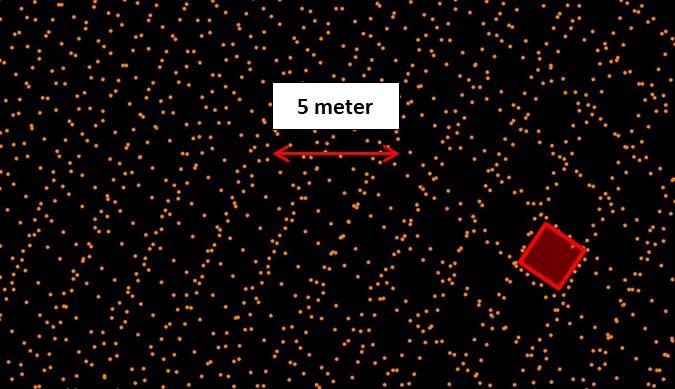
Looking at precision (i.e. inner accuracy), another test was performed at the Flensborg fjord location. In this test, the surveyed bathymetric LiDAR data sets were tested against a multi-beam reference data set. The test was done in the shallow end of the multi-beam data set at 4-6 meters depth covering a 0.2 km2 area with sandy bottom and more than 150 rocks.
First we look at the Hawkeye / “Deep scan” data. The table in figure 11 shows a standard deviation of 19 cm, which is reasonable for the area being mapped. But in the histogram, there is a slight asymmetry in the bell curve. An investigation into this asymmetry seems to correlate this finding with the fact that the rocks observed in the multi-beam data are almost completely missing in the LiDAR data. Although the rocks should have been mapped and should be represented in the point cloud through the footprints covering the seabed, they are missing. This can to a certain extent be explained by the fact that the data from the Hawkeye system have a lower point density and produce less coverage of the seafloor.
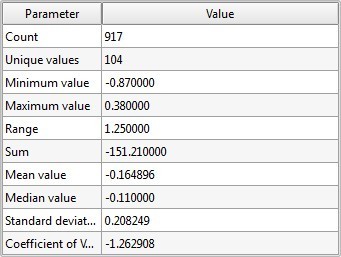
Second we look at the Chiroptera / “High density” data – figure 12. Again, we see a reasonable 20 cm standard deviation, but the histogram reveals again an asymmetry that indicates the rocks are missing in the data set. A further investigation has revealed this to be the case. However, the point density and resolution in this data set should be good enough to map individual rocks. Issues with depth and turbidity appear to be the cause because, although the Chiroptera has a high point density, it deteriorates rapidly in these waters. The result is low point density at 5 m depth, and an inability to detect rocks that are two meters in size.
Data analysis and evaluation – density and distribution
When working with discrete measurements, as LiDAR provides, density and uniformity of distribution go hand in hand. A data set can have an adequate point density, but if the uniformity of distribution is poor, it can result in some areas with lots of points and others with no points at all. This is an issue that will always have to be evaluated, no matter what use the LiDAR data is intended for. In some cases, uniformity is of less importance. For example, surfaces of smooth undulation are less inflicted by poor distribution, as they can easily be modeled with simple algorithms. Areas with erratic surfaces can be hard to model; in these cases, having poor distribution can be very problematic.
In the specific case of seafloor mapping, these two situations come into play. When mapping movement of sediment, the distribution is of less importance. Sand deposits in semi-predictable ways and can easily be modeled. In contrast, when mapping navigational routes, the general seafloor is of great interest and, in particular, the presence of rocks and other obstacles that can damage passing vessels. In locating rocks and obstacles, point distribution is of very high importance. It is not sufficient to locate most of the rocks; when mapping for navigation, it is critical that all rocks of a certain size are identified.
The two test data sets for Flensborg Fjord include one “Deep scan” data set and one “High density” data set. Because the ability to scan deeper pro- vides lower point density, the deep scan data are of less interest. The density of this data set is simply too low to locate rocks that are two meters in size (IHO S-44, order 1). At its best, the data- set’s point density is around 1 point per 2×2 meter (0,25 point/m2).
In the “High density” data set, the point density is 2.6 points per square meter in areas where overlap between fight lines exists. This should be adequate for identifying rocks, depending on the size of the actual footprint of the returning signal. The point distribution (fig. 13) shows an uneven distribution that can affect the number of rock returns. If the footprint and the following data extraction are insufficient, the number of points might not be adequate for a robust classification of an object.
A comparison has been conducted, where a number of rocks in the area that have been clearly located with multi-beam were sought in the “deep- scan” and “high-density” data. The area evaluated extends from the coast to deeper water and the rocks are 3.4 meters deep on average. This depth is well within the working area of both scanners. However, as seen in table 3, the density is quite low below 3 meters, and this is most likely due to local turbidity. The density is, in fact, so low that even object detection of larger rocks cannot be guaranteed.
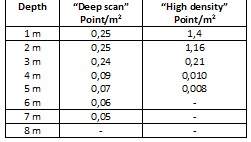
Even with the “high-density” scanner at this depth, the point density is reduced to 0.2 points per square meter, which is more or less the same as the “deep-scan” data set.
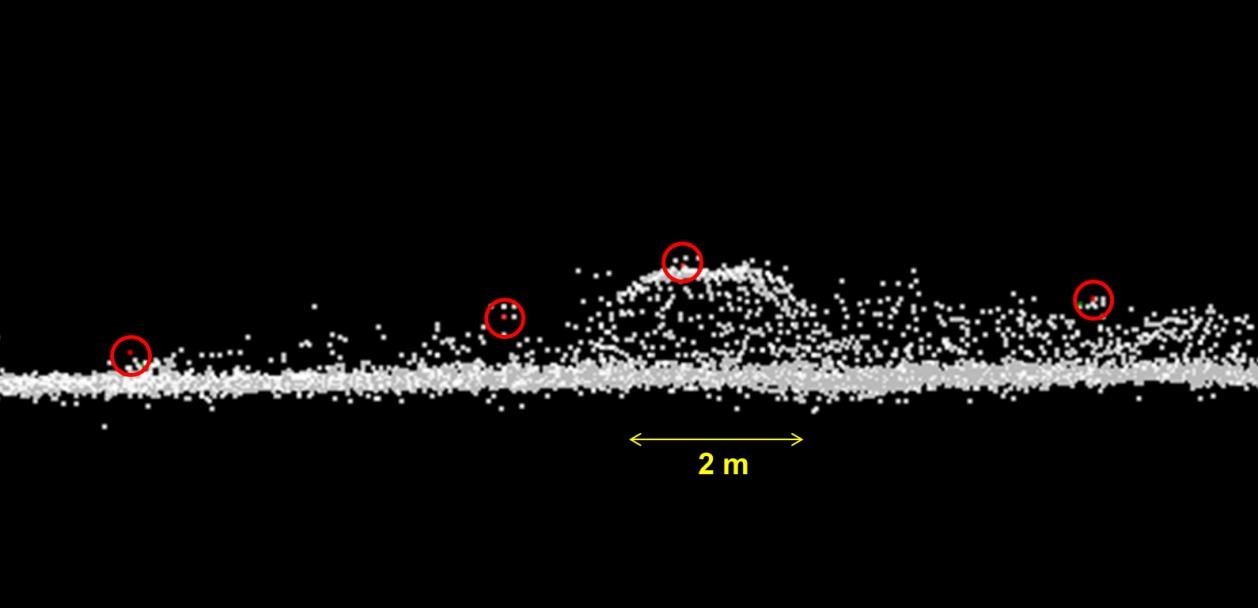
There remains a question as to how many observations with bathymetric LiDAR are needed to ensure positive object detection. The challenge is often sparse distribution in the data set. As figure 14 illustrates, a representative observation may identify a rock in the bathymetric LiDAR data set, whereas multi-beam returns a far more detailed image of the sea floor. If only one or two observations occur, there is no guarantee that they will be classified as an object rather than as outliers.
Full Waveform and the steps ahead
It has become increasingly evident that, in order to fully utilize the power of bathymetric LiDAR for object recognition, the waveforms returning from the sea column must be investigated more closely. It is clear that some objects return no discrete points, but it is unclear whether this is because no signal is received or because a returning waveform has been misinterpreted. Since the density in the point cloud is so sparse, it is crucial to use all the available information and extracting information from the waveform. Using the full waveform can also help in understanding how the footprint is represented in the discrete points derived from the returning waveform.
GST has not yet begun this waveform analysis and evaluation, but it will be the agency’s next step in the process. One of the most significant challenges is a lack of standardized formats for waveforms and tools to analyze them.
Evaluation of the Danish test
Thus far, preliminary results show that bathymetric LiDAR has potential in the shallow waters around Denmark. Both the horizontal and the vertical accuracy appear to fit well within the needs for a model of the seabed that can be used for a variety of purposes, not least for coastal zone management. However, the technique appears to have more limited value in object detection for nautical charting.
Two issues remain to be addressed in this context. First, there is a need for better, standardized tools for working with and analyzing the full waveform in evaluation of bathymetric LiDAR data. This is expected to yield a more comprehensive understanding of the data themselves and to ensure that all available information are displayed and analyzed when working with a sparse data set. Second, data managers must become reaccustomed to work with data sets that are substandard in their density compared to multi-beam. Through a change in mindset, data managers can relearn how to extract vital data from a sparse data set.
The environment appears to be the biggest constraint when surveying with bathymetric LiDAR in Danish waters. Local information is vital, and a high degree of operational flexibility in the surveying campaign is needed. Local divers from the Emergency Management Agency in Hirtshals provided critical local information on wind direction, where three days of dominantly southeasterly winds could render visibilities of ten meters or more. Unfortunately, these conditions did not occur at any time during the Danish test when both plane and equipment were available. The easiest means of handling challenging areas appears to be having an adequately large area to survey over a sufficient time interval, thereby giving the possibility to move the survey according to local conditions.
When the above challenges have been overcome, bathymetric LiDAR has the potential to be a relevant supplement to the traditional ship-based surveys in charting the shallow waters in Denmark and thereby closing the gap to the coastline.
Swedish experiences of Laser Bathymetry
Laser bathymetry surveys in Swedish waters, 1996-2002
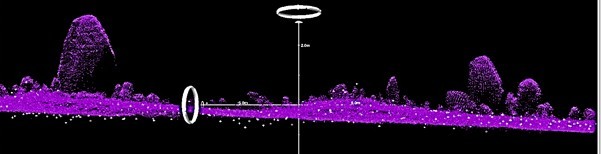
In the early 1970s, the Swedish Defence Research Institute (FOI) started to develop a laser system for submarine purposes. Subcontractors including SAAB in Sweden, Feary in Australia and Optech in Canada were contracted to build the first test system called FLASH, which was tested in 1989-92. The positive results from the tests with the FLASH system led to further technical improvements and a new system, Hawk Eye, was developed by SAAB. Two Hawk Eye systems (200 Hz) were delivered to the Swedish Maritime Administration (SMA) and the Swedish Navy in 1993 and were fully operational in 1996. (Figure 15)
Between 1996 and 2002, SMA carried out laser bathymetry surveys along the Swedish coast for nautical charting purposes. 36 separate areas of about 2150 km2 were surveyed in the Swedish archipelago and near the coast. Water clarity varies greatly in the Baltic Sea and on Sweden’s east coast, depths of between 1 to about 20 meters were achieved. On the west coast, where the waters are clearer, depths down to about 30 meters were recorded.
The minimum depth of 0.7 meters recorded by the system, paired with the restrictions of the surf zone, limited the minimum collected depth to about 1,0 meter. The low transmit rate of 200 Hz resulted in a low sounding density of about 5 soundings per 5 m2 at best, and only fulfilled S44 Order 2 in object detection. Even though a single sounding may have depicted an object, it was very difficult to verify whether an object had been detected or whether the data point was an outlier.
In these early days of using a new survey system for nautical charting, there was also some cartographical resistance to trusting this new LiDAR method. Therefore, any existing depths/contours shallower than the Hawk Eye system identified were kept in the chart. (Figure 16)
Recent LiDAR Bathymetry projects in Sweden
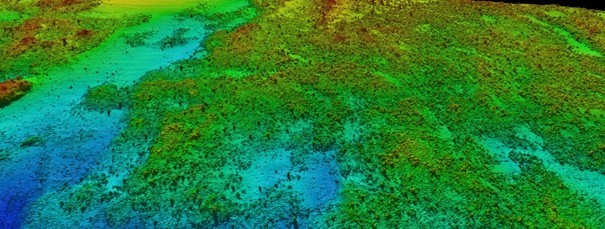
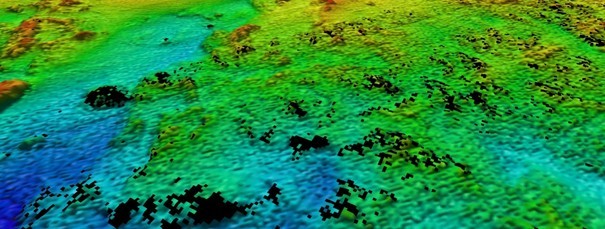
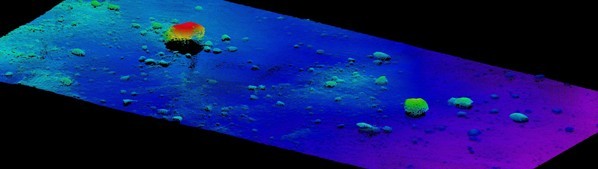
The results of two recent LiDAR projects, the research program EMMA (Environmental Mapping and Monitoring with Airborne laser and digital images on land and at sea, 2010-2013) and an ongoing mapping project of near-shore erosion around the south coast of Sweden (2013-2014), have been compared to SMA’s high density multi-beam survey data from 2013. A survey area outside the port of Ahus in southern Sweden containing both Hawk Eye II and Chiroptera survey has also been surveyed by multi-beam. The Hawk Eye II reached a maximum depth of about 13 meters and Chiroptera about 4-6 meters. Unfortunately, the Chiroptera survey did not reach very deep, and thus the area overlapping with the multi-beam survey was very small. (Figure 17)
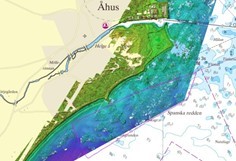
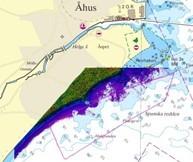
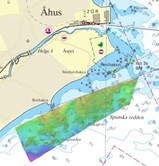
Figure 17: 17A – 17B – 17C Comparison of three surveys covering the same area outside the port of Ahus.
The dense multi-beam survey contained numerous of rocks and boulders. The Hawk Eye II survey showed, in general, the same sea floor except for the absence of features and rocks. There were also several data gaps in the Hawk Eye II and Chiroptera surveys. The general depths of all the three surveys were reasonably consistent. (Figures 18 to 20)
In general neither Hawk Eye II nor Chiroptera detected any rocks of about 1 to 5 meters in size. However, it should be noted that the wave forms in the LiDAR surveys were not analysed. To be able to use LiDAR surveys not just for general depth but also for nautical charting, it is essential to acquire the skills and experience to analyse LiDAR data as well as the waveforms in the raw data.
Study project ”Surveying the Swedish coastal zone”
The project is funded by a grant from the Swedish Civil Contingencies Agency (MSB). The cooperation partners are the Swedish Maritime Administration, the Geological Survey of Sweden (SGU), the Swedish Land Survey and the Swedish Geotechnical Institute.
The project aim is to conduct a methodological study to find cost-effective tools for measuring the shallow waters of the coastal zone as well as lakes and rivers. In the project, ”shallow water” refers to the shoreline down to an approximate depth of 10 meters.
In this area, there is a substantial need for high-resolution data in order to create reliable flood and dispersion models, detect and calculate erosion damage, and conduct analyses of climate impacts on the sea level. A prerequisite for this is a coherent terrain model for the coastal zone and other waterways. A modern high-resolution elevation data from the national elevation database can be used for a terrain model on land, but this ends at the shoreline. Today there are very few high-resolution data for these shallow waters, largely because traditional measurement methods are very costly in shallow areas.
New developments have enhanced the technology and may enable a more cost-effective measurement of depths in shallow waters, including various types of airborne LiDAR systems, interferometric sonar, etc. An analysis of the different measurement methods and their effectiveness in shallow water areas will be performed as part of this study. Measurement efficiency, particularly of LiDAR technology but also of acoustic methods, in large part depends on the water’s physical characteristics (quality). These factors will be included in the project’s analysis section in order to identify how planning can be done and which method can provide the best quality, time and cost (efficiency). The project will run for two years, where the first year is devoted to technical test activities and inventory of experiences from a variety of LIDAR measurements. The second year is devoted to analysis and to create a general planning.
As test operations with airborne technology are very costly, the study will primarily investigate and analyse the results from previous surveys with LiDAR systems in Sweden and internationally. The experiences will be analysed with reference to the specific conditions in the Swedish waters.
Tests with sonar technology will be performed using existing systems aboard SGU vessel “Ugglan” and SMA vessel “Petter Gedda”, and possibly also using other equipment on the market. Tests will also be conducted in the shallowest ar- eas from an even smaller vessel equipped with a small mobile multi-beam sonar.
Locations for testing equipment and methods will be selected from different types of shallow areas along the Swedish coast in order to determine whether survey methods and equipment show different results in different areas.
Since Swedish Maritime Administration hydrographic surveys are normally concentrated on fairway areas, as funds for surveying only come from the fairway dues, the results of the study method will form the basis for a discussion on the needs and funding for establishing a national coastal zone mapping program.
The depth database can, when supplemented with shallow survey data, be used together with the national elevation database to create a seamless digital terrain model over the Swedish land and water areas. The project started in January 2014 and will end in December 2015.
Summary from the all the bathymetric LiDAR projects
LiDAR and data processing technologies have been under continued development in recent years, and LiDAR bathymetry is beginning to appear to be an operational method for surveying the waters of the Baltic Sea.
Some preliminary conclusions can be drawn from a number of test activities in the region, and final results are expected to be collated in reports in mid -2015. Among the preliminary conclusions is a finding that LiDAR can become an interesting and valuable survey method for shallow waters. This is especially due to the fact that traditional methods of hydrographic surveying have disadvantages in shallow areas: single-beam data have too large gaps between the survey lines, while multi-beam surveys in shallow areas require too many survey lines and therefore prove too expensive. Laser bathymetry is suitable for large areas where access by launch or ship is difficult due to weather conditions or low keel clearance. A large area can be surveyed with LiDAR in a short time, but when post processing is taken into account, the final data delivery can take time. Long flight lines are necessary for operational effectiveness, but difficult in complex archipelago considering the net efficiency.
LiDAR surveys are an alternative method, especially in shallow areas, where surveys are needed not only for navigation purposes, but also for coastal zone management. The method does not yet provide an alternative to traditional hydrographic surveys, but can be complementary. In these shallow areas, LiDAR surveys can provide a combination of land and sea data in one datum and in almost the same quality.
In recent years, bathymetric LiDAR surveys have been acquired by organisations other than Hydrographic Offices; co-operation between the different organisations is necessary when considering the operational use of LiDAR bathymetry. For strategic purposes, it is necessary to establish a wider scope of the possible use and users of these data – including but not limited to safety at sea, nautical charting and coastal protection – in order to identify a common data capture that can provide data for several purposes. This is in line with the theme for World Hydrography Day 2014: “Hydrography – much more than nautical charting”.
References
Banic, J., Sizgoric, S. and O’Neil, R. (1987). “Scanning lidar bathymeter for water depth measurement”, Geocarto International, 2:2, pp. 49-56.
Niemeyer, J. and Soergel, U. (2013), “Opportunities of airborne laser bathymetry for the monitoring of the sea bed on the Baltic Sea coast”, International Archives of the Photogrammetry, Remote Sensing and Spatial Information Sciences, Volume XL-7/W2, 2013 ISPRS2013-SSG, 11 – 17 November 2013, Antalya, Turkey.
Niemeyer, J., Kogut, T. and Heipke, C. (2014). “Airborne Laser Bathymetry for Monitoring the Ger- man Baltic Sea Coast”, Gemeinsame Tagung 2014 der DGfK, der DGPF, der GfGI und des GiN (DGPF Tagungsband 23 / 2014).
Pastol, Y. (2011). Use of Airborne LIDAR Bathymetry for Coastal Hydrographic Surveying: The French Experience. Journal of Coastal Research: Special Issue 62: pp. 6 – 18.
Juhani Laaksonen & Seppo Mäkinen. Report on Laser Bathymetry Performed in Finland, November 1999, Finnish Maritime Administration Hydrographic Surveys Division, 26 April 2000. Unpublished.
Biographies
Wilfried Ellmer. Dr.-Ing. Wilfried Ellmer studied geodesy in Bonn and Munich (University of the Federal Armed Forces). After a short period at the German Geodetic Research Institute he has worked since 1990 at the Bundesamt für Seeschifffahrt und Hydrographie, Rostock (Germany). He is deputy head of Hydrographic Surveying and is responsible for the development of procedures and equipment.
Rune Carbuhn Andersen, M.Sc. and MBA, has been working at the Danish National Geodata Agency since 1999. In this time he has moved from topographic data collection to hydrographic production and among other things has been involved in Topographic and Bathymetric LiDAR, data quality and new production system for charting in Greenland, primarily as project manager. He is now acting as senior executive
advisor. rca@gst.dk
Andrew Flatman has a M.Sc. in land surveying and remote sensing from Aalborg University and has been working with LiDAR since 1998 on different projects spanning small high precision projects to the design and production of the Danish National elevation model of 2007. Andrew has worked for different remote sensing companies including Blom and Fugro and since 2010 been part of the Danish National Geodata Agency.
Jyrki Mononen has been working at the Finnish Hydrographic Office since 2006. He has been involved in acquiring hydrographic surveys, chart datum definitions and being responsible for the Finnish HO’s quality management system. Since 2013 he has been acting as the chairman of the BSHC CDWG. He has a MSc in land surveying from the Technical University of Helsinki in 1995.
Ulf Olsson has a Master’s degree in Hydrographic Science from the University of Southern Mississippi, 2003, and has a FIG/IHO category A certification. He also has a Master Mariner and Nautical Science education at Malmoe Merchant Marine Academy 1982. He has served as Hydrographic Quality Manager and Senior Surveyor 2003-2011 and from 2011, he is the Head of Hydrographic Field Survey at the Hydrographic office at the Swedish Maritime Administration.
Hans Öiås has studied a Higher Course in Computer science specializing in Logistics and Production Management as well as some courses in structured programming and GIS at the Linköping University. He has worked for the SMA since 1986 as a survey systems engineer and hydrographic surveyor. He has experience in system development, system integration as well as procurements of both survey systems and hydrographic surveys. He was appointed as Project Manager for the development of the Baltic Sea Bathymetric Database within the MonaLisa Project.