


Abstract
1. Introduction
The Graham Bank is an underwater group of volcanoes in the Strait of Sicily and one of the most interesting areas in the Mediterranean Sea from a safety of navigation and studies in geodynamics. In 1831, seismic and volcanic phenomena in the Graham Bank resulted in the emergence of the seamount and the appearance of an ephemeral island which disappeared a few months later due to wave erosion. Since then, depths in the area have undergone continuous changes due to volcanic-tectonic phenomena, sedimentary processes and erosion. From the late 19th century, the Italian Hydrographic Institute (IIM) has monitored the area and has recorded high dynamicity in the bank and its depths. Recent hydrographic surveys measured the shallowest point of the volcanoes as 9 m in depth. This is a potential hazard for vessels. In order to improve navigation safety, a number of solutions have been outlined. These are based on accurate hydrographic surveys, monitoring the nature and morphology of the seabed and a study of the structural evolution of the bank.
2. The Graham Bank
The Graham Bank is located in the Strait of Sicily, halfway between the island of Pantelleria and Sicily, about 35 km off the South-Western Sicilian coast (Figure 1). The Strait of Sicily is the northernmost part of the African Continental Margin and one of the most interesting geodynamic areas in the Mediterranean Sea (Carminati and Doglioni 2005, Corti et al. 2006) with a NW-SE oriented compression and NE-SW oriented extension. Tectonic extension led to an intraplate rift system characterized by three tectonic faults and a number of underwater edifices, evidence of complex volcanic-tectonic phenomena (Civile et al. 2010). Some features reach up to less than 10 m below the surface, with plateaus and banks with evident structures both in the substratum and the sediments resulting from a number of erosion phases and subaerial exposition (Civile et al. 2015). This is the context by which the Graham Bank was formed and then developed. It is characterized by a shallow and very dynamic volcanic edifice which in time has undergone numerous changes and has risen above water. An intense volcanic activity from June to August 1831, resulted in the emergence of an ephemeral island, which in Italian was called Ferdinandea. The island was 60 m high and slightly less than 300 m wide, with a circumference of 1 km. It consisted of fine pyroclastic deposits, and was eroded in the space of few months by wave action (Falzone et al. 2009). Depths in the area where the island had grown above the surface have repeatedly changed as a result of volcanic-tectonic phenomena (Coltelli et al. 2012) and sedimentary processes and erosion, creating the shallows of the Graham Bank.

Depths are in meters.
3. Hydrographic monitoring
A hydrographic survey acquires detailed data on the morphology of the seabed to the extent required by the purpose of the survey itself. The outcome is a set of hydrographic data relevant to the area at the time of the survey. It is crucial that the collected data be reduced to a known and consolidated reference frame so that they can be compared to data collected in later surveys and to allow for a study of any depth changes between the surveys. Undertaking further successive surveys in the same area enables the monitoring of any changes and allows examination of the relevant causes. To enable a comparison of detected changes in the monitored area, surveys must meet certain requirements:
- Collected data must have, or be reduced to, the same horizontal and vertical datum. The horizontal datum is usually referenced to an ellipsoid with geocentric orientation according to a network of fixed positions at a specific time. In Italy, it is usually ETRS89 and relevant frames, or ITRS and relevant frames, oriented according to a network of positions in Europe (ETRF2000) or in the whole world (ITRF08). The vertical datum is usually referred to the mean low water springs (MLWS);
- Equipment used for the survey must be considered. The oldest tool used to measure depths, the lead line, provided accurate soundings and their spacing depended on the distance between samplings. Single-beam echo sounders (SBES) map the seafloor along the line covered by the transducer and depths are referred to positioning data, applying corrections relevant to heave, transducer draft, sound velocity and tidal effect; the gap between lines is not necessarily mapped – any features in that area remain undetected. Multi-beam echo sounders (MBES) allow for a full sea floor search in terms of object detection, to the extent permitted by sensor capabilities. Resolution between different surfaces in different surveys must always take into account sensor capabilities of the tradition- al equipment as well as in state-of-the-art equipment (e.g. airborne or satellite borne);
- Uncertainties1in survey results must be determined and recorded. The inherent quality of the collected data, the efficiency of the processing methods and relevant results (i.e. uncertainty surfaces2) are affected by errors which in turn affect the value of the data in terms of representativeness and comparability;
- Two different surveys must be compared in suitably predetermined positions; the software will perform point cloud data or DEM interpolations, increasing the uncertainty of the interpolated depth value. This must be considered when comparing two different surveys, especially if interpolation methods are different between the two datasets.
4. Monitoring the Graham Bank
Because of its changing characteristics, the Graham Bank has been the object of much scientific and strategic interest. Since the emergence of Ferdinandea, many scientists and researchers have organized oceanographic campaigns to study it. Due to the rapid shifting of the shoal and to ensure safe navigation, the Graham Bank has been monitored by the IIM since the late 19th century by undertaking several hydrographic surveys with the results updating the nautical documents and charts.
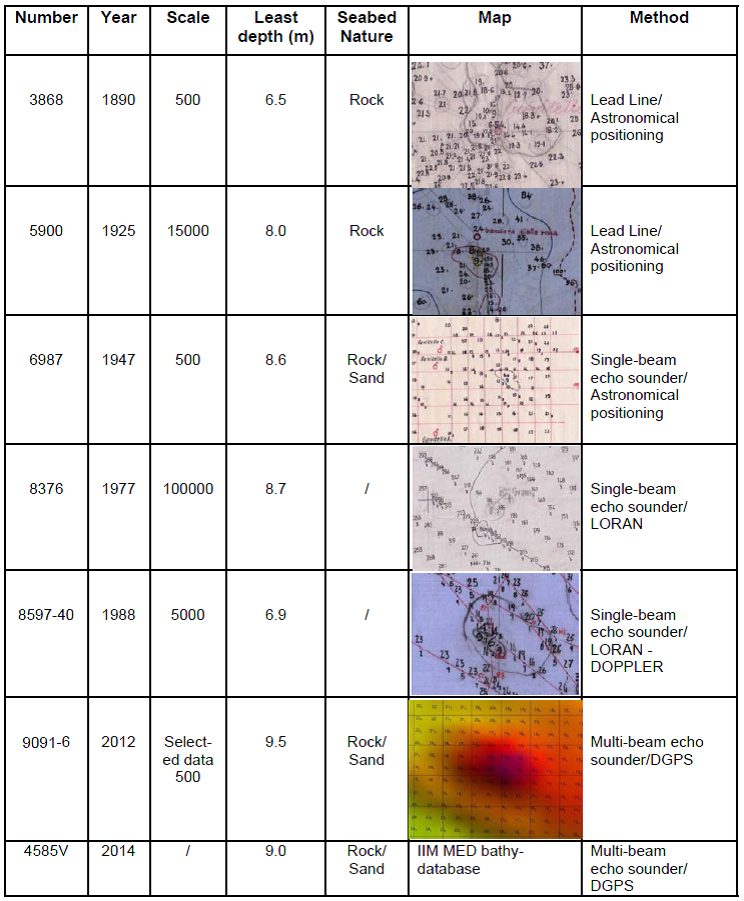
In 1883, bathymetric data indicated an underwater shoal with two basalt pinnacles with depths respectively to 2.7 m and 3.3 m. To reduce navigation risk, the pinnacles were blown up. The most important characteristics of the monitoring surveys from 1890 to 2014 are shown in Table 1. (see next page)
1890: Figure 2 shows the results of the survey carried out by IIM in 1890 using the lead line. The least depth of the seamount (6.5 m) was confirmed manually by divers. Hence it is considered that the bathymetric data uncertainties are in the same range as those resulting from modern surveys carried out with Multi-beam echo sounders (MBES).

1925: Figure 3 shows the results of the 1925 IIM survey, using the same equipment and procedures as in 1890.

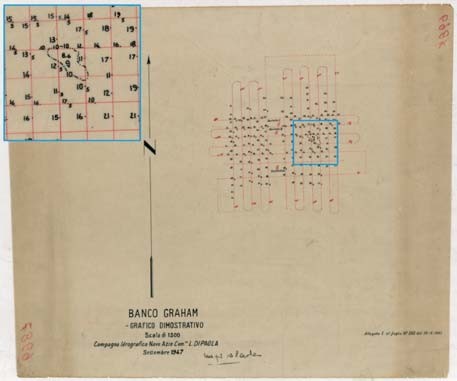
1947: For the 1947 survey, the IIM used a Single-beam echo sounder (SBES) for the first time to measure the Graham Bank. It was one of the first surveys carried out by the IIM using the new technology. Figure 4 shows the plotting sheet extracted from the archives of the IIM.
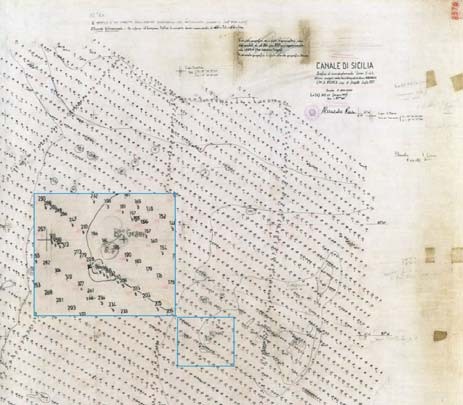
1977: Figure 5 shows the results of a Single-beam echo sounder (SBES) survey conducted at small scale (1:100,000) and integrated with a Lead Line over the Graham Bank
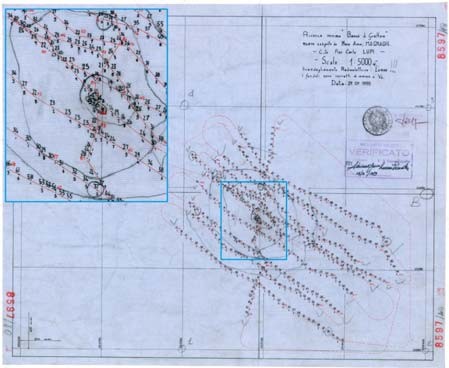
1988: The Graham Bank was re-surveyed using Single-beam echo sounder (SBES) 1988 survey was carried out using a Single-beam echo sounder (SBES) with the Loran system used for positioning (see Figure 6).
With the introduction of Multi-beam echo sounders (MBES), the IIM has used software to extract from the collected data, a cloud of soundings representing depth, including least depth and other significant features. Modern software can extract digital elevation models, usually represented as grids in which nodes, in addition to soundings, can be associated to uncertainties. Thus, accurate quality assurance as per consolidated hydrographic standards can be achieved, and surfaces can be used to compare data from different surveys in the same area.
The bathymetric data (summarized in Table 1 and shown in Figures 2 to 6) from the IIM database were collected and validated according to the IHO hydrographic survey standards published at the time. It is clear that in 125 years of monitoring, the Graham Bank has sunk deeper and deeper – from 6.5 m in 1890 to 8.5 m in 2005 and 9.0 m in 2014. According to IIM hydrographic survey No. 9091 (2012), the least depth was 9.5 m, while the “Campagna Banchi ISPRA-CNR” (2014) recorded a depth of 9.0 m, confirming the continuous shifting of the seabed.
We expect that new techniques and equipment will be used for future monitoring. The first step could be the set-up of fixed monitoring stations, for the constant measuring of those geophysics and geochemical parameters which best describe the dynamics of the area. A trial showed that useful information can be acquired this way on the volcanic activity in the area with results characterized by significant gas emissions and fumaroles (Coltelli et al. 2012).
Furthermore, we expect to exploit the potential of remote sensing, satellite derived bathymetry and airborne lidar bathymetry.
5. Seabed morphology
The most recent survey in the area carried out by the IIM in 2012 (IIM No 9091) used a Multi-beam echo sounder (MBES). This provides an accurate map of the seabed due to the digital model obtained from centimeter-accurate bathymetric data. Figure 7 (see next page) shows the Graham Bank as a NW-SE oriented volcanic edifice, approximately 150 m high. The flat seamount is characterized by two volcanic cones, one located NW and one SE.

The NW cone has a round-shaped 1.5 km diameter top, approximately 16 m deep, and a lower flat ring 40 m deep with similar morphology to other close shoals referring to recent sea level records (Civile et al. 2015, Lodolo and Ben-Avraham 2015). The SE cone has a 9 m deep oval-shaped top, the major axis of the ellipse being 700 m. The NW cone is characterized by gullies, several meters long, on the eastern side and a rough morphology on the western side from the deposits of an old lava flow.
The SE cone has two sub-flat structures, 25 m and 35 m in depth respectively, which have formed earlier than the central structure, resulting from the 1831 eruption activity, when the volcanic cone emerged and then sub- merged again. By processing acoustic backscatter data, the seabed was mapped (Ivaldi et al. 2015). It consists mainly of basalt, with a hard rock substratum in the central, shallower, structure. This structure is characterized by a rough morphology. Deeper down, it flattens out and the acoustic response is less intense due to mainly sandy ripples, detected through sampling of the floor and videos obtained with a ROV (Coltelli et al. 2012).
6. Bathymetric database
Every dataset from surveys in the Graham Bank has been processed and recorded by the IIM. For the monitoring to be efficient, data collected through different surveys in the same area must be standardized and comparable. This can be achieved by means of a dedicated information system in which data are stored: a database of positioned data in space and time.
Database users need to access data organized according to specific purposes, which can be obtained through queries. There is a substantial and conceptual difference between data and information. Data are entities representing the reality, whereas information is processed and structured data that allow us to understand reality. Without data, no information is available and raw data is not useful. In order to be useful, data needs to be processed and structured/managed in such a way as to allow use in more than one sector and for more than one purpose, i.e. providing information limited to a specific context or a specific time. That’s why correctly structured data allows for the extraction of information on the inherent quality of the data only, and provides no information on the way they are structured/managed (Atzeni et al. 2006, Singh 2011).
In the case of the Graham Bank, data were input into the bathymetric database following two procedures. The first procedure relates the capture of approximately 9,000 manuscript hydrographic survey plotting sheets. This procedure is lengthy, is still being used at the IIM and involves:
- Using a flat, high quality scanner, plotting sheets are scanned at a suitable resolution to preserve all useful details. To minimize distortion, attention must be paid to scanning procedures;
- The resultant digital raster file must be referenced to a reference frame by selecting a number of known positions in the plotting sheet. Positions correspond to the raster matrix image and geographic coordinates. If the reference frame of the known positions in the sheet are different from the reference frame in the database, the datum must be changed accordingly using suitable software and geodetic procedures to minimize datum and scale errors;
- The georeferenced raster image is vectorized to create soundings in the database’s horizontal and vertical datum.
The second procedure concerns surveys carried out after the introduction of digital collection methods. For SBES surveys, all available soundings are usually recorded, with no selection of the single survey lines. Particular attention must be paid to positioning, draft, sound velocity, tide corrections and average measured errors. For MBES surveys the approach is the opposite. Since there are a large number of soundings, a selection is possible and the inherent quality of the data can be improved through the creation of digital elevation models to be input into the database.
The resolution characteristics and node depth determination algorithms of digital elevation models can change and improve thanks to improved hydrographic software used for the processing, database management and storage capabilities. Therefore, data regularly undergo maintenance, and are kept in line with the new potential of hydrographic software and databases. Uncertainty layers are input directly into the model thus shifting data quality assurance from collection to survey results. Databases are thus improved, and streamline the whole procedure, from data collection to data management.
The resulting uncertainty surfaces – in particular after integrating into hydrographic software algorithms like CUBE (Combined Uncertainty and Bathymetry Estimator) – take into account sounding uncertainties in assessing depths and give an estimate of node uncertainty.
Hydrographic surveys are input into the bathymetric database as digital elevation models or as point cloud data, complete with metadata, which are regularly revised in order to standardize, complete and update the data stored in the various fields.
7. Safety of navigation and danger marks
The Graham Bank least depth affects safety of navigation and should be adequately marked. Sea regulations have often been a controversial issue, especially when the countries involved have different agendas. However, when rules and standards involve the safety of navigation, even conflicting nations usually find an agreement. In order to facilitate negotiations, a number of international organizations were created to ensure safety at sea. One of them is the International Association of Marine Aids to Navigation and Lighthouse Authorities (IALA), whose aim is “to foster the safe, economic and efficient movement of vessels, through improvement and harmonization of aids to navigation worldwide and other appropriate means, for the benefit of the maritime community and the protection of the environment” (IALA constitution, Art. 2. Aim, http://www.iala-aism.org/about/constitution.html). IALA operates within the boundaries set forth by the definition of marine aid to navigation, i.e. “a device, system or service, external to vessels, designed and operated to enhance safe and efficient navigation of individual vessels and/or vessel traffic” (IALA constitution, Art. 1. Name). The key word here is external, referring to the area around the vessel. IALA and other organizations, such as the International Hydrographic Organization (IHO) and the International Maritime Organization (IMO), issue guidelines to ensure safety of navigation. Such guidelines are applied by most countries throughout the world.
Most countries manage the marking of hazards in their national waters through a specially appointed government institution, in total or partial compliance with the IALA guidelines http://www.iala-aism.org/products/publications/category.html). As shoals are largely inshore, they are usually managed by the competent countries through these specifically appointed institutions.
There are no specific institutions, however, responsible for the marking of hazards in international waters. International waters are in fact for the most part deep waters. The Graham Bank is a notable exception. Least depth has been for some time around 9 meters – a potential hazard for vessels navigating in the area with draughts close to that depth. The Graham Bank lies in international waters, for which no country is directly responsible.
For a similar hazard in Italian waters – Vada, IIM Paper Chart 7009 (Kit P2a, 2015) – an isolated danger mark was installed according to the IALA guidelines (Figure 8). Likewise, due to the proximity of hazards in Italian waters, a ships’ routeing system was implemented – IIM Nautical Paper Chart n. 922 (1992) (Figure 9).


Where hazards are mainly due to traffic and/or shallow waters, another strategy can be adopted to regulate navigation – traffic separation schemes. The IMO is a specialized agency of the United Nations and is the global standard-setting authority for the safety, security and environmental performance of international shipping. Its main role is to create a regulatory framework for the shipping industry that is fair and effective, universally adopted and universally implemented (IMO, http://www.imo.org/en/About/Pages/Default.aspx).
IMO sets guidelines for traffic separation schemes and ships’ routeing, which some countries adopt unilaterally or through agreements with other countries. The International Convention for the Safety of Life at Sea, SOLAS 1974/78, Chapter V, encourages agreements between governments for the adoption of ships’ routeing systems and states that the IMO “is the only international body for developing guidelines, criteria and regulations on an international level for ships’ routeing systems. Contracting Governments shall refer proposals for the adoption of ships’ routeing systems to the Organization. The Organization will collate and disseminate to Contracting Governments all relevant information with regard to any adopted ships’ routeing systems”.
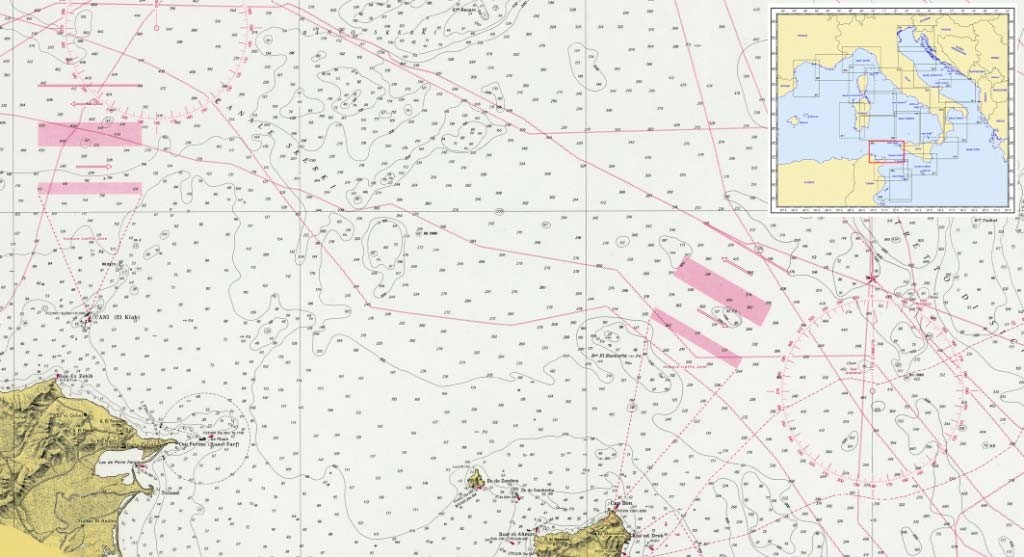
Navigation in the area of the Graham Bank could be regulated by a ships’ routeing system with clearly defined traffic lanes avoiding the shoal and adopting measures similar to those adopted for the Talbot Shoal and the Dog Seamount (Figure 10).
Both the solutions outlined can be adopted – a traffic separation scheme and a danger mark. Most E-W commercial routes in the Mediterranean Sea cross the Strait of Sicily and a 9 m shoal in the middle of it is a hazard for vessels navigating the area. This risk is even more serious if we consider the volcanic activity, evidenced by the frequent gas emissions. So far, prevention measures have focused mainly on keeping clear of the potentially dangerous area. In the Strait of Sicily, traffic is regulated by strict traffic lanes, particularly in the area between Bizerte and Ras el Melah, and vessels are kept well clear of the shallow waters near the Dog Seamount and the Talbot Shoal (Figure 10).
8. Conclusions
The Graham Bank is dynamic seabed region influenced by tectonic, volcanic and oceanographic phenomena and has been studied and monitored by a number of scientists and research centers. The Italian Navy has been surveying the area since the late 19th century. Data collected from the Navy hydrographers and survey vessels are combined with data from other research centers, which are processed and validated by the IIM according to international standards and then input into the IIM bathymetric database, to be used for the updating of nautical documents.
Regular surveying is essential to ensure safety of navigation in a potentially dangerous area, as well as to improve the hydrographic database and the knowledge of the sea. Depths in the Graham Bank are shallow and can change suddenly, as the Surtsey eruption (Iceland) in 1963 and the renewed volcanic activity in Hunga Tonga (South Pacific) in 2015 prove. Depths may change due to hydrodynamic action, volcanic, seismic and tectonic activity, as well as to the increased volume of interstitial gas and fluids from sudden changes in temperature. Therefore, greater attention should be paid to the Graham Bank and national and international organizations and scientific institutions should cooperate in order to monitor the dynamic seafloor processes and to limit the risks for vessels and improve safety in a very busy area of the Mediterranean Sea.
9. Acknowledgements
The authors would like to thank Mauro Pizzimenti, Marco Garbarino and Nunzio Moschetto for their precious support in archive research and digital restitution of historic bathymetric plotting sheets.
10. References
Atzeni, P., Ceri, S., Paraboschi, S. and Torlone, R. (2006). “Basi di dati – Modelli e linguaggi di interrogazione”, McGraw-Hill, pp. 512.
Carminati, E. and Doglioni, C. (2005). “Mediterranean Tectonics”, in: Encyclopedia of Geology, Elsevier, 135-146.
Civile, D., Lodolo, E., Accettella, D., Geletti, R., Ben-Avraham, Z., Deponte, M., Facchin, L., Ramella, R. and Romeo, R. (2010). “The Pantelleria graben (Sicily Channel, Central Mediterranean): An example of intraplate ‘passive’ rift”, Tectonophysics, 490, pp. 173–183.
Civile, D., Lodolo, E., Zecchin, M., Ben-Avraham, Z., Baradello, L., Accettella, D., Cova, A. and Caffau, M. (2015). “The lost Adventure Archipelago (Sicilian Channel, Mediterranean Sea): Morpho-bathymetry and Late Quaternary palaeogeographic evolution”, Global and Planetary Change, 125, pp. 36–47.
Coltelli, M., D’Anna, G., Cavallaro, D., Grassa, F., Mangano, G., Azzaro, R., D’Alessandro, A., Passafiume, G., Amato, A., Gurrieri, S., Patanè, D. and Gresta, S. (2012). “Ferdinandea 2012: the oceanographic cruise on the Graham Bank, Strait of Sicily”, Miscellanea INGV, 15, pp. 57-58.
Corti, G., Cuffaro, M., Doglioni, C., Innocenti, F. and Manetti, P. (2006). “Coexisting geodynamic processes in the Sicily Channel”, Geological Society of America, Special Paper, 409, pp. 83-96.
Falzone, G., Lanzafame, G. and Rossi, P. (2009). “L’isola che non c’è: il vulcano Ferdinandea nel Canale di Sicilia”, Geoitalia, 29, pp. 15-21.
IHO (2000). S-57 – Transfer Standard for Digital Hydrographic Data, Main Document.
IHO (2008). S-44 – Standards for Hydrographic Surveys.
IHO (2014). S-4 – Regulations for International (INT) Charts and Chart Specifications of the IHO.
IIM (1992). Carta nautica n. 922, Da Vieste a Porto S. Giorgio e Isola Lesina, 1:250,000.
IIM (1998). Carta nautica n. 948, Da Bizerte a Ras El Melah Trapani e Pantelleria, 1:250,000.
IIM (2015). Carta nautica n.1813, Stato dei rilievi nei mari italiani, 1:2,250,000.
IIM (2015). Carta nautica in Kit 7009 (P2a), Da Marina di Pisa a Vada, 1:100,000.
Ivaldi, R., Langellotto, N., Moschetto, N., Pizzeghello, N. and Garbarino, M. (2015). “Monitoraggio idrografico del Banco di Graham (Canale di Sicilia) e sicurezza della navigazione”, ASITA 2015, pp. 481-486.
Lodolo, E. and Ben-Avraham, Z. (2015). “A submerged monolith in the Sicilian Channel (central Mediterranean Sea): Evidence for Mesolithic human activity”, Journal of Archaeological Science: Reports, 3, pp. 398-407.
Shing, S.K. (2011). Database Systems Concepts, Design and Applications, Pearson Education, India, pp. 912.
11. Biographies
Captain Luigi Sinapi joined the Italian Navy in 1985. After completing studies at the Naval Academy in Livorno, he attended the Hydrographic Course IHO/FIG/ICA Category A Level (1992/1993) in Genoa. He has been conducting hydrographic surveys since 1993 and received IHO Category A Certification in 1996 at the Italian Hydrographic Institute. He has been the Commanding Officer of IT Navy HSV Mirto, Frigate Zeffiro and Destroyer Durand de la Penne and he worked at the Italian Hydrographic Institute as Head of Hydrographic Department and at the IT Navy Headquarters in the Financial Planning Department and Dept. Operations and General Planning. He earned the II level degree in Physics at the University of Lecce, the I level degree in Navigation and Maritime Science at the University of Pisa, the II level degree in International Diplomacy at the University of Trieste and the II level master in Marine Geomatics at the University of Genoa (IHO/FIG/ICA, Hydrography category A). He has taught hydrography and geodesy at the Parthenope University, Naples. He is currently the National Hydrographer at the Italian Hydrographic Institute.
Captain Lamberto Orlando Lamberti joined the Italian Navy in 1985. After studies at the Naval Academy in Livorno, he attended the Hydrographic Course IHO/FIG/ICA Category A Level in Genoa. He has been conducting hydrographic surveys since 1993, receiving the IHO Category A Certification in 1996 at the Italian Hydrographic Institute. He has spent much his career on board IT Navy Hydrographic Survey Vessels as a Hydrographic surveyor, Executive Office and Commanding Officer on board IT Navy HSV Magnaghi and Mirto. He led the Hydrographic Department of the Italian Hydrographic Institute for ten years and he worked at the IT Navy Headquarters as Head of the GEOMETOC Department. He is currently the Head of Surveys & Cartographic Department at the Italian Hydrographic Institute in Genova promoting surveys in Italy and abroad and the nautical documentation production of the Italian Chart/Publication Portfolio for safety of navigation purposes.
lambertoo.lamberti@marina.difesa.it
Lieutenant Commander Nicola Marco Pizzeghello joined the Italian Navy in 1997. After studies at the Naval Academy in Livorno, he earned a degree in Political Sciences focused on International Affairs at the University of Pisa and attended the Master in Marine Geomatics in Genoa. He has been conducting hydrographic surveys since 2005, receiving the IHO/FIG/ICA Category A Certification in 2007 at the Italian Hydrographic Institute. He was the Commanding Officer of the IT Navy HSV Galatea. He is currently the head of the Hydrographic Department at the Italian Hydrographic Institute.
nicolam.pizzeghello@marina.difesa.it
Roberta Ivaldi earned a PhD in Marine Environmental Science, (Trieste University, 1997) and a Master of Science degree in Geological Science (Genoa University, 1993). She has been Associate Professor in Marine Geology at the Italian Hydrographic Institute since 2008. She was appointed to the GEBCO SCUFN membership (2016). Since 1990 she has also participated in many oceanographic cruises in the Mediterranean Sea, in the Atlantic and around Antarctica. Her research focuses on seabed mapping, high-resolution seismic stratigraphy, geotechnical properties and microstructures of sediments.
roberta_ivaldi@marina.difesa.it
- The uncertainty of the value of a measurement is to be understood as the statistical assessment, with a specific level of confidence, of the true error in a measurement, i.e. the difference between the estimated value and the true value (which cannot be known). An assessment of the uncertainty must take into account random errors and residuals of measures with respect to estimated values after the elimination of systematic errors. In order to detect and correct systematic errors, accurate calibration, setting and control are required. By removing most systematic errors through accurate calibration, setting and control, the uncertainty becomes a realistic assessment of the true error.
- As stated in IHO S44, the uncertainty surface is one method of determining whether a survey area has met the specifications.