

Abstract
1. Introduction
The International Hydrographic Organization (IHO) was established to support safety of navigation and the protection of the marine environment. This involves the coordination of the activities of national hydrographic offices in the production of nautical charts and documents derived from hydrographic surveys and other information. The status of hydrographic surveying and nautical charting worldwide is promulgated in IHO Publication C-55 (IHO, 2016a). This document reveals that many of the world’s coastal waterways, including those of a number of developed States, the Caribbean, Indian Ocean and the Polar regions are still inadequately surveyed for contemporary needs, or not surveyed at all.
Recognising this situation, the chosen theme for World Hydrography Day 2016 was;
Hydrography – “the Key to well managed seas and waterways”
The following statement promoting this day is in many ways relevant to the proposition in this article.
“The theme for 2016 is intended to focus attention on the fundamental importance of hydrography
and our knowledge of the shape, nature and depth of the seafloor as a fundamental requirement for the proper, safe, sustainable and cost effective use of the world’s seas, oceans and waterways.”
(IHO, 2016b)
With few exceptions and by the end of the current decade, vessels engaged in international voyaging will be navigating with an Electronic Chart Display and Information System (ECDIS). However, in many areas now opening up to navigation, the key component of the system, the Electronic Navigation Chart (ENC), will not be fit for purpose as the ENC will not necessarily contain the required data content to ensure safe navigation. Fortunately, responsible owners who intend to operate ships in such waters now have the opportunity to remedy the situation by installing a Navigation and Obstacle Avoidance Sonar hereafter referred to as Navigation Sonar.
With the use of Navigation Sonar, the shape, nature and depth of the seafloor ahead of a vessel can be determined in real time – effectively it is a forward looking multi-beam echo sounder. Contemporary systems maintain an effective watch below the waterline similar to that of radar above water. The sonar image can serve as a check on charted bathymetry, thereby contributing an additional dimension to situation awareness. Navigation personnel are made aware of the true nature of the seabed ahead of the vessel. The timely detection of uncharted shoals, reefs and other hazards to navigation enables evasive action to be initiated to avoid groundings altogether or lessen their consequences. The data acquired may also have potential to provide an independent source of high-resolution full-swath bathymetry that can, once validated, make a significant contribution to crowd-sourced bathymetry.
A previous article in this journal (Russell, 2014a) reviewed a number of groundings on uncharted seabed features, some of which might have been averted or their consequences mitigated had the casualties been equipped with Navigational Sonar. This article describes further developments that may increase the potential for integrating data products obtained from Navigation Sonar with crowd-sourcing initiatives to improve navigation charts for all. An additional benefit may include the capability for real time detection of changes in the seabed that have occurred since the revision of the current chart.
2. Background
The first edition of the Admiralty Manual of Scientific Enquiry, published in 1849, included at Appendix No.1 an abstract from a “Return” to the House of Commons prepared under the Hydrographer Francis Beaufort in 1848. This was entitled Coasts and Islands of which our Hydrographic Knowledge is imperfect. Supplements to this initial account, provided by the Hydrographers of the day, dated 1858, 1871 and 1885 appeared in later editions of the manual. They record the heroic efforts of hydrographers of many nations to chart the arteries of ever expanding commerce with, it may be said, no little success. Among areas still suffering from a lack of modern survey coverage, were the western portion of the Pacific Ocean and the Seychelles Bank, two locations which saw fatal groundings in 2000 and 1970 respectively (Russell, ibid.).
The supplement of 1885 notes that the West Indies are probably as well charted as any part of the world. These optimistic assessments sadly only held good for the shipping needs at the time of writing. Witness the loss in the Windward Isles of a French cruise liner in 1971 (Russell, ibid.). In contrast, the charting of the Dutch Archipelago was adjudged to be still imperfect. Though many additions have been made, these have not been of a detailed character. This caveat still applies to some of Indonesia’s waters; where a bulk carrier, shown in Figure 1, grounded on an uncharted pinnacle in 2010 (Russell, ibid.).

By the time the fifth edition of the manual was published in 1886 the transition from sail to steam was effectively complete and the opening paragraph of the supplement has a familiar ring;
“Great as has been the advance in the publication of accurate charts of the globe made since the last revision of the Admiralty Manual in 1871, the needs of navigation have increased more rapidly”.
These new demands required significant allocation of hydrographic resources to re-survey coastal areas hitherto regarded as adequately charted. This was something which could only be achieved at the expense of surveys in less well frequented areas – a situation just as familiar today as the rationale for World Hydrography Day 2016 attests.
A telling example of this recurrent theme is the exponential increase in the tonnage and draughts of Large Crude Carriers towards the end of the 1960’s. Prior to 1960, the depth criterion for dangerous wrecks on Admiralty charts was 8 fathoms (14.6m). In that year this was increased to 10 fathoms (18m) and only 3 years later to 11 fathoms (20m). Since 1968 a wreck with less than 28m (15 fathoms) of water over it has been charted as dangerous.
The upward trend in vessel dimensions is continuing, patterns of trade are changing and cruise operators are offering more venture-some itineraries (Russell, ibid.) Together with the opening up of the Northwest Passage and Northern Sea Route these trends present an intolerable demand on the diminishing survey resources of national Hydrographic Agencies. The wider adoption of Navigation Sonar might contribute towards the alleviation of this pressing problem.
3. Developments in Sonar Technology
The use of sonar (SOund Navigation And Ranging) to detect underwater obstructions is not new. Its navigational purpose has been implicit from conception. Most of the early sound work was devoted to horizontal propagation and the detection of objects in the water. Development of transducers gained impetus following the Titanic disaster and the outbreak of World War I in order to detect submarines. In 1914 an oscillator invented by Reginald Fessenden installed in the USCG Cutter Miami, detected an iceberg over 20km away. A seabed return noted at the same time paved the way for rapid advances in sounding technology (Theberge, 1989). In 1922, French and American vessels equipped with the first echo sounders, obtained lines of soundings in the Atlantic and Mediterranean respectively.
The first bathymetric chart to be produced solely from acoustic soundings was published in 1923 (Dierssen and Theberge, 2014).
4. Historical perspective
The first echo sounders only obtained individual depths, as had lead lines and sounding machines. They did not perform satisfactorily in shallow water so that traditional methods were retained for boat sounding until the 1950’s and beyond this for some port applications. Once reliable paper recorders were perfected and continuous all weather electronic fixing became available a step change improvement in productivity was realised. Thought was directed to the possibility of scanning between the lines of soundings to detect wrecks and rock pinnacles which might otherwise have been missed (Morris, 1995). This resulted in Royal Naval survey ships, converted from anti-submarine frigates, making routine use of their World War II era scanning sonars to sweep ahead, along and across track. In 1961 fisherman’s sonars were retro-fitted to existing inshore survey craft and subsequently in new build ocean and coastal survey vessels. This was mainly used for wreck location and examination. In seeking to “broaden the furrow” of depth data provided by the single beam echo sounder hydrographers looked to other sonar applications. This was with a view not only to detect underwater obstructions; but to provide depth data between survey lines as well.
A sector scanning sonar, Hydrosearch, was introduced into the British Royal Naval Hydrographic Service in 1979. Its operating principles were those of the sonar developed in the 1950s at the UK’s Admiralty Research Laboratory for detection of ground mines. Hydrosearch fulfilled its purpose for wreck investigation but not for area sweeping or depth measurement. The acoustic operating concept was technically successful; but the limitations of contemporary deployment mechanisms and computer capacity meant that the system was ahead of its time. Multi beam echo sounding and sidescan sonar then superseded Hydrosearch, thus achieving total seabed insonification and depth measurement; but forfeiting the forward looking capability.
In the late 1990s the Petrel TSM 5424 3D sonar, with a claimed range of about 1000m, was developed by the Royal Australian Navy as a mine and obstacle avoidance system for littoral warfare and for optimised navigation in poorly charted waters. Regrettably, this system did not meet expectations and is no longer sup- ported in fleet units. However, it still fulfils a limited navigational function for inshore hydrographic survey vessels in the reef strewn waters of Northern Australia. The system supposedly had a depth data logging capability; but this was not realised satisfactorily. Consequently it was only ever used for obstruction detection and avoidance.
5. Recent initiatives
In 2007 the US National Institute of Standards and Technology (NIST), funded FarSounder Inc. for a three year project to develop a Forward Looking 3D Sonar System for navigation and collision avoidance, in order to improve the efficiency and safety of marine cargo transport (NIST, 2007). The optimal system design parameters were for applications that would be effective at long range (two miles) and high speed (35 knots). The speed criteria – up to 32 knots – have been realised in terms of the robustness and hydrodynamics of the installation and transducer design. However, current production systems only have a maximum range of 1,000m.
In 2009, the owners of a tanker fleet contracted with Marine Electronics Ltd for the development of navigation sonar with a 1,000m detection range and installed the prototype in one of their vessels (Hydro International, 2009). Although the project was subsequently abandoned, for commercial rather than technical reasons, it still indicates that in some commercial quarters at least, the benefit of navigation sonar has received serious consideration.
Between 2015 and 2016 research explored the utility of navigation sonar as a means to avoid hazards to navigation in a simulation of the Costa Concordia disaster and several other groundings (Wright and Baldauf, 2015; 2016). Its use as a means to perform hydrographic survey has also been evaluated against IHO minimum standards for Hydrographic Surveys (Wright and Zimmerman, 2015; Wright and Baldauf, 2016a). This research demonstrated the potential of navigation sonar to accomplish swath survey coverage for the route of transit with horizontal and vertical accuracies approximating IHO S-44 standards order 1a (IHO, 2008).
In December 2016, FarSounder Inc. (FarSounder, 2017a) performed sea trials using their FS-500 3D forward looking sonar that included comparisons with the U.S. National Oceanic and Atmospheric Administration (NOAA) multibeam data from a relatively recent survey shown in Figure 2 (NOAA, 2009). Corrections were made for tide, position, heading, course over ground, speed over ground, and rate of turn information were recorded. Grid size was set to match the NOAA grid size of 4m grid spacing and aligned, resulting in 1911 grid locations that overlapped between the FarSounder data and the NOAA data. High performance Real Time Kinematic (RTK) GPS was not used for positioning nor was heave measured or heave compensation performed. An iso-velocity sound speed of 1500m/s was assumed for all depths, and it is not known whether any sedimentation or scouring had occurred since the NOAA survey causing any changes to the measured depths. Given these conditions FS-500 depth measurements were found to have an average depth difference of 3.31% relative to the NOAA data with a standard deviation of 2.40%. The bathymetry output was produced in real time using an entirely automated process with no manual data cleaning.

In 2016, the Australian Hydrographic Service contracted for the replacement of the ageing Petrel sonars with FarSounder’s FS-1000 3D sonars. The first unit should be installed in an inshore survey vessel early in 2017. The rest will be progressively installed when craft are next taken in hand for refit. The new sonar has the capability to collect swath bathymetry ahead of the vessel.
In 2017 WESMAR will be supplying the first of six military versions of its EV850/110-10 sonar for new Arctic offshore ships being built for the Canadian Navy. This sonar operates at 110 kHz and has a nominal range of 2,000m. These vessels will enhance Canada’s support for growing Northwest Passage usage, resource exploitation and territorial claims under the United Nations Convention on the Law of the Sea (UNCLOS).
6. Navigation Sonar installations
Two types of Navigation Sonar systems presently exist, each utilizing different approaches to accomplish the same goals. One type uses a searchlight approach, steering the sonar beam scanning forward of the vessel and streaming soundings on a continuous basis. The second type uses a single ping to capture acoustic data which is then analysed to extract soundings from the data, and a swath of soundings is acquired using a series of pings. The number of beams emanating from either one or two sonar transducers, depending on manufacturer, can also vary widely. The same can be said for performance specifications with useful depths ranging from 50 to 200m and forward range extending from 200 to 2,000m. These systems are being installed in cruise ships, luxury yachts, hydrographic and other vessels.
7. Cruise and Expedition Vessels in Polar Regions and Transits
While some experienced ice navigators dis- count the effectiveness of navigation sonar for the detection of drifting ice (Toomey, 2012) there is support for its use in the detection of hazardous seabed features in polar seas. For several existing adventure cruise ships operating in Polar Regions, sonar is already making a significant contribution to ship safety (Skog, 2014, 2015). At present more than 50 cruise ships are active in the Polar cruise markets (Wright, 2017).
These vessels usually visit exotic tropical locations when transiting to and from polar cruising grounds. The Expedition vessel, World Discoverer (l.o.a. 88m, 3724 grt), was not fitted with any navigation sonar capability and grounded in Sandfly Passage, Solomon Islands in 2000 (Russell, 2014b). Following an aborted salvage attempt she remains where her master beached her to save his ship and passengers. In response to demand, replacement vessels are planned and under construction for the ageing fleet of conversions from Russian research ships, ferries and Nordic passenger ships. Many of these are expected to have Navigation Sonars installed.
In August 2016 the cruise ship Crystal Serenity (l.o.a. 238m, 69,000 grt) shown in Figure 3, made a successful transit of the North West Passage with 1,600 passengers and crew and escorted by the ice strengthened RRS Ernest Shackleton (Thiessen, 2016). Before undertaking this voyage owners sanctioned the fitting of a WESMAR scanning sonar and arranged for bridge personnel to receive onboard training in its operation. Larger traditional cruise ships, each with 500 to 3000 passengers routinely visit both Arctic and Antarctic waters. Celebrity Infinity (l.o.a. 294m, 91,000 grt) regularly takes 2,000 passengers on a cruise-by voyage past the Antarctic Peninsula, while the Costa Deliziosa (l.o.a. 294m, 92,700 grt) has carried nearly 3,000 to Greenland. In January 2017, The World, (l.o.a. 196m, 43,188 grt) a private residential cruise ship carrying 145 residents and guests and 272 crew, broke the record for the most southerly navigation reaching 78° 43•997´S and 163°41•421´W at the Bay of Whales in Antarctica’s Ross Sea (Maritime Executive, 2017). She is equipped with an FS-1000 Navigation Sonar (FarSounder, 2017b).

According to the Cruise Line Industry Association (CLIA), adventure cruise travel is growing at a record pace and expedition cruising to remote locations is seeing the impact of this trend (CLIA, 2016). At present there are 55 expedition, 548 motor and 75 sailing yachts of greater than 24m on order in 2017, many of which will transport thousands of passengers and crew to remote regions (Informer, 2017). The owners of these expedition vessels and luxury yachts are increasingly installing navigation sonar. This will safeguard the latter’s expensive acquisitions as they seek to provide unique experiences for their guests in remote and exotic areas where charting may be inadequate or non-existent. Such experiences have included transits of the NW passage. Expedition cruise providers cite the availability of navigation sonar as an additional safety feature to reassure prospective passengers.
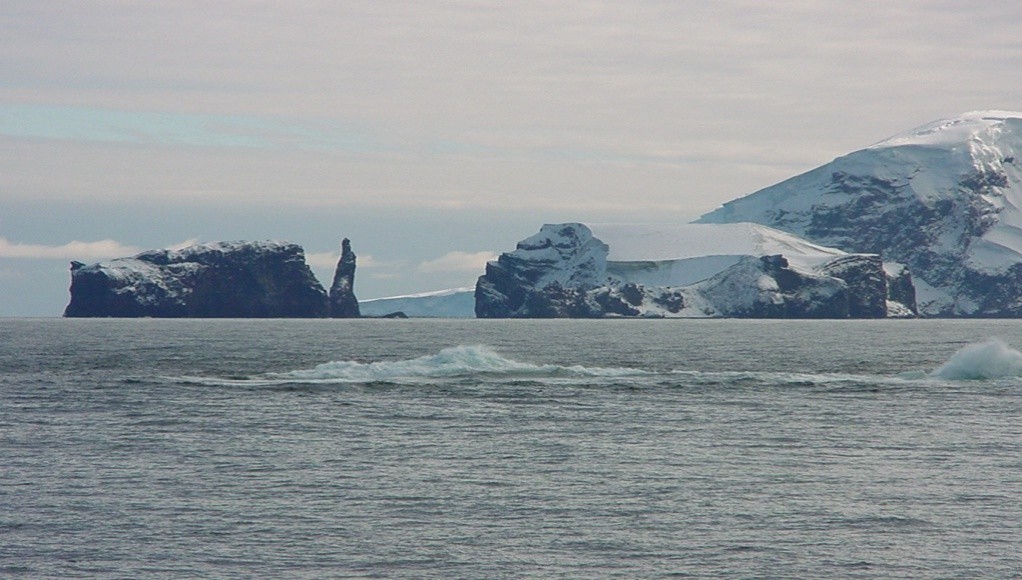
Compagnie du Ponant installed short range (440m/500m) navigation sonar in its four Le Boréal class expedition ships (l.o.a. 142m and 11,000 grt). It is understood that the “Explorer” class of four smaller vessels (l.o.a. 131m and 10,000 grt) which will enter service progressively from 2018 (Ponant, 2016) will feature FS -1000 sonars. In the USA, all Sunstone Ships Inc. expedition vessels have scanning navigation sonar and the company’s design of a purpose built series of 300 passenger capacity polar class expedition ships also specifies navigation sonar. They have good reason for this investment as Figure 4 illustrates.
8. Hydrographic Surveying and Research
The Australian Hydrographic Service (AHS) has long recognised the benefits of navigation sonar and is upgrading the systems in its four inshore survey vessels. The two larger hydrographic survey vessels are fitted with the longer range (3,000m) C-Tech CMAS 36 kHz scanning navigation sonar.
Various shorter range systems are fitted in the UK and Irish General Lighthouse Authority’s vessels. Navigation sonar has been specified by the British Antarctic Survey for inclusion in the bridge system of RRS Sir Richard Attenborough and one may be retro-fitted in RRS James Clark Ross.
9. Navigating the “White Spaces”
- A Case Study
Although the illustrations in the following discussion are relevant to Polar regions, the principles are equally applicable wherever depth data is sporadic, uncertain or absent. In 2010, the Expedition Cruise vessel Clipper Adventurer ran aground in Coronation Gulf in the Canadian Arctic whilst following a single line of soundings acquired in 1965 (see Figure 5). In 2007, a previously unknown shoal had been detected adjacent to this line. However it had not been charted as the vicinity of the shoal had not yet been surveyed to Canadian Hydrographic Service (CHS) standards. Instead, its position and reported least depth had been posted as a Notification to Shipping (NOTSHIP). The officers of Clipper Adventurer had not made themselves aware of this notice.
Although the Clipper Adventurer was equipped with a navigation sonar, it was unserviceable at the time. It was not due for repair until the end of the northern cruising season as its carriage was not required by either international or Canadian regulations for Polar voyages. The system was replaced at the docking which followed the grounding. The subsequent accident investigation report (TSB, 2012) noted that:

The unserviceable condition of the forward looking sonar deprived the bridge team of an additional source of valuable information. Forward looking sonars are designed to provide safety critical information regarding underwater obstructions ahead of ships, and provide automatic navigation alerts to bridge teams.
The report concluded:
1. The Clipper Adventurer ran aground on an uncharted shoal (Figures 6 and 7) after the bridge team chose to navigate a route on an inadequately surveyed single line of soundings.
2. Despite having a non-functional navigation sonar and not using any other means to assess the water depths ahead of the vessel, the Clipper Adventurer was proceeding at full sea speed (13.9 knots).
Figure 6 shows a shoal between the Lawson Islands and the Home Islands in the Southern Coronation Gulf in position 67° 58.25′ N, 112° 40.39′ W. Charted depth in area 29 m. Least depth found 3.3 m.
Figure 7 shows the Clipper Adventurer grounded on a hard rock shelf from approximately the forepeak to amidships. The weather deteriorated shortly after the grounding, hampering the salvage effort. Fortunately a survey vessel was on hand to provide salvors with updated depth data.


As the maximum nominal range of the sonar was 440m, the safe speed for its effective use would have been about 6 knots accompanied by heightened vigilance on the bridge. The decision to embark on a season of Arctic voyaging, when the charts were known to be inadequate; rather than reschedule the cruise programme and repair the sonar, was ill advised. It was also disproportionately costly to the company. Not only did it lose a substantial compensation claim against the Canadian government; but it will have to pay nearly $500,000 in environmental costs (Maritime Executive, 2017a).
- Polar Regions
In Antarctic waters the present day charts contain an alarming number of white spaces as Figure 8 shows. The surveys cited were undertaken by RV Tangaroa of the National Institute of Water & Atmospheric Research (NIWA) of New Zealand (Ching and Mitchell, 2006). The ship used multi-beam echo sounding (MBES) in water depths over 75m. Elsewhere a survey launch with a single beam echo sounder (SBES) and sidescan sonar completed the work, where ice conditions allowed. MBES is the only reliable means of disproving dangers where ice conditions effectively preclude the deployment of sidescan-sonar. There is limited access to open water in the short summer season; but weather conditions can still be adverse. Traditionally throughout Antarctica, large scale SBES coverage has mainly focused on the approaches to scientific bases. Increasingly research ships equipped with MBES are supplementing the limited deployments of dedicated survey vessels.

While the proximity of the Ross Sea coasts and islands to New Zealand and Australia attracts some cruise activity, the principal cruise destination is the western side of the Antarctic Peninsula. Here, the British Antarctic survey and British naval survey parties embarked in a succession of Ice Patrol naval vessels have been active since the middle of the last century. Yet only 13% of waters less than 200m deep have been adequately surveyed (IHO, 2016a). Cruise vessels, both independently and as part of a United Kingdom Hydrographic Office (UKHO)/International Association of Antarctic Tour Operators (IAATO) initiative, have had to resort to developing their own safe routes and anchorages using SBES. Some British Admiralty charts published in 2015 now show navigation corridors established by crowd-sourcing over the previous 10 years (Skog, 2017).
In northern waters the Northwest Passage with its adjacent sea areas and Russia’s Northern Sea Route (NSR) have not been properly charted. In the US the area of the Bering Sea is “only partially surveyed, and the charts must not be relied upon too closely, especially near shore”. “Off the Arctic coast of Alaska depths near shore may change as much as 6 feet (1.8m) because of ice gouging; storms also shift the sands in shallow water” (NOAA 2016). Following the adoption of a region specific Risk Assessment Methodology survey effort is focusing on heavily transited areas of high concern and development of offshore transit corridors (Gonsalves et al., 2015).
Only approximately 32% of Canada’s Arctic marine corridors are adequately surveyed, with an additional 3% surveyed to modern standards (CHS, 2015). There are many places along the coast of Greenland, where no systematic and comprehensive surveys have been carried out. A prioritised programme is in force to resurvey navigable routes to and between populated areas on the West Coast of Greenland to modern standards (Danish Geodata Agency, 2017). Russia announced plans to commission hydrographic surveys of the NSR to accommodate large ships (World Maritime News, 2012), but progress appears to be unsatisfactory (Gunnarsson, 2016).
Eight vessels, all members of the Association of Expedition Cruise Operators (AECO) contribute SBES soundings to the Olex system. This is a global data base of passage soundings mainly originating from fishing vessels. Individual depth data sets are generally downloaded at the end of the Arctic or Antarctic cruising season. These are then verified and can be uploaded by all users at the start of the following season. Safety critical information is reported immediately to the charting authorities and notified to other vessels in the vicinity (Skog, ibid.).
- South West Pacific
Another increasingly popular cruise destination from Australia is Vanuatu; where 55% of its water area under 200m deep strictly requires resurvey at larger scale or to modern standards (IHO, 2016a). In recognition of this, New Zealand carried out an IHO endorsed hydrographic risk assessment (Marico Marine NZ, 2013). The recommendations reduced the scope of the required survey effort by linking areas of marine activity with areas of demonstrated environmental and cultural value. Four critical areas were identified and these were surveyed in 2014 (Hydro International, 2014). An Australian cruise operator had previously commissioned surveys to improve access to some of the southern Islands of Vanuatu, for cruise landing access. Further assessments under the South West Pacific Regional Hydrography Programme have been undertaken for Tonga, the Cook Islands and most recently Niue (IHO, 2016c). They provide a more nuanced appreciation of the status of survey and charting from which to determine the extent and focus of remedial measures than the more generalised percentages stated in IHO C-55.
Regardless of where cruise ships operate the provision of depth information on charts covering unfrequented areas will continue to depend on opportunistic survey tracks for the foreseeable future. The capability of Navigation Sonar to provide a swath of soundings rather than a single profile should be exploited to the full. In effect this would develop a series of swept channels. Subsequent use of these would allow some flexibility in course keeping and provide a greater measure of reassurance to navigators than single lines of sounding.
10. Crowd sourcing bathymetry
- IHO and other Initiatives
NOAA and the IHO are collaborating on a project to improve the IHO Data Centre for Digital Bathymetry (DCDB) through the collection of crowd-sourced bathymetry (CSB). Ultimately the public will be able to upload, discover, display and download bathymetric data via a web-based interface. Integral to CSB is the establishment by the IHO of the Crowd-Sourced Bathymetry Working Group (CSBWG) that is tasked to develop a guidance document for the collection and submission of CSB data (Robertson, 2016).
Other projects underway include:
- Rose Point Navigation Systems coordinating with NOAA to allow users of their Coastal Explorer product to send anonymous GPS position and soundings data to a new international database managed by the NOAA Centres for Environmental Information (NCEI) (Reed, 2016).
- the TeamSurv BASE Platform project, funded by the European Union’s Horizon 2020 program, combines crowd-sourced with satellite derived bathymetry to enhance seafloor mapping (TeamSurv, 2016).
- The Sea ID project, which is developing a mass-available bathymetry survey platform with the IHO and the Google Ocean Program (Sea ID, 2017).
- The European Marine Observation and Data Network (EMODnet), which is building a Bathymetry portal data infra- structure with full coverage of all European sea-basins (EMODnet, 2016).
There is significant potential for the integration of the data products obtained from Navigation Sonar under crowd sourcing initiatives to improve the content of navigation charts. This is especially significant in poorly charted regions. Even a small percentage of the 678 expedition, sailing and motor yachts over 24m on order in 2017 would represent a substantial fleet of vessels of opportunity that could participate in crowd-sourcing initiatives.
11. Navigation Sonar Bathymetry
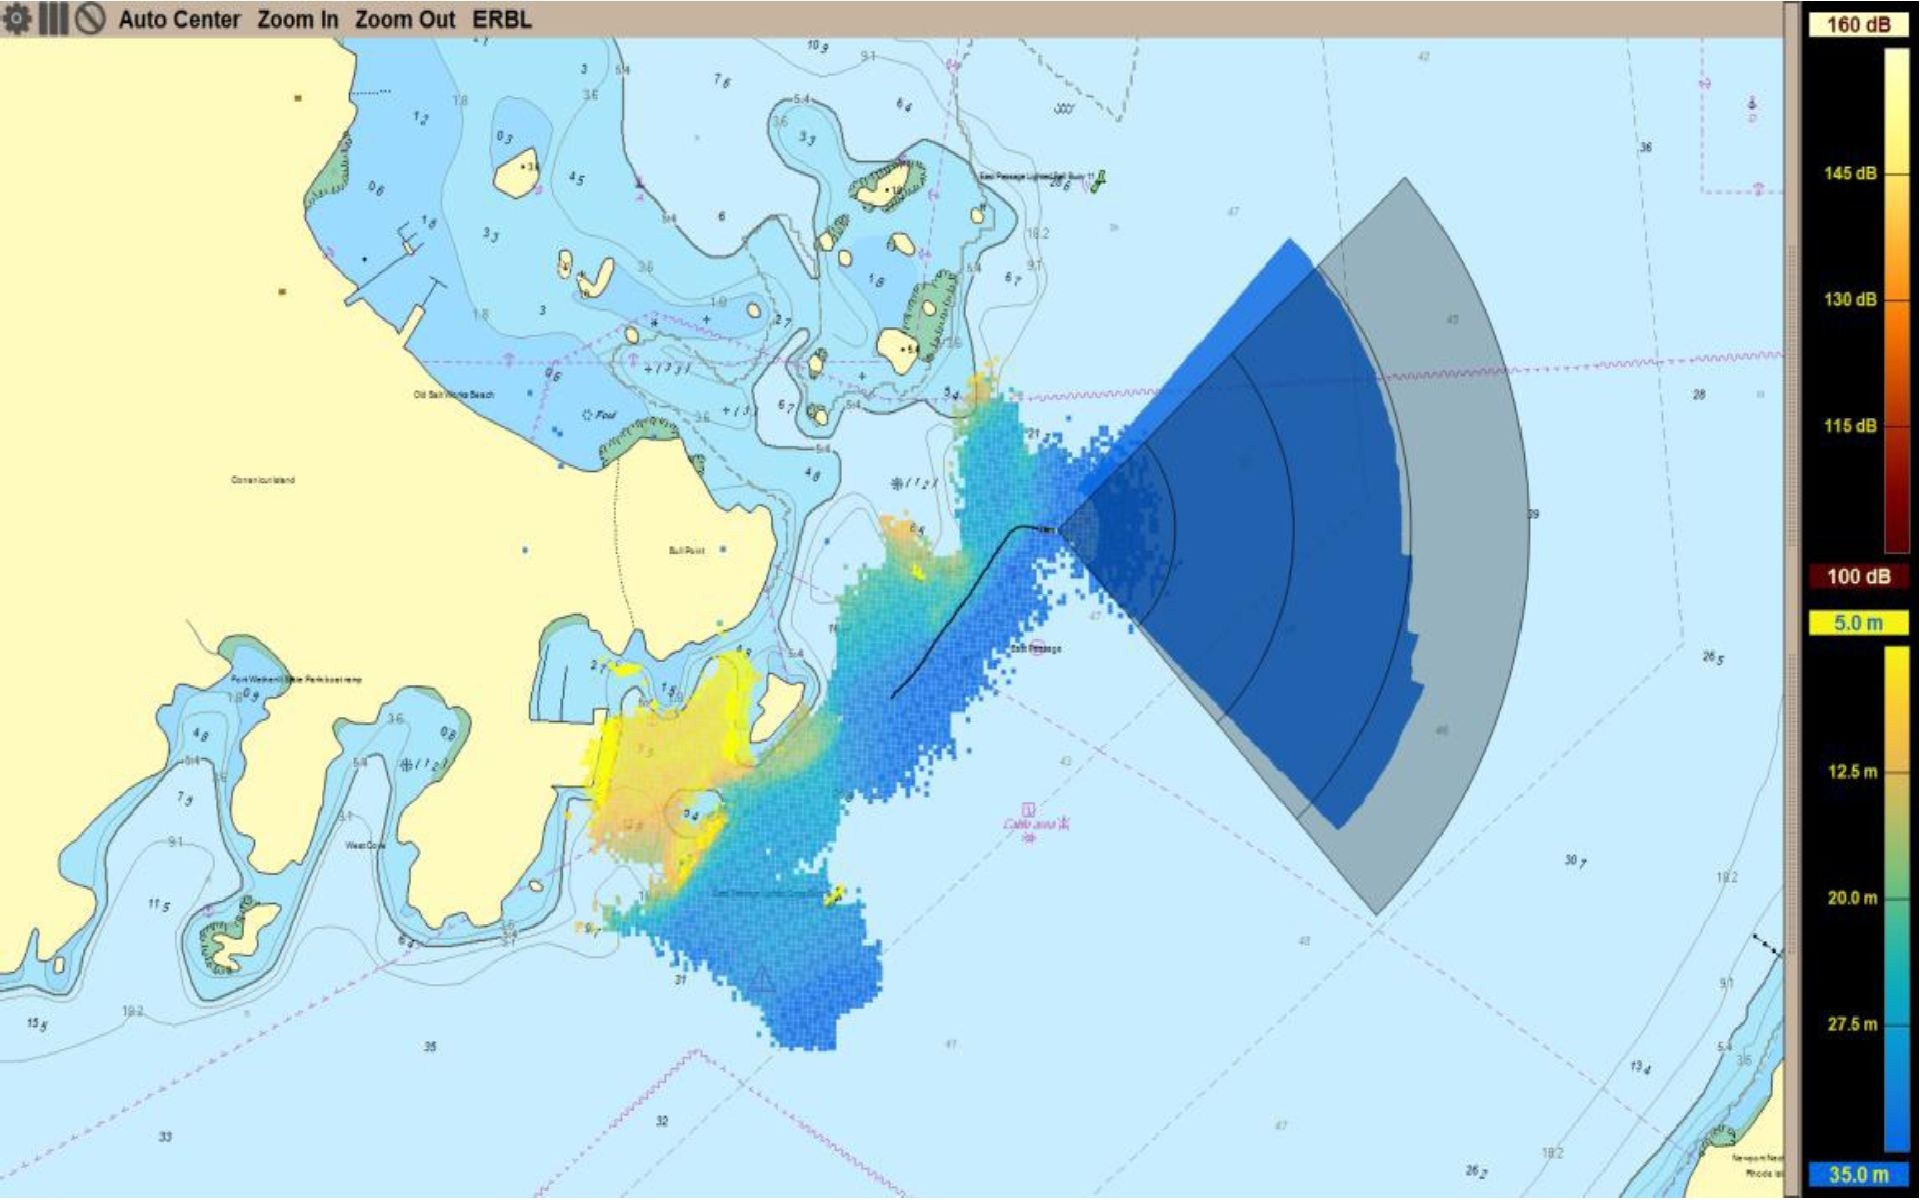
Data products produced by navigation sonar systems can range from non-existent, providing only a raster image, to a full and comprehensive representation of the acoustic environment from which the data from an entire voyage may be recreated. The comprehensive representation is exceptionally memory intensive, often resulting in 10 megabytes of data or more for each ping (Wright and Baldauf, 2016a). With a new ping every other second or so, data storage requirements can build up rapidly to where gigabytes of data are created for every few minutes of use. In addition, the formats and contents of these data are generally proprietary to each manufacturer. However, each of these systems render an image from the transducer data they collect that depicts a representation of a swath of soundings within the range of the system that is georeferenced with respect to the position of the vessel. A 2-dimensional image shown in Figure 9 can be shown as an overlay on a chart showing the bathymetric swath collected along and adjacent the vessel’s route.
- Data extraction
It is necessary to identify a basis upon which these common data may be derived from the individual formats in which they are created, rather than to attempt to use the data in their native, proprietary and diverse formats. Doing so will facilitate the extraction of only the actual data required for crowd sourcing, reducing the file size for one ping from its original size of greater than 10 megabytes to 6 kilobytes or less as the file would only contain text similar to the proposed data format being considered by the IHO CSBWG (Robertson, ibid.). Figure 10 provides an initial draft of a data specification that would be available from a ping-type of navigation sonar whereby one ping represents data simultaneously from many hydrophones, often numbering 200 or more. A different format would be required for searchlight sonars that would be similar to a data stream of a single beam echo sounder.
A record of data obtained would include metadata regarding the origin of the data and some of the characteristics of this source. This metadata need only be acquired once, whereby it can be attached as a header that accompanies all subsequent bathymetry data contained in a record comprising a set of files, with one file anticipated to be produced for each ping. The file name should ideally contain date and time information, plus any Unique ID that may be desired for identifying and managing the data (IHO, 2016d). Each ping file contains the sounding information derived from each active hydrophone, from 1 to the last hydrophone, e.g., 256, 512 or other value. The x,y,z values associated with latitude, longitude and depth from each hydrophone are contained in this file.

A complete record would consist of a header and the total number of files that represents pings over a specific period of time. This time-segmenting of the data is intended to facilitate ease of their transmission via existing communication channels. It also provides protection in the event data is lost to prevent the loss of entire data sets. It is not necessary or even desirable to capture all soundings from all hydrophones obtained during each ping. It is likely that a few hydrophones at the fringes and the corners of the transducer are likely to produce results that are statistically less accurate than in other areas. Indeed, there is a zone of between approximately 20 to 75 percent of the sonar cone distance that provides the most highly sampled and accurate soundings that should form the basis for the crowd sourcing of these data. This phenomenon is illustrated at the top of Figure 11 and is based upon the existence of a great deal of overlap between pings.

Also, the number of hydrophones providing useful data can vary as a factor of depth where shallow water can result in the acquisition of accurate but less useful data than would be possible in deeper water since spacing between soundings may be unnecessarily close. A statistical sampling of these soundings across multiple pings may be accomplished to determine their accuracy for each geographical area. This approach can also identify those areas that have been most sampled. Using this technique it is possible that the total record size for one hour of useful soundings data can be reduced to a few megabytes of data that can be easily transmitted via broadband cellular and satellite communications channels.
12. Navigation Sonar as a new method for ship navigation
The use of depth information and the marking of minimum depth contours to navigate has been a basic piloting skill for centuries. Navigation Sonar may also provide new capabilities to navigate vessels by providing the ability to view landmarks along the bottom and to navigate by georeferencing their position relative to that of the vessel. It may also provide new capabilities for the real time detection of changes in the seabed that have occurred since the revision of the current chart.
The availability of Global Navigation Satellite System (GNSS) delivering constant position, navigation and timing (PNT) in most navigable waters world wide has revolutionised navigation. In combination with the ENC, the look ahead and safe depth settings in ECDIS with associated alarms, can now automatically alert mariners to the proximity of shoal water and underwater hazards.
There are however caveats. To be fully effective, the ENC must be derived from recent and comprehensive surveys. Mariners therefore need to be aware of the limitations which may exist in areas where recent and comprehensive surveys do not exist, through a thorough understanding of Zones of Confidence (ZOC) used to convey the quality of charted information within ENC.
- Complementing the Navigation Suite
By providing 3D visibility into the waters ahead of the bow, Navigation Sonar can compensate for limitations in charted detail. Current systems have a range of 1,000m and scanning sonars normally operate at 1,500m or more. Consequently, provided a vessel’s speed is commensurate with the navigational situation and her manoeuvrability and the bridge watch is alert, timely avoidance action can be taken to prevent a grounding. In some ECDIS systems, the sonar display can be integrated with the ENC display.
However, changes are also in store for ENC as well. Many new capabilities for Navigation Sonar can become available by having higher resolution survey data with greater levels of detail contained within the ENC itself. This is presently being accomplished as a result of detailed hydrography data that is integrated within the IHO S-100 framework standard Universal Hydrographic Data Model. Specifically, the S-102 high definition gridded Bathymetry standard (IHO, 2012) supports development of new navigation products not possible under S-57 and previous standards.
- Navigation by Georeferencing
In the same way that a radar overlay and comparison against charted above-water features can be used to address known or suspected GNSS failure, a novel approach to ship navigation becomes possible with the use of Navigation Sonar. This involves a comparison between real time live seascape features and elevations, and those represented within an ENC. A “ship-centric” methodology is followed such that vessels may safely navigate using real-time information supplied by the vessel’s own sensors (Wright and Baldauf, 2015). This approach is based upon the premise that, given a specific geographic position, the corresponding position on a nautical chart should accurately represent the depth and bottom configuration of that position. Conversely, should the observed seascape via the Navigation Sonar differ markedly from charted depths and contours in the ENC (and particularly future high definition gridded bathymetry) then this would provide a clear indication that the ship’s position was in doubt.
With the potential availability of high density gridded bathymetry, this discrepancy detection could be taken one step further. While the shape of the seabed is described in fairly coarse terms in a traditional ENC (as a carry over from paper chart compilation practices), the much higher resolution that will be available in S-102 gridded bathymetry will enable much finer discrepancy detection. This will potentially include differences in seabed slope and rate of change of slope.
- Real-time detection of changes in bottom configuration
Further capitalizing upon the greater resolution and detail contained within ENC in accordance with IHO S-102, is the prospect of Navigation Sonar being able to detect in real time, changes in bottom configuration between that sensed by live rendering and that contained within the ENC. This can be accomplished by placing an overlay of the 3D model created by Navigation Sonar onto a 3D bathymetry model created from ENC, and highlighting areas of the bottom that show differences between the two models. Such information can be very useful in highly transited areas, especially after storms and other events that may drastically alter bottom topography.
13. Conclusions
Evidence points to a steady increase in both adventure and regular cruising in Polar and other less frequented waters. In particular, given the unsatisfactory state of nautical charting in many polar cruising areas, these trends are concerning. As grounding is the most likely cause of a marine casualty, the provisions of the Polar Code (IMO, 2016) may mitigate the consequences of such an incident, but will not prevent one. Navigation Sonar is already fitted in a variety of vessels and is being specified for new build adventure cruise ships, luxury yachts and research vessels. These vessels are more manoeuvrable than crude carriers and pose less of a threat to the environment if grounded. Nonetheless, the financial and human cost of a major casualty could be just as significant. Assessment of the benefits of installing Navigation Sonar should include the nature and location of the vessel’s area of operation, the status of charting, the distance from Search and Rescue services, climate, and environmental sensitivity. An effective sonar range of 1,000m should prove sufficient for vessels up to 200m in length, provided their speed and situation awareness are commensurate with the threat of encountering uncharted hazards.
While Navigation Sonar alone cannot guarantee a vessel’s safety in uncharted or inadequately charted waters, it can provide an important addition to the navigation suite. There is qualified support for this view in which issues of training, integration with existing navigation systems and cost effectiveness are recurrent concerns. At the same time there is no doubt that for certain applications such as coastal hydrographic surveying, littoral warfare and expedition cruising in Polar Regions and less frequented tropical seas, Navigation Sonar can be an invaluable aid to safer navigation. Installations in super yachts point to the possibility of improved integration of Navigation Sonar displays and intuitive operation. In common with observed development trends in technology, Navigation Sonar unit costs can be expected to reduce and capabilities and functionality increase.
With increased resolution and range, Navigation Sonar will help bridge watch keepers to maintain an effective watch below the waterline in the same way as radar enhances situational awareness on the surface. Integration into ECDIS will further enhance the utility of these systems. High resolution three-dimensional forward looking sonar can also acquire swath bathymetry. As bottom features become better surveyed and delineated, feature-based navigation using forward looking sonar will become more feasible; thereby lessening the dependence on GNSS as a primary means of geo-referencing. Navigation Sonar is already proving its worth in specific obstacle avoidance applications as is scanning sonar. In addition there is the potential for Navigation Sonar to make a significant contribution to Crowd Sourced Bathymetry.
14. References
CCG. (2010). Clipper Adventurer Photo. Canadian Coast Guard. August 2010. Reproduction is a copy of an official work that is published by the Government of Canada and that the reproduction has not been produced in affiliation with, or with the endorsement of the Government of Canada.
Ching, N. and Mitchell, J. (2006). “Surveying in the Ross Sea”. NZIS Survey Quarterly, December 2006, Issue 48. Abbreviated article viewed 7 March 2017 https://www.hydro-international.com/content/article/surveying-in-the-ross-sea
CHS. (2015). Arctic Charting. Viewed 2 March 2017 http://www.charts.gc.ca/arctic-arctique/index-eng.asp
CLIA. (2016). 2017 Cruise Industry Outlook. Cruise Line Industry Association. Dec 2016. Slide 25 Viewed January 2017 http://www.cruising.org/docs/default-source/research/clia.
Cruise-advisor 2017. Crystal Serenity North-west Passage. https://www.google.co.uk/?gws_rd=ssl#safe=active&q=crystal+serenity+northwest+passage+images
Danish Geodata Agency. (2017). Navigational Safety. view ed 9 March 2017 http://eng.navigation.gl/navigational-safety/
Dierssen, H. M. and Theberge, A. E. (2014). Bathymetry: History of Seafloor Mapping. viewed 5 February 2017 http://colors.uconn.edu/wp-content/uploads/sites/1423/2015/09/Dierssen_2014_ENRHistory.pdf
EMODnet. (2016). Welcome to the EMODnet Bathymetry portal. www.emodnet-bathymetry.eu. Accessed 9 Feb 2017.
FarSounder. (2017a). Unpublished research emailed information, 16 February 2017.
FarSounder. (2017b). Pers. comm. Russell/ Matthew Zimmerman, 16 February 2017.
Gonsalves, M., Brunt, D., Fandel, C., Keown, P. (2015). ”A Risk-based Methodology of Assessing the Adequacy of Charting Products in the Arctic Region”. U.S. HYDRO 2015.
Gunnarsson, B. (2016). Future Development Strategy for the NSR. Japan-Norway Arctic Science & Innovation Week, Tokyo June 2-3 2016. Viewed 8 Mar 2017. http://injapan.no/arctic2016-day1/files/2016/04/2_ASIW-Bjorn-Gunnarsson-Session-1.pdf
Hydro International. (2009). News item viewed at https://www.hydro-international.com/content/news/first-obstacle-avoidance-sonar-for-tanker
Hydro International. (2014). News item viewed at https://www.hydro-international.com/content/news/surveys-underway-to-update-vanuatu-navigational-charts
IHO. (2008). IHO Standards for Hydrographic Surveys, (S-44), 5th Ed., Monaco.
IHO. (2012). Bathymetric Surface Product Specification, (S-102), Edition 1.0.0, Monaco.
IHO. (2016a). Status of Hydrographic Surveying and Charting Worldwide, (C-55), published 19 December 2016. Viewed 30 January 2017, www.iho-ohi.net/S-100/index.html
IHO. (2016b). Background to World Hydrography Day. p.2. Viewed December 2016 https://www.iho.int/mtg_docs/WHD/2016/2016BackgroundENG.pdf
IHO. (2016c). Capacity Building. Risk assessment, methodology and tools. View ed 23 February 2017 https://www.iho.int/srv1/index.php?option=com_content&view=article&id=623&Itemid=407&lang=en
IHO. (2016d). Reasoning for the Creation of a Unique ID in a Digital Bathymetry Database from Crowd-sourcing Systems. CSBWG2/5/2. 4 February 2016.
IMO. (2016). Polar Code, International Code for Ships operating in Polar Waters, International Maritime Organisation (IMO), London.
Informer. (2017). Superyachts on Order by Type 2017 (over 24 meters). The Informer. Showboats. 24. February 2017.
Marico Marine NZ. (2013). Hydrographic Risk Assessment – Vanuatu, January 2013. Viewed 23 February 2017 https://www.iho.int/mtg_docs/CB/CBA/Risk/SWPRHP-Vanuatu-Risk-Assessment-Report.pdf
Maritime-Executive. (2017). Viewed 17 February 2017 http://maritime-executive.com/article/cruise-ship-sets-antarctic-record
Maritime-Executive. (2017a). Viewed 11 February 2017 http://maritime-executive.com/ article/grounding-judge-rules-against-cruise-ship-owner
Morris, R.O. (1995). Charts and Surveys in Peace and War, p.207. HMSO
NIST. (2007). Forward Looking 3D Sonar Sys-tem for Navigation and Collision Avoidance for Long Range and High Speed Applica- tions. Available at https://www.nist.gov/news-events/news/2007/09/nist-announces-56-new-awards-innovative-technology-rd
NOAA. (2009). NOAA survey H11988.
NOAA. (2016). U.S. Coast Pilot 9, Edition 34, 2016, Chs. 8 & 9. Viewed 8 March 2017 https://www.nauticalcharts.noaa.gov/nsd/coastpilot_w.php?book=9
Ponant. (2016). 4 New Ships by PONANT, viewed 6 February 2017 http://en.ponant.com/4-new-ships/
Reed, A. (2016). Beta test of crowd-sourced bathymetry holds promise for improving U.S. nautical charts. view ed 10 Feb 2017. https://noaacoastsurvey.wordpress.com/2016/06/14/beta-test-csb/.
Robertson, E. (2016). Crowd-sourced Bathymetry Data via Electronic Charting Systems. NOAA. National Centre for Environmental Information (NCEI), Slide 12.
Russell, I.C. (2014a). “No Solace from SOLAS”, International Hydrographic Review, May 2014, pp 7-20.
Russell, I.C. (2014b). “Casualties of the Nautical Chart”. Hydro International, September 2014, p.18.
Sea ID. (2017). Crowd Sourced Bathymetry Exchange Programme. view ed 9 Feb 2017. https://www.sea-id.org/csb
Skog, L. (2014, 2015). Pers com Russell/ Captain Leif Skog, Vice President of Marine Operations at Lindblad Expeditions and other Masters of Expedition Vessels.
Skog, L. (2017). Pers. com. Russell/Skog 16 February 2017-02-18.
TeamSurv. (2016). Using the crowd to map our seas. View ed 8 Feb 2017. www.teamsurv.com
Theberge, A.E. (1989). “Sounding Pole to Sea Beam”, Surveying and Cartography, Volume 5, 1989. Pp. 334-346. Viewed 17 January 2017 http://www.photolib.noaa.gov/cgs/sound.html
Thiessen, M. (2016). “Thanks to Melting Ice, Cruise Ship Travels Northwest Passage”. US News and World Report. View ed Sept. 9, 2016. http://www.usnews.com/news/news/articles/2016-09-09/giant-cruise-ship-makes-historic-voyage-in-melting-arctic.
Toomey, P.R.M. (2012). “Ice Navigation and the -Electronic Age”. Hydro International, Nov – Dec 2012 vol.16 no. 8. viewed January 2017. http://www.hydro-international.com/issues/articles/id1418-Ice_Navigation_and_the_Electronic_Age.html
TSB. (2012). Transportation Safety Board of Canada (TSB). Marine Investigation Report M10H0006. Grounding of Passenger Vessel Clipper Adventurer, Coronation Gulf, Nunavut 27 August 2010. Gatineau: TSB; 2010. 35 p. Report Number M10H0006.
WESMAR (2017). Pers com Russell/Black 24 January 2017
World Maritime News. (2012). Russia Makes Plan for Northern Sea Route Hydrographic Survey. View ed 8 March 2017 http://worldmaritimenews.com/archives/51076/russia-makes-plan-for-northern-sea-route-hydrographic-survey/
Wright, R.G. and Baldauf, M. (2015). “A Georeferencing Approach to Real-Time Virtual Aid to Navigation Verification”, Proc. ION GNSS+ Conference 2015, Institute of Navigation, Tampa, FL, 14-18 Sep. 2015.
Wright, R.G. and Baldauf, M. (2016). “Arctic Environmental Preservation through Grounding Avoidance”, Sustainable Shipping in a Changing Arctic Environment, Springer. London. 2016. in Press.
Wright, R.G. and Baldauf, M. (2016a). “Hydrographic Survey in Remote Regions: Using Vessels of Opportunity Equipped with 3- dimensional Forward-Looking Sonar”. Journal of Marine Geodesy. DOI 10.1080/01490419.2016.1245266.
Wright, R G. and Zimmerman, C. M. (2015). “Vector Data Extraction from Forward-Looking Sonar Imagery for Hydrographic Survey and Hazard to Navigation Detection”, IEEE/MTS Oceans Conference, Washington D.C. 19-22 Oct 2015.
Wright, R G. (2017). Survey of various Arctic, Antarctic cruise and ferry service Internet listings identified on 17 January 2017.
15. Authors’ Biographies
Ian Russell is a Fellow of the Royal Institution of Chartered Surveyors and Member of the Nautical Institute. He has 25 years experience for hydrographic surveys of nautical charting in the SW Pacific, SE Asia, the Indian Ocean, the Caribbean, UAE, the North Atlantic and UK home waters. He is a former Senior Lecturer in Hydrography at Southampton Solent University. Past consultancy assignments have included hydrographic aspects of marine casualties, maritime boundaries and the implementation of UNCLOS article 76. Authorship of articles on nautical charting issues relating to new navigation and hydrographic survey technology.
Glenn Wright holds a PhD in Maritime Affairs, MS in Computer Science and BS in Electrical Engineering; and has over 37 years’ experience in industry leading projects associated with sensor-based systems for electronic test, aerospace, maritime and medical applications. He is a US Coast Guard licensed Master Mariner and Captain of a research vessel equipped for exploring meteorological, oceanographic and electromagnetic phenomena. He has successfully led many commercial and Government projects for the DOD, NOAA, NASA, NIH and IARC. Dr. Wright is widely published with over 70 technical papers and seminars, magazine articles and book chapters.