


Abstract
1. Introduction
Tedious and monotonous tasks are common in hydrographic data processing and nautical documentation update. If left to surveyors and cartographers to complete manually, these tasks are a poor use of human time, and the monotonous nature of the work is especially conducive to human error. These tasks typically arise when applying the very particular specifications of a hydrographic office (HO) to vast amounts of data. However, since many of these requirements are by design objective and quantitative, it is straightforward to interpret them algorithmically, and the monotonous nature of some actions performed by the reviewer makes them suitable for automation. This shift has the benefit of increasing accuracy and reproducibility due to the reduction of subjectivity and human errors, as well as faster overall ping-to-chart times. In addition to the benefits of efficiency, and improved data quality, the ability to provide algorithmic interpretation of specific requirements for hydrographic processing and cartographic generalization is an important step towards a fully automated workflow.
Having this kind of automation implemented in stand-alone tools – agnostic as to the underlying processing software – provides significant advantage: by acting like agents that inspect data products in their entirety, they help to increase confidence in the survey data. However, to enable these quality-control (QC) tools, the data created by the processing chain must be algorithmically accessible. The ocean mapping community has two existing popular open-source formats that facilitate this: the Open Navigation Surface Bathymetry Attributed Grid (BAG) format (Calder et al., 2005) for gridded bathymetric data, and the International Hydrographic Organization (IHO) S-57 format (IHO, 2000) for vector features. Additional proprietary data formats can be added, avoiding translation steps, so long as the manufacturer provides some access library.
The QC Tools package, described here, implements these ideas (Wilson et al., 2016). Written in Python (Python Software Foundation, https:// www.python.org/), QC Tools are flexible, and Python’s popularity in the scientific community may encourage engagement and additional development. Since it uses a highly modularized environment, each component of QC Tools can be easily customized (or even substituted) to meet agency-specific requirements without dependence on a software pack-age-specific solution. To facilitate its implementation, QC Tools uses the HydrOffice (https://www.hydroffice.org/) project, a collaborative effort led by the Center for Coastal and Ocean Mapping (CCOM/JHC) to make available and easily accessible, several libraries likely to be useful in the construction of ocean mapping tools.
2. Common Challenges Conducive to Automation
A ping-to-chart workflow consists of many steps, each of which will usually require some level of user intervention. To avoid spreading user effort across all the data equally, a fundamental idea developed in the last decade is to prioritize areas of intervention and focus only on the data that requires remediation. In this mold, QC Tools considers bathymetric grids and feature files, which are now typical final products of a survey, and provides tools to address problems, which are common to these data products, irrespective of the particular hydrographic office (HO) specifications in force for a particular survey.
- Fliers, Holidays, and Grid Data Quality Metrics
Anomalous grid depth data, commonly described as “fliers”, result when spurious soundings affect gridded bathymetry. Traditional methods of flier identification include 3D-viewers, shoal-biased sounding selections, and close examination of various grid metrics. However, these methods are far from foolproof, and it is quite common for fliers to be missed during a manual review. In 2015, it was reported that nearly 25% of the surveys received by the NOAA Hydrographic Surveys Division (HSD) were affected by fliers (Gonsalves, 2015). This perhaps should not be surprising. Even with 3D-views and statistical representations of grid nodes, it appears to be unreasonable to expect a human reviewer to have definitively identified all the fliers that might reside in grids that routinely consist of several millions of nodes. Some degree of automation to scan through the nodes would aid reviewers by flagging anomalies they may have missed, especially those of lesser magnitude, which are more difficult to detect manually.
Similarly, inspection to ensure that no grid data gaps or “holidays” exist is a task that is tedious to complete manually, and reviewers missing these also appears to be common. Given clear definitions of what constitutes a grid data holiday, it is possible to automatically scan for potential standards violations. Additionally, a review of “designated” soundings in a grid (i.e., soundings manually tagged by the reviewer as significant) may be required, for instance where HO specifications may exist to govern their proper use, or even to prevent their overuse. Such specifications often require tedious vertical or horizontal measuring by the reviewer, which can be easily and quickly accomplished by automated routines.
Finally, specifications from a HO might define statistical metrics for a bathymetric grid; for example, that the data density or uncertainty meets certain limits. Manufacturer-specific software solutions can compile many such metrics, but such solutions cannot be easily customized to follow HO specifications that may change year to year, or HO to HO. Automated routines created in-house can be tailored to the exact specifications which can provide an appropriate “pass” or “fail” indication to the reviewer.
- Feature Validation
Manual data entry (and the review of these entries) of mandatory attribution of feature objects can be extremely tedious, error-prone, and time consuming. Ensuring adherence to a multitude of rules and best practices that govern the proper cartographic attribution of the feature objects is similarly monotonous work. Many of these requirements are mechanical and therefore conducive to automation. Tests can be added, for example, to provide simple safeguards against attribute redundancy, or more complex use of contours and depth areas to validate attribution.
Numerous manufacturer-specific approaches to S-57 validation exist. The ability for an HO to develop specific validation tests is available in some systems – often the same as the production system. Alternatively, the HO will have to contract the manufacturer to develop them. In most cases, however, the HO uses several different software solutions to achieve an independent QC solution that covers all test scenarios. The structure of HydrOffice permits HO-specific feature validation checks (previously left to the human reviewer) to be algorithmically performed. For example, a common task is ensuring those feature objects that have the S-57 attribute VALSOU (“value of sounding”) match the gridded bathymetry with respect to depth and position. This is simple for small numbers of features, but becomes not only tedious but a major waste of human resources as the feature-count increases. Automated checks can scan the gridded bathymetry to ensure that the grid and attributes are consistent.
- Sounding Comparisons
Throughout the charting process, it is often necessary to compare sounding selections. Generally, one set is a dense selection from the current survey, and the other is the older, sparse set of soundings and features that are currently charted. Sounding selections may be compared to quickly identify shoals and dangers to navigation not adequately represented in the current chart, or to validate a prospective set of new chart soundings with respect to the dense survey soundings from which it was derived, ensuring it adequately represents the most significant shoals from the dense selection. Since a dense selection of survey soundings routinely consists of tens of thousands of soundings, which are intended to supersede the hundreds of chart soundings, it is not reasonable to expect a reviewer to manually review all of the potential dangers to navigation, or shoals otherwise not well represented. Some degree of automation is critical for verification and to ensure no shoal points were missed.
3. Case Study: NOAA Coast Survey Workflow
The survey specifications and in-house best practices of the NOAA Office of Coast Survey have been used as a pilot study to guide the implementation of HydrOffice QC Tools in addressing the QC checks outlined previously. QC Tools provides an algorithmic interpretation of Coast Survey specifications (NOAA, 2016a), which can easily be adjusted as these specifications are revised. The tools can also be used to train new personnel: problems identified in the grid or feature data can aid the user to better understand HO specifications and their interpretation.
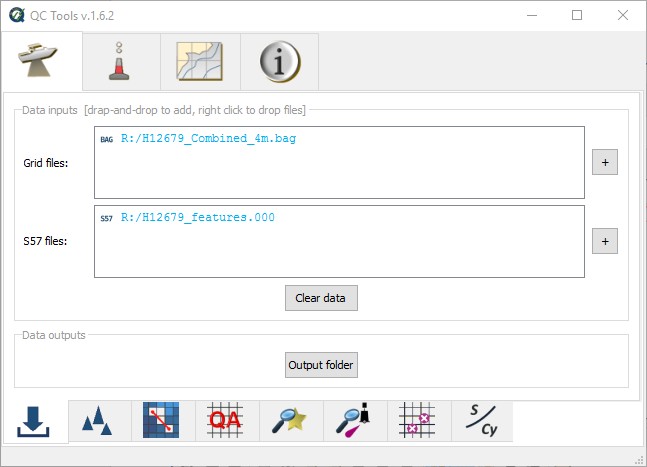
The QC Tools interface (Figure 1) has separate tabs for (reading from left to right on the top of the frame): Survey Review, Danger to Navigation scanning, Chart Review, and an information tab that includes a user manual, license information, etc. The Survey Review tab is shown here and has functions to (reading from left to right on the bottom of the frame): import data, detect anomalous grid data “fliers”, detect grid data “holidays”, ensure requirements for grid sounding density and uncertainty have been achieved, scan selected designated soundings to ensure their significance, implement an agreement check to ensure consistency between grids and features, and an export function for seabed area characteristics.
- Grid Review Automation
The first sub-package, “Detect Fliers” (Figure 2), automatically searches for anomalous depth values in dense gridded data via five separate algorithms, some of which require an estimated search height. This search height may be derived automatically, based on the median grid depth, depth variability, and grid “roughness”, and used for detection such that a relatively flat seafloor in shallow water would have a small detection height (making the algorithm sensitive to potential anomalies), whereas a deep water survey in a very dynamic area would have a large detection height to find the worst anomalies while guarding against excessive false positives. Automatically estimating an anomaly height has the benefit of standardizing this process throughout the various levels of review; it is still possible, although not recommended, to manually set the detection height.
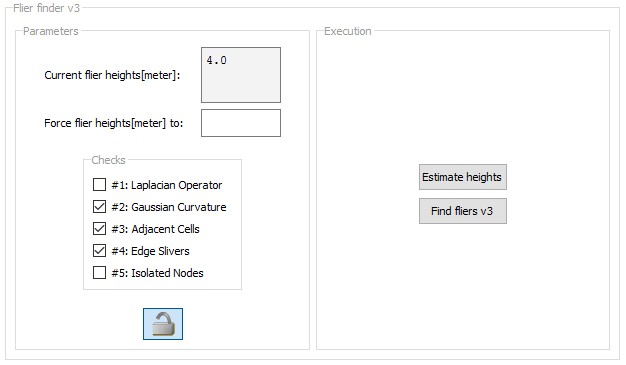
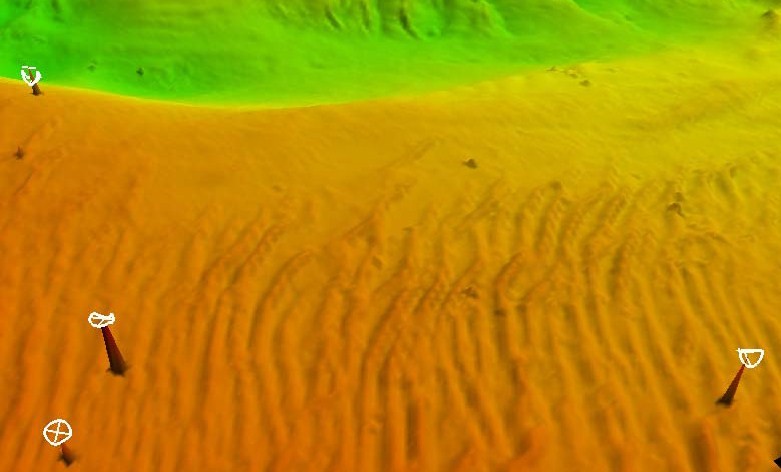
Typical problems in a grid include shoal or deep spikes (Figure 3), isolated nodes occurring along grid edges, or nodes detached from the grid altogether; separate algorithms were developed to identify these. The given algorithms may be enabled or disabled for customized flier search and identification. Algorithms 1-3 use various means to detect shoal or deep spikes in the grid, whereas algorithm 4 finds fliers on grid edges (common in sparse data), and algorithm 5 detects isolated nodes detached from a grid, which are often hard to detect manually.
An estimated height for the fliers is derived automatically, based on the median grid depth, depth variability, and grid “roughness”, and used for detection such that a relatively flat seafloor in shallow water would have a small detection height (making the algorithm sensitive to potential anomalies), whereas a deep water survey in a very dynamic area would have a large detection height to find the worst anomalies while guarding against excessive false positives. Automatically estimating an anomaly height has the benefit of standardizing this process throughout the various levels of review; it is still possible, although not recommended, to manually set the detection height.
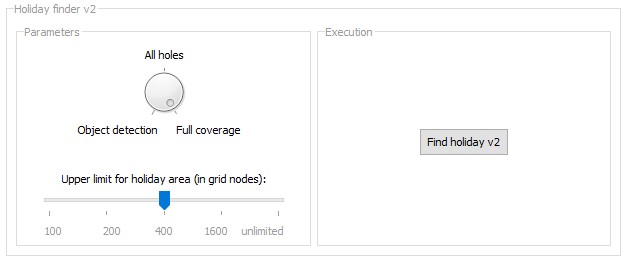
“Detect Holidays” (Figure 4) scans for (one or more) unpopulated nodes, or “holidays”. Parameters may be set such that all holidays are identified, regardless of their size, or so that just those holidays defined by specification are detected. In Coast Survey, holidays are defined by multibeam echosounder coverage requirements.
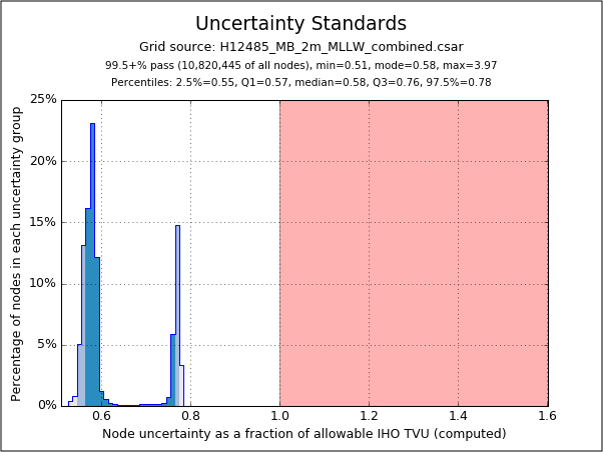
Data density and uncertainty requirements are also specified (NOAA, 2016a), and “Grid QA” identifies areas failing these metrics. The output shown in Figure 5 plots the ratio of computed uncertainty to allowable uncertainty, summarized over all grid nodes. The red space exceeds tolerance according to Coast Survey standards; in this case, more than 99.5% of the nodes meet the specification. The evaluation criteria can be easily adjusted to meet any specification.
Finally, “Scan Designated” validates the hand-selected soundings (considered to be hydrographically significant by the data processor) against the grid according to Coast Survey specifications to ensure their significance. In all cases, any discrepancies are automatically highlighted for the reviewer.
- Feature Review Automation
QC Tools provides a “ Scan Features” module, which has required S-57 attribution checks coded per hydrographic requirements (NOAA, 2016a), and a separate test to meet cartographic requirements (NOAA, 2016b), which are used at different points along the charting process. User parameters allow for further customization based on whether field or office review is being conducted, or which year of the specification is to be applied. The “Check VALSOU” module scans the gridded bathymetry to ensure a grid node is found for each feature object, and that the depth and position of the grid node match (to a specified precision) that of the feature’s VALSOU attribute and declared position.
- Sounding Comparison Automation
QC Tools implements a longstanding best practice in Coast Survey for comparison of sounding sets. Informally called the “Triangle Rule”, this algorithm builds a triangulated irregular network (TIN) (Figure 6) from existing chart soundings and features (in black), then matches the dense set of survey soundings (in blue) within the triangles of the TIN; any survey sounding shoaler (in red (high priority) and beige (lower priority)) than any of the three vertices of its containing triangle is marked as a potential problem. The QC Tools implementation also computes the magnitude of the discrepancy against the chart and adds it as an S-57 attribute, allowing the identified soundings to be sorted. In this manner, the most significant discrepancies (and potential dangers to navigation) are identified immediately. The Triangle Rule, as a method of sounding comparison, has two implementations in QC Tools, one to be used during survey review as a quick identification of dangers to navigation, and one to be used during chart review as a method of validating a prospective chart sounding selection prior to its application.

4. Conclusions
QC Tools highlighted several common challenges in the charting workflow. These are illustrated in the Coast Survey processing and validation chain, but are generically applicable to other HOs. The modular software architecture of HydrOffice eases the customization of tools to a specification, as the code describing the specification is largely separate from the graphical user interface and so is easily modified or replaced. For the same reason, the specifications implemented are easily updated as they evolve. QC Tools provides an alternative to relying on software manufacturers who may be unable, or unwilling, to accede to requests for customization of their software for a particular HO’s requirements.
Instead of attempting to replace large portions of a standard workflow with a monolithic application, QC Tools adopts a divide-and-conquer approach that focuses on the most time critical and error prone steps, as discovered through user experience and feedback. By design, QC Tools w ill not now , or in the future, substitute an existing processing chain, but is intended to be complementary to it, providing valuable (even critical) supplementation of operator assessment with automated scanning over large data sets.
The results in Coast Survey are quite positive, with the project receiving enthusiastic feedback from field users. Recent observations have cited an increase in Coast Survey data quality and timeliness, in part attributed to the field implementation of these tools (Evans, 2017). Use of QC Tools instills confidence that survey products have been thoroughly reviewed, and that they adhere to specifications. QC Tools can also be used as a training tool for HO-specific requirements for new hires.
Finally, QC Tools inherently provides algorithmic interpretation of HO specifications, making them available for future tools and further automation. Having a solid base of version-controlled algorithms allows for stable expansion to further automation in the future.
5. Acknowledgments
The authors would like to thank NOAA Coast Survey and UNH CCOM/JHC for actively supporting new products and innovation. We also acknowledge NOAA users for their endless enthusiasm in testing and providing feedback to improve HydrOffice QC Tools, and to the Coast Survey Hydrographic Systems and Technology Branch for the help in the integration within their software distribution. This work was partially supported by NOAA grants NA10NOS4000073 and NA15NOS4000200.
6. References
Calder, B., Byrne, S., Lamey, B., Brennan, R. T., Case, J. D., Fabre, D., Gallagher, B., Ladner, R. W., Moggert, F., and Paton, M. (2005). “The open navigation surface project”, The International Hydrographic Review, 6, 2
Evans, B. (2017). “What are our Shared Challenges”, Proceedings NOAA Field Procedures Workshop, Virginia Beach, Virginia, USA.
Gonsalves, M. (2015). “Survey Wellness”, Proceedings NOAA Field Procedures Workshop, Virginia Beach, Virginia, USA.
IHO (2000). Transfer Standard for Digital Hydrographic Data, S-57, Edition, 3.1.
NOAA (2016a). National Ocean Service Hydrographic Surveys Specifications and Deliverables. March 2017, 189 p.
NOAA (2016b). Office of Coast Survey HCell Specifications. 29 p.
Wilson, M., Masetti, G., and Calder, B. (2016). “NOAA QC Tools: Origin, Development, and Future”, Proceedings Canadian Hydrographic Conference, Halifax, Nova Scotia, Canada.
7. Authors’ biographies
Matthew Wilson is a physical scientist with the NOAA Office of Coast Survey. He received an MS degree in Ocean Mapping (UNH, USA) in 2012 and an MBA degree (Penn State, USA) in 2016. He works at the Atlantic Hydrographic Branch in Norfolk, Virginia, involved in data verification, software development, and ship support.
Giuseppe Masetti received an MS degree in Ocean Engineering (UNH, USA) in 2012, and a Master in Marine Geomatics (2008) and Ph.D. (2013) in System Monitoring and Environmental Risk Management (University of Genoa, Italy). As a Research Assistant Professor at CCOM/JHC, he is focusing on hydrographic data processing and acoustic backscatter.
Brian Calder is a Research Associate Professor and Associate Director at CCOM/JHC (UNH, USA). He has a M.Eng (Merit) and Ph.D. in Electrical and Electronic Engineering, with a thesis that focused on Bayesian methods in sidescan processing, from Heriot-Watt University, Scotland (1994, and 1997, respectively). He is currently focusing on statistically robust automated data processing approaches and tracing uncertainty in hydrographic data.