


Abstract
1. Introduction
The International Maritime Organization (IMO) requires commercial shipping to carry nautical charts and nautical publications for planning and displaying the ship’s route for an intended voyage. The IMO has adopted the use of Electronic Navigational Charts (ENC), which are vector charts with a standardized content, structure and format described in the International Hydrographic Organization Standards Publication S-57 (IHO, 2000). ENCs are intended for use in an Electronic Chart Display and Information System (ECDIS), which is a geographic information display system used for nautical navigation and can also interface with other navigation systems, such as GPS, RADAR, and echosounders. The ECDIS itself has been adopted as part of carriage requirements for shipborne navigational systems and became mandatory for certain regulated vessels in July 2018 (IMO, 2012). Although paper charts are still in use, more and more mariners have switched to a digital form of these charts, known as Raster Navigational Charts (RNCs) that can also be loaded into ECDIS equipment and used together with an appropriate folio of up-to-date paper charts in the absence of ENC (IHO, 2018). However, RNCs only meet IMO carriage requirements where there is no ENC availa-bility. Similar to RNCs, ENCs are produced at various scales. However, while there can be any number of RNCs, produced at various scales, for any given area, ECDIS is limited to displaying no more than six different scale charts, one for each of the six ENC scale bands, – also called usage bands – in which only one chart at any scale can be produced over any given location. The division between the ECDIS scale bands is based on the intended navigational use: overview (Band 1), general (Band 2), coastal (Band 3), approach (Band 4), harbor (Band 5) and berthing (Band 6).
The format, information, and intended uses of NOAA charts, defined here as the RNC-First Approach, have not changed much over the past 150 years. Since NOAA introduced the ENC product, more than 20 years ago, the size of commercial vessels has increased more than four-fold (UNCTAD, 2017), modern navigational systems have become more sophisticated, and recreational boaters have joined professional mariners in using electronic chart displays. Marine and coastal users of all types are expecting more precision in the charted positions of features, higher resolution of depth information on electronic charts, and easier access to charts and chart updates that are more frequent.
In a digital production environment, the provision of data for many of the charted features can be streamlined into a hydrographic office (HO) in a digital format. Web services can provide shoreline and depth information as shapefiles, permits and other documents as scanned PDFs, and aids to navigation data as Excel spreadsheets. However, NOAA is currently managing two charting production lines that are not consistently harmonized with each other. As part of NOAA’s ENC-First approach, it has been important to develop cartographic rules that will standardize charting products within the same scale band, independent of geographic location. It is also important to be aware of the technological advancements over the past 30 years of display systems on marine vessels, establishment of international distribution centers for ENCs, GIS portals, and non-navigation applications that only incorporate subsets of the charting products. As such, the goal of this report is to describe the benefits, challenges, and current results of NOAA’s effort to re-scheme its ENC suite.
On March 8, 2017, NOAA invited the public to provide comments on a draft National Charting Plan (NCP). The NCP is a strategy to improve NOAA nautical chart coverage, products, and distribution. It consists of two parts: the first part describes the current set of NOAA nautical chart products and their distribution, and second part describes some of the steps proposed to improve those products, including changes to chart formats, scales, data compilation, and symbology. This paper quantifies and explains key topics mentioned in the NCP that include current challenges with the ENC products and cartographic rules to provide a seamless, tiled coverage that can easily be segmented or extended based on geographic location, available data and scale. Examples of NOAA’s regional chart coverage and charting of principle ports are presented in this paper to illustrate the ENC-First approach that standardizes 1,000+ irregularly shaped ENC cells using no more than 12 scales, instead of the current 100+.
2. Key issues resulting from ENCs derived from RNC Products
Most commercial ECDIS displays allow their users to select an ENC display according to usage bands. In order for a mariner to manage ENCs over the same area using different themes or navigational usage, IHO S-57 requires Hydrographic Offices (HOs) to identify a usage band for of their published ENC cells according to navigational purpose, depending on the scale of the source material used to compile them (IHO, 2000). The various ENC usage bands provide the mariner with different information based on the navigational purposes and detail preferred for display (IHO, 2002 and 2003). However, the S-57 ENC Product Specification does not provide guidance on the appropriate scale ranges to be used for each of the six Navigational Purposes. This issue was also identified in the context of controlling on-line generalization and multiscale ENC data management displayed in ECDIS using the SCAMIN (scale minimum) S-57 attribute (IHO, 2000; Leder, 2007). The SCAMIN attribute is the minimum scale at which an object may be used (e.g., for an ECDIS presentation) and allows optimal nautical data representation for any scale and purpose. Thus, an ENC is not cluttered when displayed at a smaller scale than the scale which the data was originally compiled (IHO, 2000).
An official IHO recommendation for scale ranges and usage band was published in 2004, several years after some leading HOs had already decided on their own national usage bands and started to compile their ENCs accordingly (IHO, 2004a, b). Two IHO publications that were approved at that time (IHO S-65 and a SCAMIN paper) strongly recommend HOs assign each ENC to a navigational purpose based on the ENC’s compilation scale (Table 1). With that said, the inter-relationship and interaction between usage bands, SCAMIN, and compilation scale are particularly problematic and it is difficult to formulate voluntary guidelines that resolve all of the problems and that are acceptable to all HOs with differing views of these issues (Pharaoh, 2007). For example, Table 2 presents the different definition of the usage bands by NOAA and the Canadian Hydrographic Office.
| Usage Band | Navigational Purpose | IHO Recommended Scale Ranges (1:) | Radar Ranges (NM) | Available compilation scales (1:) |
| 6 | Berthing | > 4,000 | < 0.25 | |
| 5 | Harbour | 4,000 – 21,999 | 0.25 – 0.75 | 8,000 12,000 |
| 4 | Approach | 22,000 – 89,999 | 1.5 – 3 | 22,000 45,000 |
| 3 | Coastal | 90,000 – 349,000 | 6 – 12 | 90,000 180,000 |
| 2 | General | 350,000 – 1,499,999 | 24 – 48 | 350,000 700,000 |
| 1 | Overview | < 1,499,999 | 96 – 200 | 1,500,000 3,000,000 |
(according to IHO, 2004a and b).
| Usage Band | Navigational Purpose | NOAA Scale Ranges (1:) | CHS Scale Ranges (1:) | IHO Recommended Scale Ranges (1:) |
| 6 | Berthing | > 5,000 | > 2,000 | > 4,000 |
| 5 | Harbour | 5,001 – 50,000 | 2,001 – 20,000 | 4,000 – 21,999 |
| 4 | Approach | 50,001 – 150,000 | 20,001 – 50,000 | 22,000 – 89,999 |
| 3 | Coastal | 150,001- 600,000 | 50,001 – 150,000 | 90,000 – 349,000 |
| 2 | General | 600,001 – 1,500,000 | 150,001 – 500,000 | 350,000 – 1,499,999 |
| 1 | Overview | < 1,500,001 | < 500,001 | < 1,500,000 |
(according to IHO, 2004a and b).
As a result, NOAA’s RNC-First Approach and interaction between usage bands, SCAMIN, and compilation scale created several key issues with NOAA’s current nautical chart products and their distribution (NOAA, 2017):
- Too many alarms on caution areas are shown in ECDIS.
- Uncertainty values associated with “reported,” “existence doubtful,” and “position approximate” dangers are not well defined.
- Limited description of depth areas in key locations that require more detail for the mariner.
- Irregularly shaped ENC cells compiled at over 100 different scales that result with many discontinuities between neighboring charts on the same scale band.
- Current attributes to NOAA chart features are mainly good for SOLAS mariners, but not good for recreational mariners.
3. Re-Scheme Plan for NOAA’S Charting Products
3.1 Standardizing Scales
In order for NOAA’s charts to comply with international standards, NOAA adopted IHO recommended usage bands with two compilation scales in each usage band (Table 1). However, binary-dependent compilation scales were selected for NOAA’s ENCs instead of the compilation scales that are dependent on radar ranges (Table 3). Use of binary dependent scales will simplify the display of charts in ECS displays and different web-services. Also, it is simpler to sample key vertex points when generalizing a larger scale chart to a smaller scale binary-dependent chart. The only difference between the IHO recommended usage bands and NOAA’s usage bands is the scale division between Band 5 (Harbor) and Band 6 (Berthing). NOAA chooses to divide the scales at 1:5,000 instead of 1:4,000. Table 3 shows four common binary scale lists for the transition between large-scale to small-scale charts (i.e., Google Maps scale, 5-10-20, 12-48-96, and 25-50-100). Because of the large number of ENCs (more than 50) currently available at 1:10,000, 1:20,000, 1:40,000, and 1:80,000 scales, the use of the 5-10-20 scale list (NOAA Binary 1 in Table 3) seemed to be most appropriate for NOAA’s new re-schemed ENC scales. As a result, fewer charts will need to be rescaled and compiled to the new binary scale list, i.e., many feature can directly transfer from current NOAA charts into the new re-schemed charts. NOAA is currently focusing on producing continuous coverage of Scale Band 4 along all of the US and its territories (within NOAA’s charting responsibilities), where approaches to ports will be at 1:40,000 scale. Principal ports (based on cargo, fisheries and tourism) will be covered at scale band 5, i.e., 1:10,000 scale or 1:20,000 scale.
| Navigational Purpose | NOAA Adaptation* of IHO Recommended Scale Ranges (1:) | Gmap (rounded) (1:) | NOAA Binary 1 (1:) | NOAA Binary 2 (1:) | NOAA Binary 3 (1:) |
| Berthing* | > 5,000 | 2,250 4,500 | 2,500 5,000 | 3,000 | 3,125 |
| Harbour* | 5,001 – 21,999 | 9,000 18,000 | 10,000 20,000 | 6,000 12,000 | 6,250 12,500 |
| Approach | 22,000 – 89,999 | 36,000 72,000 | 40,000 80,000 | 24,000 48,000 | 25,000 50,000 |
| Coastal | 90,000 – 349,000 | 144,000 288,000 | 160,000 320,000 | 96,000 192,000 | 100,000 200,000 |
| General | 350,000 – 1,499,999 | 576,000 1,152,000 | 640,000 1,280,000 | 384,000 768,000 | 400,000 800,000 |
| Overview | < 1,499,999 | 2,304,000 4,608,000 | 2,560,000 5,760,000 | 1,536,000 3,072,000 | 1,600,000 3,200,000 |
(Lee et al., 2016).
* NOAA divides the scales between Berthing and Harbour at 1:5,000 instead of 1:4,000 as recommended by IHO (see Table 2).
3.2 Improving Charts Schemes
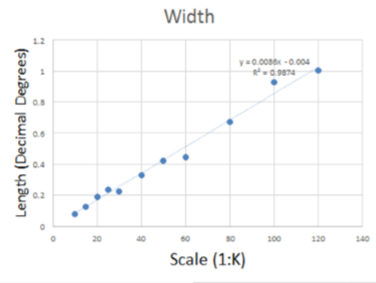
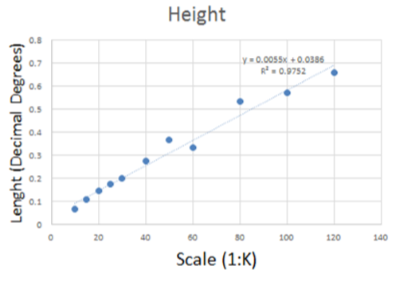
The second element of the plan is the footprint (scheme) of the charts. NOAA and many other HOs built their ENCs by digitizing paper nautical charts in order to get them done quickly and to ensure that the two products matched each other. In the new ENC-First paradigm, it is important to point out that ENCs do not need to follow traditional raster chart limits and are solely limited by the 5 MB ENC file size restriction (IHO, 2000). As such, it is possible to use a gridded system with fixed cell sizes and standardized scales. A statistical analysis of NOAA’s current ENC cells over the continental US showed that the calculated cell boundaries along the width and height are linearly dependent on the scale, i.e., progressively larger scale usage bands cells will nest within the (larger size) smaller scale cells (Figure 1). The reason for excluding Pacific Islands and the State of Alaska was to avoid the introduction of unique small inset island charts and high-latitude charts that contain distortion, respectively. A reference fishnet has been created for each usage band. All re-schemed ENC cell boundaries follow lines of longitude and latitude and will appear rectangular in a Mercator projection. The reference fishnet’s center of reference is at 0°N and 0°E for each of the usage bands, and it is possible to add more ENC cells to the chart suite by copying the footprint from the fishnet for any location on Earth. The geographic ENC size for each usage band was calculated based on data volume restriction of not being over 5 Mb (Table 1).
In the past, each ENC cell was maintained within its own individual database, which made re-scheming ENCs difficult, but now all NOAA ENCs are maintained within a single, seamless database called the Nautical Information System (NIS). The NIS database simplifies many ENC enhancements, such as the edge matching of data on adjacent cells of the same or similar scales, and increasing the conformity of feature compilations on different scale ENCs. ENC footprint dimensions are separated into three geographic zones (Figure 2): low-latitudes (48˚S to 48˚N), mid-latitudes (48˚N to 64˚N) and high-latitudes (64˚N to 80˚N). The separation is based on the distortion at high-latitude caused by the projection used to display the charts. To accommodate this, the width of the ENC cells is doubled from low-latitudes to mid-latitudes, and doubled again from mid-latitudes to high-latitudes. For example, a Band 5 ENC cell’s width is 0.075˚ at low-latitudes, 0.15˚ at mid-latitudes, and 0.30˚ at high-latitudes.
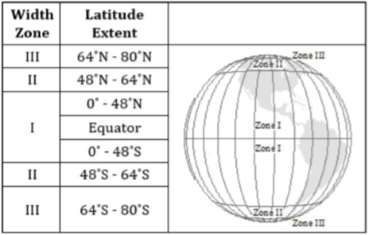
Figure 2. Schematic illustration of the three geographic zones based on latitude for defining the dimension of NOAA’s ENCs
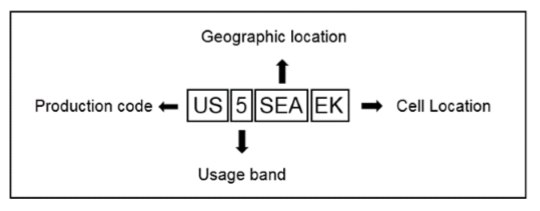
The United Nations Code for Trade and Transport Locations (UN/LOCODE) was used to identify each port by a unique three letter identifier in order to differentiate the US Principle Ports from the rest of the re-schemed ENC cells at the same scale band. The US port list is the official short name in English as referenced in ISO 3166, where the two-letter identifier of the country (i.e., US) were ignored. Thus, the Principle Port ENC cells utilize the three-letter port code for the fourth, fifth and sixth characters. The last two characters are determined by the cell location with respect to a given reference. The southwestern corner of the ENC cell grid is the origin (“AA”), where the seventh and eighth character represents distance from the origin in latitude and longitude, respectively (Figure 2). In non-principle port ENCs, the U.S. state represents the fourth and fifth characters, followed by an integer delineating a zone within the state for the sixth character. The seventh and eighth characters are the cell location with respect to a given reference. The port list was obtained from the UN/LOCODE Code List 2017-1 for each country (current version was published in July 2017): http://www.unece.org/cefact/locode/service/location.html. In cases where there are two or more Principle Ports next to each other, only the three letter UN code of the largest Principle Port will be used for the ENC grid.
3.3 Generalization
NOAA’s generalization rules follow legacy best practices used in RNC production. IHO S-58 (IHO, 2018b) also uses a validation check – “For each edge which contains vertices at a density Greater than 0.3mm at compilation scale.” As such, key generalization rules used in ENC production during the re-scheming process included: 1) minimum vertex density greater than 0.3 mm/scale, 2) double-line features become a single-line feature when the distances between the lines are less than 0.3 mm/scale, 3) and any branch line feature (e.g., pier or a stream) perpendicular to the trunk feature (e.g., shoreline or rivers) and is less than 0.8mm/scale will be omitted from the data. It is important to note that the IHO S-58 refers to the native spatial representation of the ENC features, i.e. is geographic WGS-84. However, ESRI and other GIS software encounter truncation issues with meter-level calculations (six digits after the decimal point). In order to avoid potential GIS algorithms, NOAA validated and generalizes vertex points along the same feature or the distance between two line features using a 0.4mm/scale threshold in a metric projection (e.g., Universal Transverse Mercator) (Table 4). The output is an ENC product in geographic coordinate system with vertex density less than 0.3 mm/scale.
| Scale | Vertex density and singleline threshold (0.4 mm/scale) | Perpendicular line feature threshold (0.8 mm/scale) |
| 1:10,000 | 4 m | 8 m |
| 1:20,000 | 8 m | 16 m |
| 1:40,000 | 16 m | 32 m |
| 1:80,000 | 32 m | 64 m |
| 1:160,000 | 64 m | 128 m |
| 1:320,000 | 128 m | 256 m |
| 1:640,000 | 256 m | 512 m |
| 1:1,280,000 | 512 m | 1,024 m |
| 1:2,560,000 | 1,024 m | 2,048 m |
| 1:5,120,000 | 2,048 m | 4,096 m |
4. Results
4.1 Current production effort
NOAA’s Marine Chart Division (MCD) has worked to address the re-scheming challenge through a series of production steps that are separated by phases. The first edition of a re-schemed NOAA ENC should have an authorization letter that is registered in the MCD tracking system. Following this, production of re-schemed ENCs includes: 1) generalizing shoreline to the appropriate scale, 2) compiling features as function of scale, 3) matching feature edges to ensure connection of contours, shoreline, depth areas, etc., and 4) applying new cell boundaries and chart note files. Furthermore, an Edition one re-schemed ENC should comply with MCD’s current vertex density rules of no more than 200 vertex density warnings for vertices closer than 0.3mm at compilation scale (IHO, 2018b). Phase two of a re-schemed ENC will include updated and recompiled hydrographic contours. The recompilation will take advantage of NOAA’s new National Bathymetric Source (NBS) database, which will assist in the transformation to metric soundings and contours (currently, compiled in feet and fathoms, and converted to meters for ENC production) and ensure that the latest data is applied to re-schemed areas (Rice et al., 2020). The NBS will ensure that the latest data is used to compile the new products while also maintaining proper supersession rules between different survey data sources. The NBS’s automated approach will save countless cartographic compilation hours while improving the data quality of the ENCs. Edition three, the final step in the re-scheming process, will include the addition of topographic contours and feature place names, road networks and other land features. Once edition three is complete, the cell will be in a maintenance mode. Each new edition intends to provide the maximum incremental benefit to the public without having to wait for the entire re-scheming process to be completed.
According to NOAA’s re-scheme plan (NOAA, 2017), NOAA has started its re-scheming effort in the band 4 space in order to produce continuous coverage along all of the US and its territories (within NOAA’s charting responsibilities), Two additional reasons were: 1) the ease of transition due to existing coverage in a corresponding scale, available data (shoreline and bathymetry) for the new coverage, and 2) Approach scale charts at the 1:80,000 serve as a mid-scale product for use in confined bodies of water, and with NOAA’s extended re-schemed coverage can be used for coastal navigation in the electronic environment. Figure 4 illustrates NOAA’s re-scheme plan for the Great Lakes. NOAA has also started working on band 5 coverage in some areas and intends to work on band 3 in the near future. As shown in Figure 5, the MCD is working in several different geographic areas around the country to re-scheme the charts. The main reason for this is to ensure that each of the six regionally-based cartographic teams builds expertise simultaneously while working to demonstrate the benefits to a more regionally diverse set of customers.
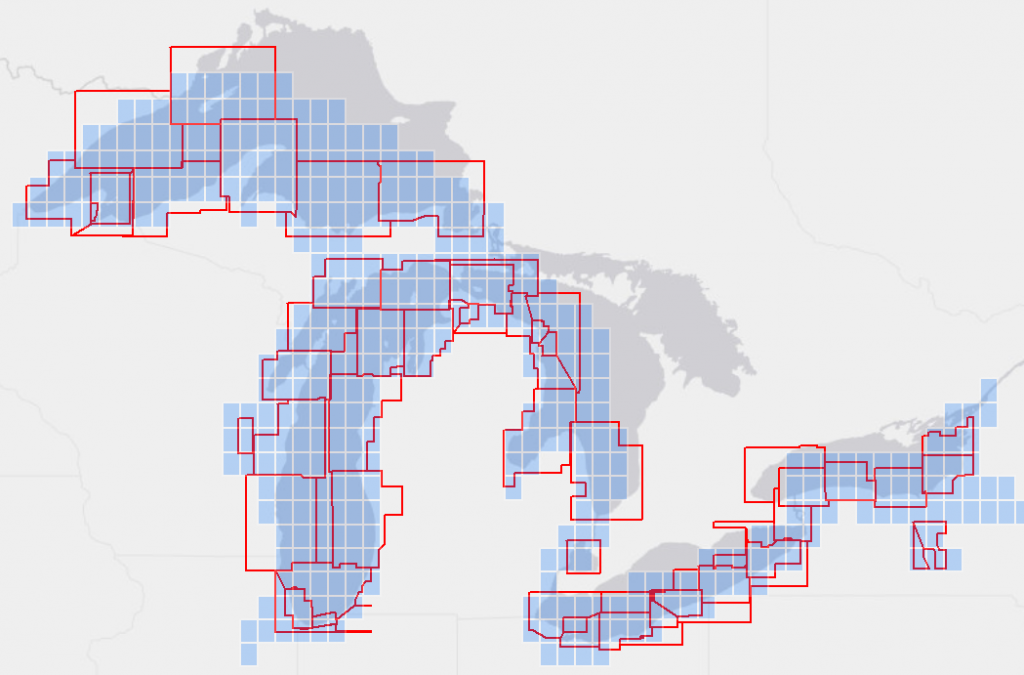
the new re-schemed ENC cells.
4.2 Challenges in production
Coordinating the production and release of a re-schemed chart while ensuring that the mariner has access to a current the pre-re-schemed chart is akin to changing a car tire while the car is moving. Large amounts of data must be applied to both current and new products while the new charts are being built; the old chart must be retired or cut to new extents, simultaneously with the new ENC release, or overlap errors will occur. Additionally, when charts are retired by area (rather than individual cell) communication with the mariner is critical. Other key challenges in production are as follows:
Bathymetry – Applying bathymetry is one of the most challenging aspects of the re-scheming project. NOAA’s aim to apply the most accurate data available while converting the contours to metric requires complete recompilation in many areas. The challenge of finding shore-to-shore coverage that is deemed acceptable to support navigation is frequently impossible and often requires additional data collection. The use of non-traditional means of gathering data, including Airborne LiDAR Bathymetry and Satellite-Derived Bathymetry, are employed. However, this type of data are only useful when the waters are optically clear to detect the bottom at depths deeper than 6 m (Pe’eri et al., 2014). This issue of charted areas lacking bathymetry also presents the challenge of creating larger scale products as part of the re-schemed plan that do not currently exist. Creating approximate, dashed line, contours from smaller scale data to update larger scale chart production (example: 1:40,000 data creating a new 1:10,000 scale chart) is not preferred but is possible. The same approach cannot be used to produce the desired spacing or horizontal accuracy for soundings on larger scale charts. An interim solution of updating chart notes to warn the mariner was coordinated with IC-ENC. NOAA is enthusiastically working on deploying its National Bathymetry Source database (Rice et al., 2020), which is expected to significantly expedite the compilation process by automating data precedent and sounding selection.
Digitized line and polygon features – As mentioned above, most ENCs were digitized from
raster products, resulting in severe over compilation of features, such as shoreline. In many
cases, the vertices are closer than 0.3mm/scale (IHO, 2018b). Another issue is fragmented line features that represent only a single feature. This level of detail is not visible when viewing ENCs at the proper zoom level and requires more effort on an ECDIS to display these features. As such, many charts can receive hundreds or even thousands of S-58 warnings during the chart validation process. In addition, there might be Group 1 (“Skin of the Earth”) errors due to gaps between the depth and land areas. Although there are several automated generalization tools, there is a need for manual editing to reduce these errors and warnings, while also amending
topology of all the Group 1 bounding features that interact with land areas, depth areas, sea areas (e.g., shoreline). As a result, production time is drastically increased for generating ENC
products. Several possible solutions are being tested to reduce the effort of this generalization process, but a final solution has not yet been implemented into the workflow.
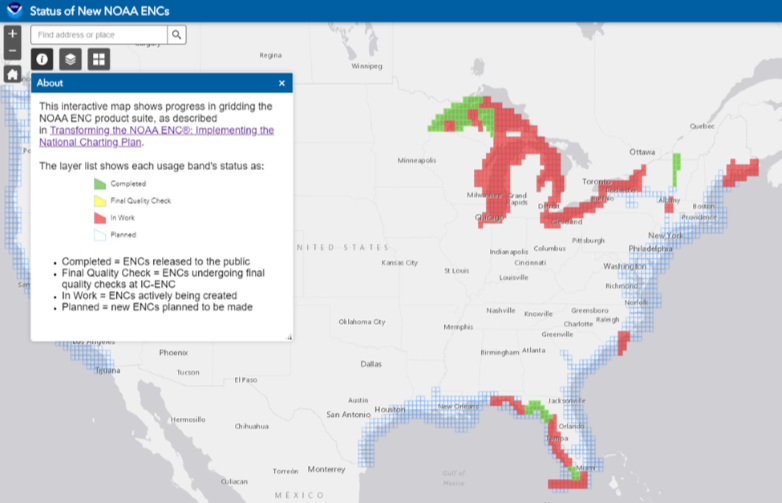
Communication – Although communication with the public and key stake holders has been a challenge, it has been met through a series of internet blog posts and customer interaction through NOAA’s regional navigation managers. NOAA also employs an online “Status of New NOAA ENCs” web map (https://distribution.charts.noaa.gov/ENC/rescheme/) that shows areas where re-scheming is planned, in work, in final quality check or completed. It should be noted that plans for the new ENC scheme are subject to change, and may be modified to meet user needs. The coverage and/or the scale may end up being significantly larger or slightly smaller. The web map will reflect changes to the planned layout as they are made.
5. Discussion
5.1 Rasterization HD Charts
Despite the re-scheme plan described here, raster format charts are still preferred by many mariners. With NOAA’s new plan to standardize a consistent gridded framework that is optimized for digital displays, the question is what is the future of paper charts, or raster images that are used in navigation systems? In order to allow a raster-based maintenance system, it is now possible to translate encoding attributes of vector objects into standardized chart symbols and labels, and therefore simplifying workflow processes for raster chart production (Ence and Pe’eri, 2019). One of the great side benefits of the re-scheming project is that it will significantly improve another charting service that NOAA is providing, the NOAA Custom Chart (NCC) application (https://devgis.charttools.noaa.gov/pod/). The NCC allows users to define their desired footprint for a paper chart and includes customizable settings, such as paper size, scale, and safety contour to name a few. Since the NCC uses the NOAA ENC suite as its base data, the output is greatly improved when the ENC suite is uniform in scale. If, for example, one wishes to produce a chart at 1:40,000, but half of the area covered is only available at 1:80,000, then that portion of the paper output will only show half the level of detail as the area that has the 1:40,000 scale data available. Also, features like depth contours and depth areas may not be aligned or suddenly end. The use of only one or two scales for each usage band throughout the re-scheme effort should resolve these issues.
5.2 Re-schemed products Dissemination
NOAA is a member of the International Centre for Electronic Navigational Charts (IC-ENC). This is a Regional ENC Coordinating Centre (RENC), which supports the IHO Worldwide Electronic Navigational Chart Database (WEND) principles. The IC-ENC validates NOAA ENCs according to the IHO S-58 check list and distributes the chart products. IC-ENC is acutely involved in NOAA’s re-scheming process for a number of reasons: 1.) Validating new, first edition, ENCs takes considerably more effort than validating new editions of existing ENCs. Since every new re-schemed ENC is a first edition chart, the re-scheming workflow has increased the IC-ENC workload considerably. Additionally, these new cells may be created in areas which have not been subject to a new edition for some time, and so there is the opportunity to update content and encoding to reflect the latest “best practice”; 2.) IC-ENC carries out a vital function in coordinating the exchange between new and old cells. This RENC maintains a critical part of the communi-cation chain during a cell re-scheming. This ensures that mariners on the bridge of a ship are provided with a seamless coverage, and the ‘old’ is replaced by the ‘new’; 3.) The new chart scheme dramatically increases the number of ENCs in the US suite (Figure 4). While this increases safety, among other things, it also increases the cost of management due to the complexity of accounting (i.e., storage space, coordination, and distribution management, such as supply and user permit generation). As part of the re-scheme workflow, NOAA provided resources and personnel to coordinate the communication with IC-ENC to maintain a steady, secure production line that can reliably deliver the latest data to ships operating in US ports.
6. Conclusions
NOAA’s “ENC-First” initiative includes a multi-year re-scheming project that will result in a seamless, grid based coverage that can easily be segmented or extended based on geographic location, available data and scale. A new naming convention will be used for the re-schemed cells, retiring the old names associated with the raster-based ENC cells. NOAA has started by re-scheming the band 4 space in order to produce continuous coverage in the US and its territories (within NOAA’s charting responsibilities). Additional band 5 coverage re-scheming
efforts will be conducted in key U.S. ports, but in the future, NOAA expects to work to complete large regional areas in all usage bands, as it works around the country. During the project’s initial period, NOAA is working through multiple challenges along the production pipeline that include: manual work generalizing line and polygon features (e.g., shoreline and inland water bodies), gaps in bathymetry due to the compilation of larger-scale products from smaller-scale sources, and more effort in conducting validation for new ENC cells. However, the expected result will allow for many automated cartographic processes that are currently manual and provide updates to charts through the scales in a much faster time. The end goal is provide seamless sets of uniform data throughout US waters that will improve electronic navigation through uniform coding practices and standard scales while also greatly improving the ability to produce customizable charts for printing using ENC data as source.
7. References
– Ence, C., and Pe’eri, S., 2019. From pen and ink charts to ENC-First: Deriving Raster
Products. US Hydro 2019, Biloxi, MS, U.S.A., March 19-21.
– International Hydrographic Organization (IHO) (2000). IHO Transfer Standard for Digital
Hydrographic Data. 3.1 Edition, IHB, Monaco.
– IHO (2002). Minutes of 9th TSMADWG meeting, October 2002, IHB, Monaco, www.iho.shom.fr (1. 6. 2005.)
– IHO (2003). Minutes of 10th TSMADWG meeting, October 2003, International Hydrographic Bureau, Monaco,
– IHO (2004a). Recommendation for Consistent ENC Data Encoding, www.iho. shom.fr/COMMITTEES/CHRIS (1. 6. 2005.)
– IHO (2004b). Improving IC-ENC Consistency, CL 47/2004, www.iho.shom.fr (1. 6. 2005.)
– IHO (2018a). S-66 Fact about electronic charts and Carriage requirements
– IHO (2018b). ENC VALIDATION CHECKS, Publication S-58Edition 6.1.0, September 2018
– International 1 IMO amendment to Safety of Life at Sea (SOLAS) Chapter V regulation 19.2.
– Leder, 2007. Specificity of ENC Data Representation on an Archipelagic Sea Area –
Example of the East Coast of the Middle Adriatic Sea Area. TransNav 4(1).
– Lee, Y., Kwon, P., Yu, K., and Park, W., 2016. Method for Determining Appropriate
Clustering Criteria of Location-Sensing Data, International Journal of Geo-Information 5(9):151. DOI: 10.3390/ijgi5090151
– NOAA, 2017. National Charting Plan: A Strategy to Transform Nautical Charting. Office of Coast Survey technical memo for public comments, November 1, 2017. https://nauticalcharts.noaa.gov/publications/docs/ENC-Transformation.pdf
– NOAA, 2020. Transforming the NOAA ENC®: Implementing the National Charting Plan.
Office of Coast Survey implementation plan for public comments, November 7, 2019.
– United Nations Conference on Trade and Development (UNCTAD) (2017), “Structure,
ownership and registration of the world fleet”, in Review of Maritime Transport 2017, UN, New York, https://doi.org/10.18356/56ee8449-en.
– Pe’eri, S., Parrish, C., Azuike, C., Alexander, L., and Armstrong, A., (2014), Satellite
Remote Sensing as a Reconnaissance Tool for Assessing Nautical Chart Adequacy and Completeness, Marine Geodesy, 37:3, 293-314.
– Pharaoh, T., The Present Status of Small Scale ENC Coverage with Respect to the
Allocation of cells to Usage Bands 1 (Overview) and 2 (General). Rotterdam, Netherlands,
5-9 November 2007, CHRIS19-06.1E
– Rice, G., Wyllie, K., Brennan, R., Koprowski, C., Wolfskehl, S., and Burnett, Z., 2020. The National Bathymetric Source, Canadian Hydrographic Conference 2020, Quebec City,
Canada, 24-27 February. https://nauticalcharts.noaa.gov/publications/docs/national-charting-plan.pdf
8. Authors Biographies
John Nyberg is the Deputy National Hydrographer at NOAA’s Office of Coast Survey. Nyberg’s previous positions at NOAA include chief and deputy chief of the Marine Chart Division from 2010 to 2020, where he directed Coast Survey’s chart modernization to digital products, changing the operational focus from paper-based chart compilation to electronic navigational charts. Prior to his work in the Marine Chart Division, Nyberg spent 12 years in Coast Survey’s Navigation Services Division, moving from United States Coast Pilot ® cartographer to deputy division chief where he managed the procurement of the research vessel Bay Hydrographer II and initiated the modernization of the Coast Pilot’s production system.
Nyberg has a bachelor’s degree from the University of Florida, with a major in geography, a master’s in international management from the University of Maryland, and is currently working on a PhD in geographic science at George Mason University. He is presently living in Key West, Florida.
Dr. Shachak Pe’eri is the currrent Division Chief of Coast Survey Development Lab at NOAA. Dr. Pe’eri’s previous positions at NOAA, included Branch Chief of the Chart Standards Group and Chief of the Cartographic Support Branch within the Marine Chart Division. Dr. Pe’eri earned his PhD in Geophysics from Tel Aviv University, Israel. Dr. Pe’eri is also affiliated with Center of Coastal and Ocean Mapping (CCOM), University of New Hampshire (UNH), NH USA and George Mason University, VA, USA.
Colby Harmon is a staff cartographer and project manager in the National Oceanic and Atmospheric Administration’s Office of Coast Survey. Previously, he worked at the National Geospatial-Intelligence Agency and its predecessor organizations. He has been involved in developing and maintaining specifications for several digital map and chart products and their symbolization throughout his career. He received a Bachelor of Arts degree in Geography from the University of Connecticut and a Masters of Science in Strategic Intelligence from the U.S. Joint Military Intelligence College. Prior to obtaining his undergraduate degree, Mr. Harmon served in the U.S. Air Force as a geodetic surveyor.
LTJG Sydney Catoire serves as the Project Manager and Technical Chair for NOAA’s Office of Coast Survey, Marine Chart Division (MCD) ENC Rescheme Team. LTJG Catoire was appointed to the NOAA Commissioned Corps in July 2016 and served two years aboard NOAA Ship Thomas Jefferson prior to working in MCD. In addition to the Rescheme Team, LTJG Catoire serves as the U.S. representative on the International Charting Coordination Working Group for the South West Pacific Hydrographic Commission and received the S-8 Category B, IHO Certification in Cartography.