


Abstract
1 Introduction
Photogrammetry is the technology for extracting precise and reliable 3D information from image data. Photogrammetry uses image analysis techniques for the automation of image measurement tasks, combined with strict geometric and stochastic modelling for optimizing solutions, both in precision and reliability. Besides image data, photogrammetry also works with 3D point clouds and full-waveform data obtained from light detection and ranging (LiDAR; or laser scanning) techniques. The research in photogrammetry at TU Dresden is focused on the integration of sensors and processing algorithms for the development of efficient solutions to novel challenging measurement tasks.
In general, cameras as sensors offer the inherent advantage of acquiring highly resolved spatio-temporal data, allowing for measurements simultaneously at many locations in an image at an almost arbitrary temporal resolution. The amount of spatio-temporal data generated by a photogrammetric sensor system in environmental monitoring tasks will usually necessitate the development of task-specific fully automatic data processing schemes, which may – depending on the needs of the application at hand – run online in real-time or offline in a batch process. Photogrammetry has developed a wide range of image analysis techniques over the past decades, with artificial intelligence (AI) techniques recently playing a rapidly increasing role especially in tasks such as image segmentation.
Besides their advantage of providing spatio-temporally resolved data, digital cameras also offer themselves as environmental monitoring sensors as they have become rather inexpensive over the past decades, with a wide choice of outdoor-suited peripheral devices being available as well. Increasingly, this also holds for LiDAR sensors, where solid state LiDAR systems for instance find lucrative markets in automotive autonomous driving, thus also creating mass markets. Using state-of-the-art subpixel accuracy image measurement techniques, combined with photogrammetric techniques for thorough geometric sensor modelling and camera calibration (Luhmann et al., 2016), even simple cameras may show a surprisingly high measurement accuracy potential.
In this paper, we give a tour through some recent research and development projects at our institute, showing the potential of photogrammetric techniques in hydrographic environmental monitoring. The application fields include river monitoring (Sections 2–5), photo- and LiDAR-based bathymetry (Sections 6 and 8), uncrewed aerial vehicle (UAV)-based turbidity analyses (Section 9) as well as a glacier lake outburst flood early warning system (Section 7). All projects briefly shown in the following have in common, that they use stationary or moving cameras or LiDAR sensors, which acquire time sequences of images or 3D point cloud data to monitor slow or fast environmental processes related to hydrography. Automation in precise and reliable data processing is a further commonality. Obviously, such a paper can only give a glimpse into the research and application field, without any claim of completeness or representativeness.
2 Automated hydrological monitoring using computer vision and photogrammetry
A primary application of modern technologies in hydrology is the detailed monitoring of riverine systems. This involves the acquisition of water levels, flow velocities, and discharge rates to enable rapid and effective disaster response and improve flash flood forecasting. Traditional gauging stations are often cost-prohibitive and labour-intensive, leaving smaller catchments unmonitored. This has made the development of cost-effective, camera-based solutions particularly attractive (Krüger et al., 2024).
2.1 Machine learning and data augmentation
Central to automated water level determination is the use of artificial intelligence (AI), specifically convolutional neural networks (CNNs). Models such as UPerNet, STCN, and the Segment Anything Model (SAM) are employed for the automated detection and semantic segmentation of water surfaces from camera imagery (Blanch et al., 2025a, Zamboni et al., 2025). These networks are trained to differentiate between water and non-water regions. AI models are trained using diverse datasets, such as the RIWA (River Water Segmentation) dataset (Wagner et al., 2023). These datasets comprise images of various water bodies, captured with different cameras, and under varying resolutions, qualities, times of day, and seasons. This diversity is crucial for ensuring the models’ robustness and transferability to novel, unobserved rivers and locations, thereby preventing overfitting.
To enhance the models’ resilience to diverse environmental conditions, including varying lighting, shadows, reflections, fog, rain, or snow, data augmentation strategies are applied. These include geometric transformations (e.g., rotation, scaling, distortion) and radiometric transformations (e.g., brightness, contrast, artificial fog or snow). A distinction is made between offline and online augmentation strategies (Wagner et al., 2023). Offline augmentation involves pre-manipulating and storing images before training, which can be advantageous for small datasets. Online augmentation occurs “on the fly” during training, and is especially beneficial for larger datasets as it can theoretically generate a much greater volume of data without a significant increase in storage requirements.
2.2 Photogrammetric reconstruction and georeferencing
The accurate transformation of image-based measurements into object-space requires geo-referenced, high-precision 3D models of the monitoring site and the riverbed (Eltner et al., 2021). Furthermore, for georeferencing the hydrological models, ground control points (GCPs) are usually installed and surveyed using total stations or global navigation satellite system (GNSS) as these points serve to orient the camera system within a global coordinate system and transform image measurements into the object space. A significant advancement is a new AI-based algorithm for the automated detection of GCPs in camera imagery (Blanch et al., 2025b). This algorithm, which leverages bounding box and keypoint detection, allows for the automated re-identification of marked points. This enables the re-determination of the camera’s position for each frame using a spatial resection, thereby reducing measurement inaccuracies caused by camera instability (e.g., from wind). The method exhibits high robustness to variations in camera properties, GCP geometry, and environmental conditions, achieving sub-pixel accuracy across various tested datasets. This development minimizes manual effort and accelerates the processing of large image time series. Note that temperature variations can influence a camera’s internal geometry, leading to measurement inaccuracies (Elias et al., 2019), necessitating regular on-site calibration or self-calibration. Recent advances in image-to-geometry registration potentially enable the usage of the 3D model only for image pose estimation, even allowing for interior camera calibration if sufficient matches are found well-distributed throughout the image (Elias et al., 2023), making the camera-based water level observation very flexible and robust. Camera-gauges can now be run across several years with cm-accurate water surface height measurements (Blanch et al., 2025a).
2.3 Flow velocity and discharge rate determination
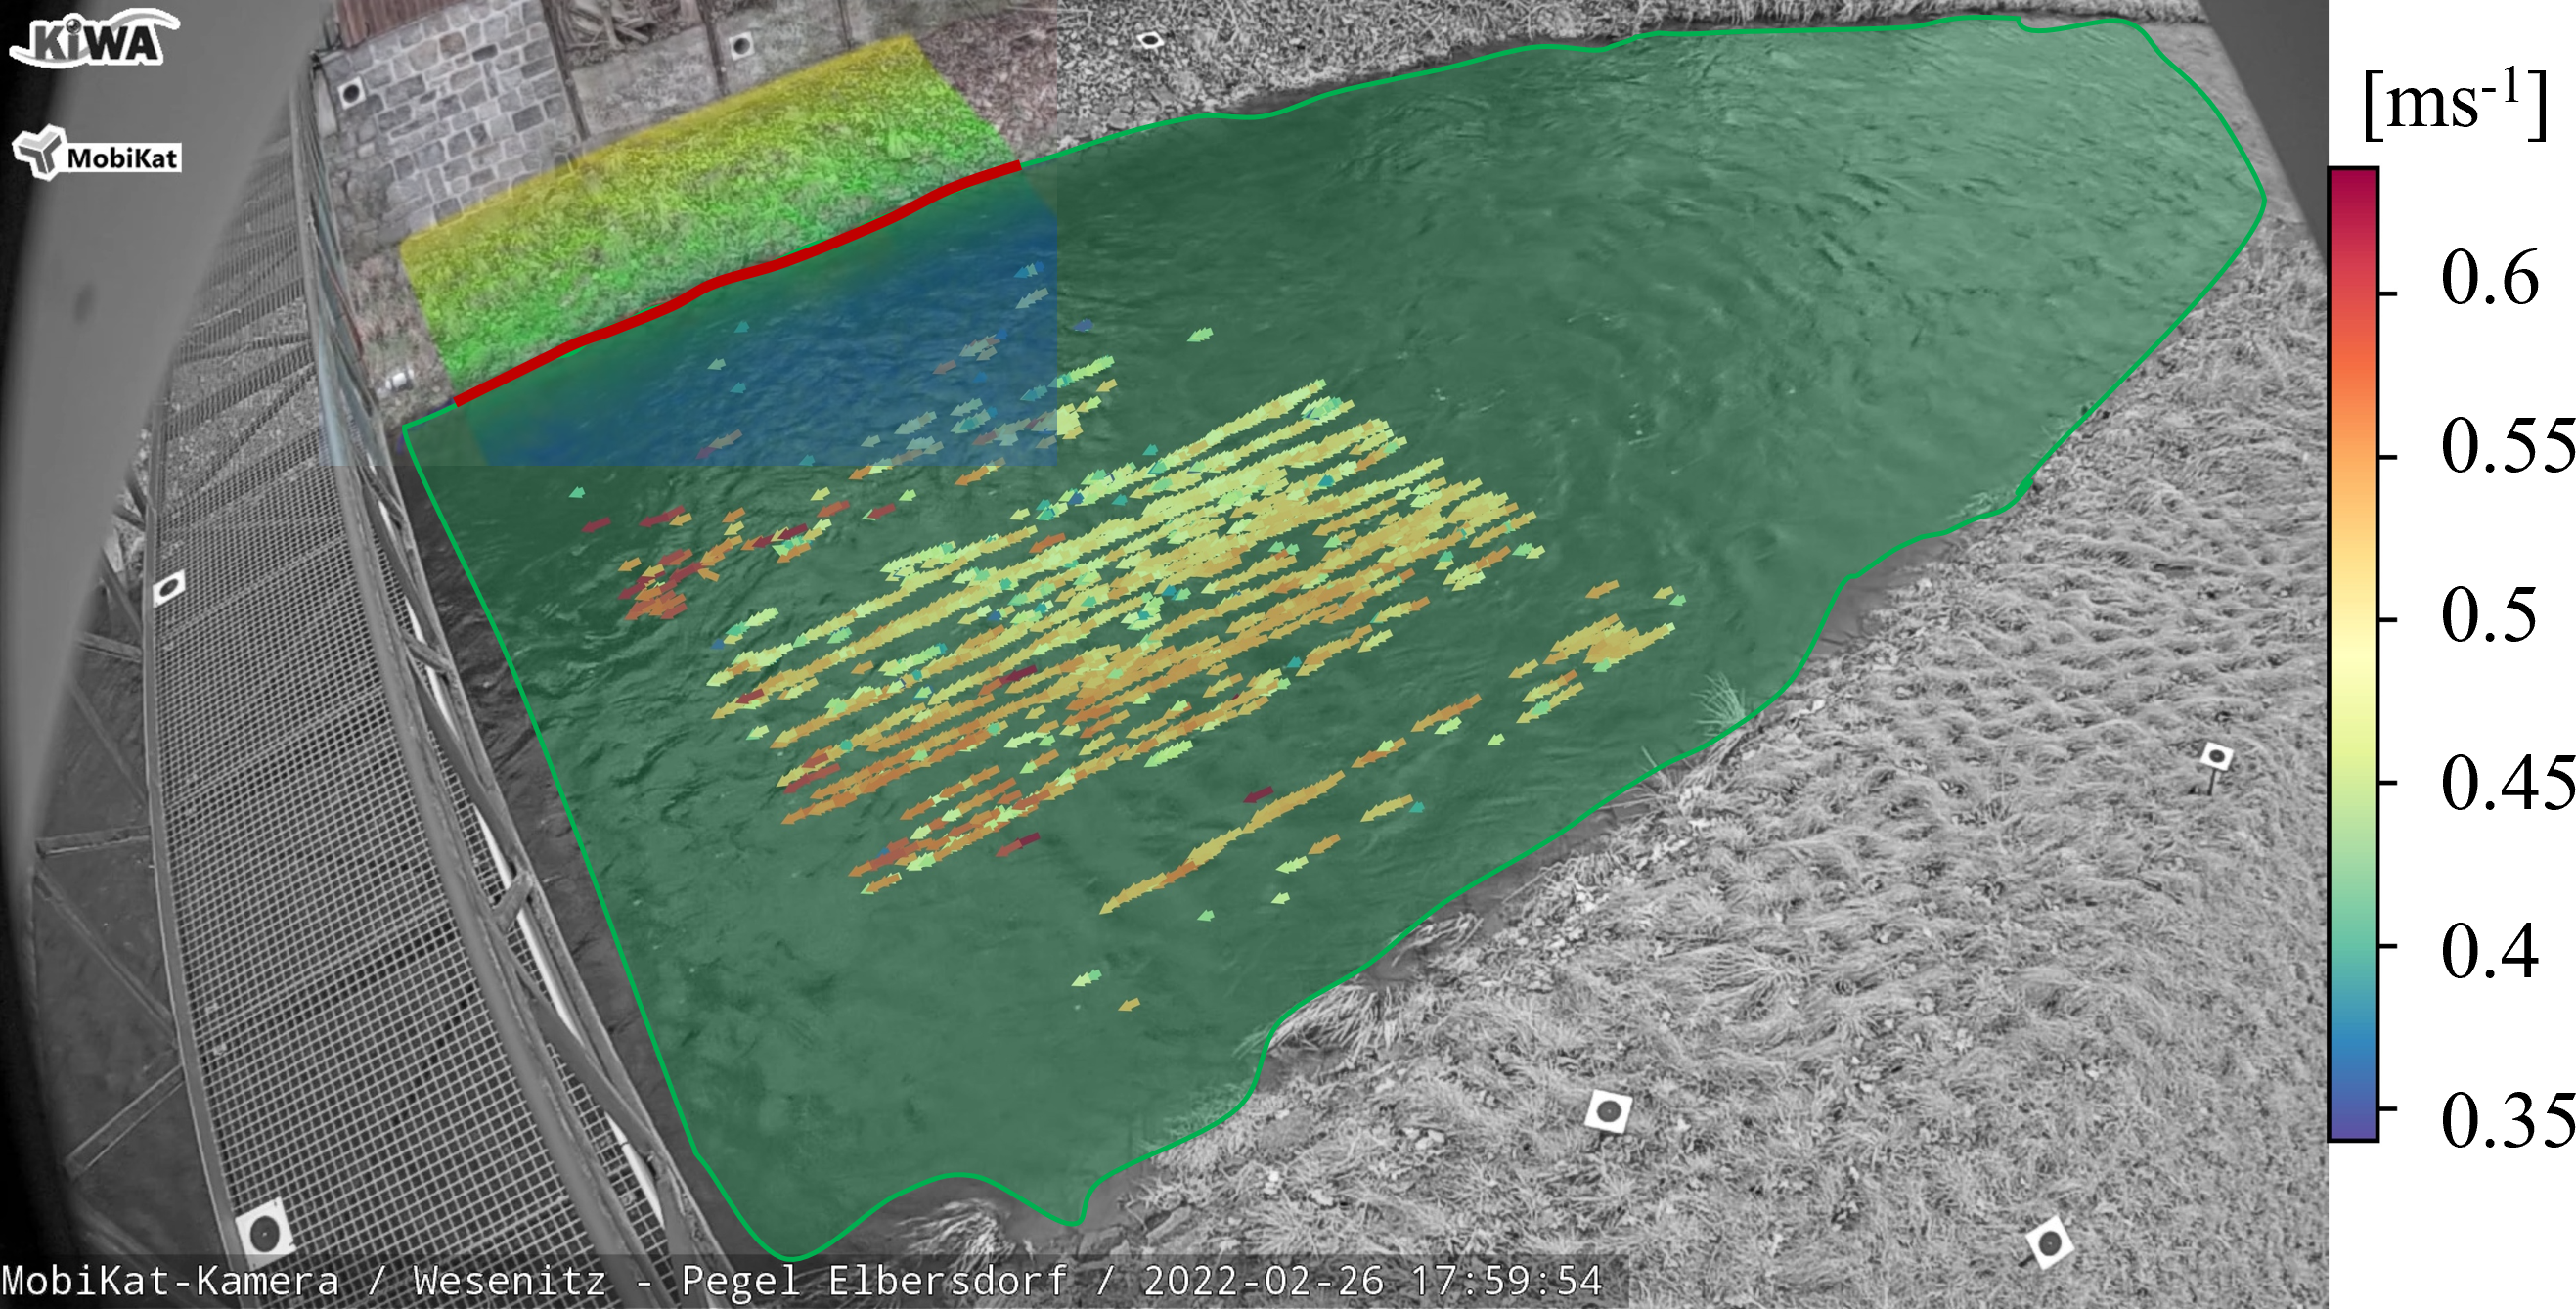
In addition to water level, the acquisition of flow velocities and resulting discharge rates is critical for hydrological monitoring. For surface flow velocity determination from short video sequences, e.g., the Particle Tracking Velocimetry (PTV) method can be used (Eltner et al., 2021a). PTV’s accuracy depends on the presence of traceable particles and prevailing lighting and visibility conditions. To obtain continuous discharge hydrographs under challenging conditions, the novel statistical model “OptiQ” was developed (Grundmann et al., 2024). This method learns from past measurements to fill data gaps in the surface velocity distribution, which may arise from a lack of particles. Discharge is estimated by multiplying the wetted cross-sectional area (derived from the optically determined water level and the terrain model) by the surface velocity. However, accurate discharge determination requires a correction factor to convert from the mean surface velocity to a depth-averaged velocity, which is ideally determined through comparative measurements, e.g., from acoustic doppler current profilers (ADCPs). Furthermore, minor errors in water level measurement can lead to significant deviations in discharge.
The developed methods demonstrate compelling accuracies: water level measurements are within the centimetre range, with root mean squared errors (RMSEs) of 1.3 cm to 3.0 cm for daily values over two years (Blanch et al., 2025a). Surface flow velocity measurements often exceed 90 % accuracy (Eltner et al., 2020). Discharge estimations for regular cross-sections show maximum errors of 4 % to 5 %, and the OptiQ approach achieved a RMSE of 0.045 m³/s (Grundmann et al., 2024).
3 Long-term monitoring of riverbank dynamics using low-cost stereo cameras
Riverbanks are inherently dynamic landscapes, shaped continuously by hydrological and geomorphological processes. Understanding these changes is critical, as riverbank erosion can have significant ecological, social, and economic consequences. Conventional monitoring approaches, however, are often resource-intensive and limited in duration, restricting the ability to capture long-term dynamics. To address these limitations, we explore a low-cost, automated approach for sustained, high-resolution observation.
Over a five-year period, a system of four stereo cameras was deployed at the Pulmanki River in Lapland, Finland, capturing images at two-hour intervals (Lotsari et al., 2020). While the hardware setup is relatively simple, the resulting image datasets serve as a foundation for sophisticated photogrammetric processing. Through Structure-from-Motion and Multi-View-Stereo techniques, the imagery is transformed into 4D point clouds, providing a continuous representation of the riverbank in both space and time.
3.1 Capturing change in four dimensions
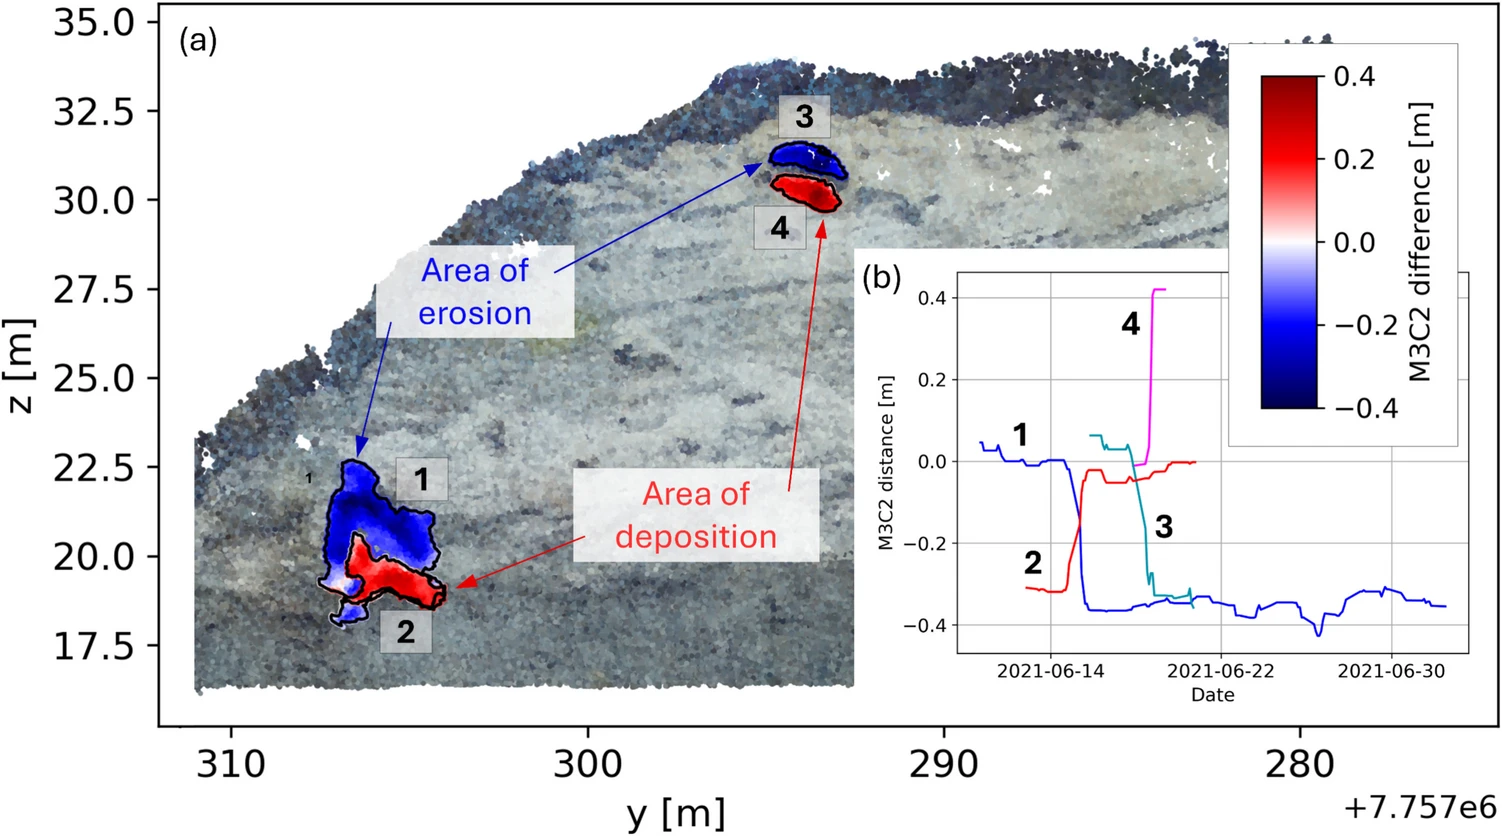
The transformation of raw images into actionable data relies on the 4D Objects-by-Change (4D-OBC) framework (Anders et al., 2021). This methodology enables the identification and characterization of morphological changes by integrating temporal and spatial information. The workflow includes multi-temporal point cloud reconstruction with AI-assisted georeferencing (Blanch et al., 2025), precise co-registration through ICP alignment, and computation of surface differences using M3C2 distances (Lague et al., 2013). Temporal smoothing reduces stochastic variability (Eltner et al., 2017), and trend analysis identifies areas of significant morphological evolution (Fig. 2; Ulm et al., 2025). Finally, fusion of 4D-OBC results consolidates spatial and temporal information, improving the resolution and reliability of detected changes.
This approach allows the riverbank’s morphology to be tracked continuously, revealing patterns of erosion, deposition, and structural transformation. By generating detailed 4D point clouds, the system facilitates quantitative analyses of volumetric change, spatial extent, and temporal progression of landscape evolution. Moreover, visualizations such as color-coded 4D-OBCs and time series of high-amplitude change points provide intuitive yet rigorous depictions of morphological dynamics.
3.2 Capabilities and applications
The system offers a robust platform for long-term environmental monitoring. It enables continuous, high-frequency observation of riverbanks without extensive fieldwork, making it suitable for remote or inaccessible locations. By combining low-cost hardware with advanced 4D analysis, it supports scalable and repeatable monitoring of landscape dynamics. Beyond riverine environments, this approach holds potential for applications across geomorphology, environmental change studies, and habitat monitoring, wherever detailed spatiotemporal analysis of morphological evolution is required.
In essence, the integration of low-cost stereo cameras with 4D change detection transforms simple image acquisition into a comprehensive, long-term monitoring capability, allowing researchers to observe, quantify, and interpret landscape evolution with unprecedented temporal resolution.
4 River monitoring by an uncrewed water vehicle
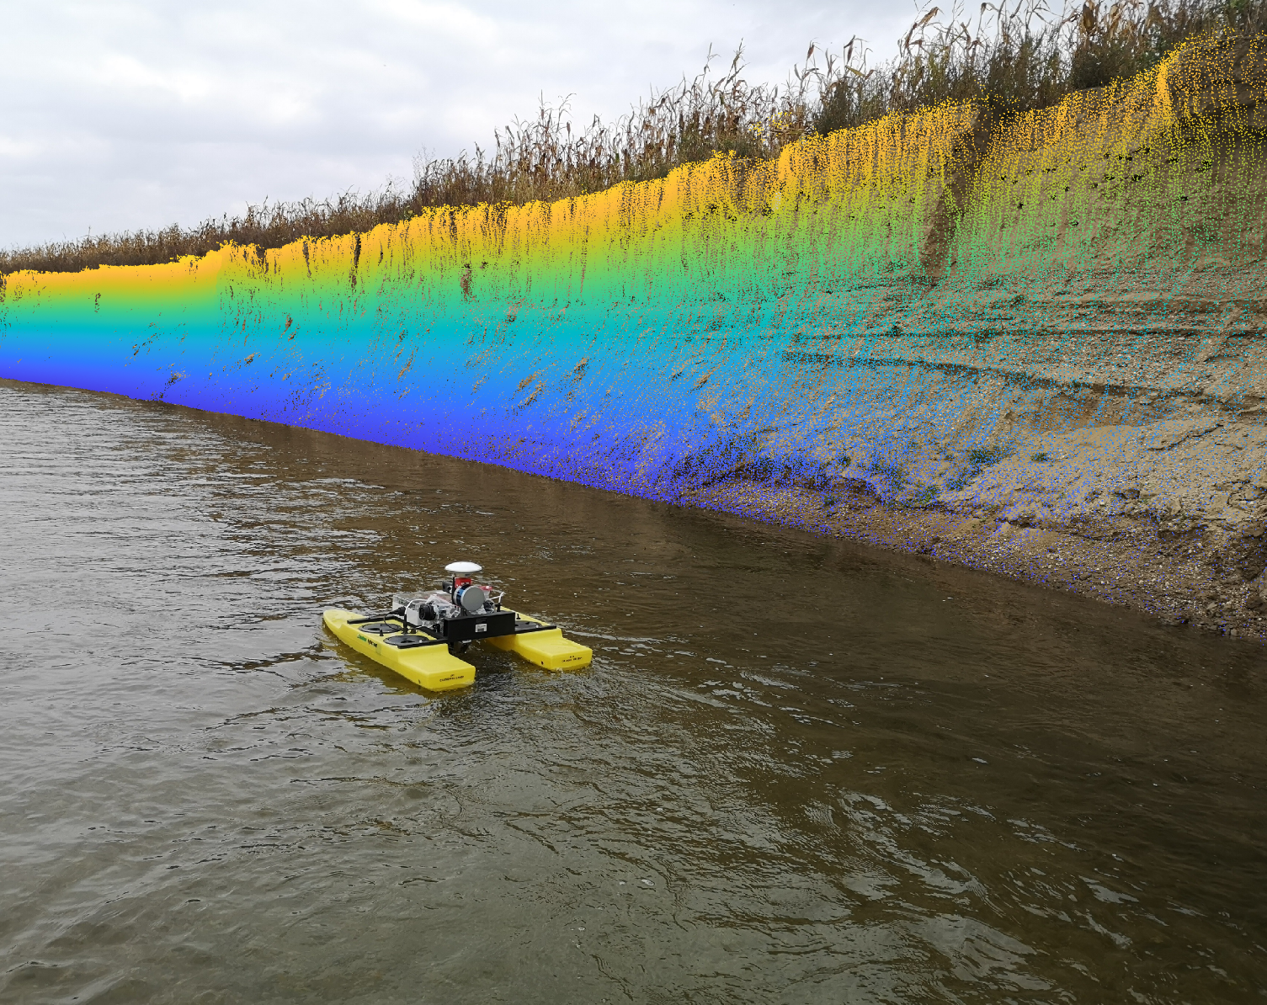
When it comes to the monitoring of water bodies that are surrounded by vegetation, optical airborne systems are often limited in their vision. This can be overcome by using a multi-sensory uncrewed water vehicle (UWV; Fig. 3) that operates underneath the vegetation.
UWVs are autonomous or remote-controlled sensor platforms, that are especially useful in small, hazardous or remote water bodies, where crewed vessels cannot be utilized. Castano-Londono et al. (2024) give a systematic review on existing platforms and evaluation algorithms. The following paragraphs will present our UWV and the type of data that can be recorded with it.
4.1 Navigation
Positioning of the UWV in world coordinates is solved with a multi-band-multi-constellation GNSS receiver. Orientation is determined by an IMU, which is also (single-band) GNSS-aided. Since the intended application fields are water bodies, often surrounded by vegetation, occlusion and multipath form a demanding challenge for satellite-based positioning. It may therefore be beneficial to use the camera images for positioning (Sardemann et al., 2023).
The UWV is built as a modular system with a Raspberry-Pi computer based on-board recording system. The central control unit serves mainly the tasks of starting the recording with dedicated commands to the respective sensor and to receive and log the sensor data. It also ensures the synchronisation of most of the sensors (see below). However, evaluation of the data is done in post processing.
4.2 Above water
Recording of the bank or shore areas is done by LiDAR and camera. The UWV can be equipped either with a panoramic dual-fisheye camera, that observes both riverbanks simultaneously when steered on a river (Sardemann et al., 2018). Using a panoramic view has the advantage that high overlap is achieved between the images, while its drawback is the limited image quality. Alternatively, the UWV can be equipped with one or multiple central-projection cameras with better optical quality (Sardemann et al., 2023). The active LiDAR generates detailed 3D point clouds of the river bank areas (Sardemann et al., 2023).
4.3 Under water
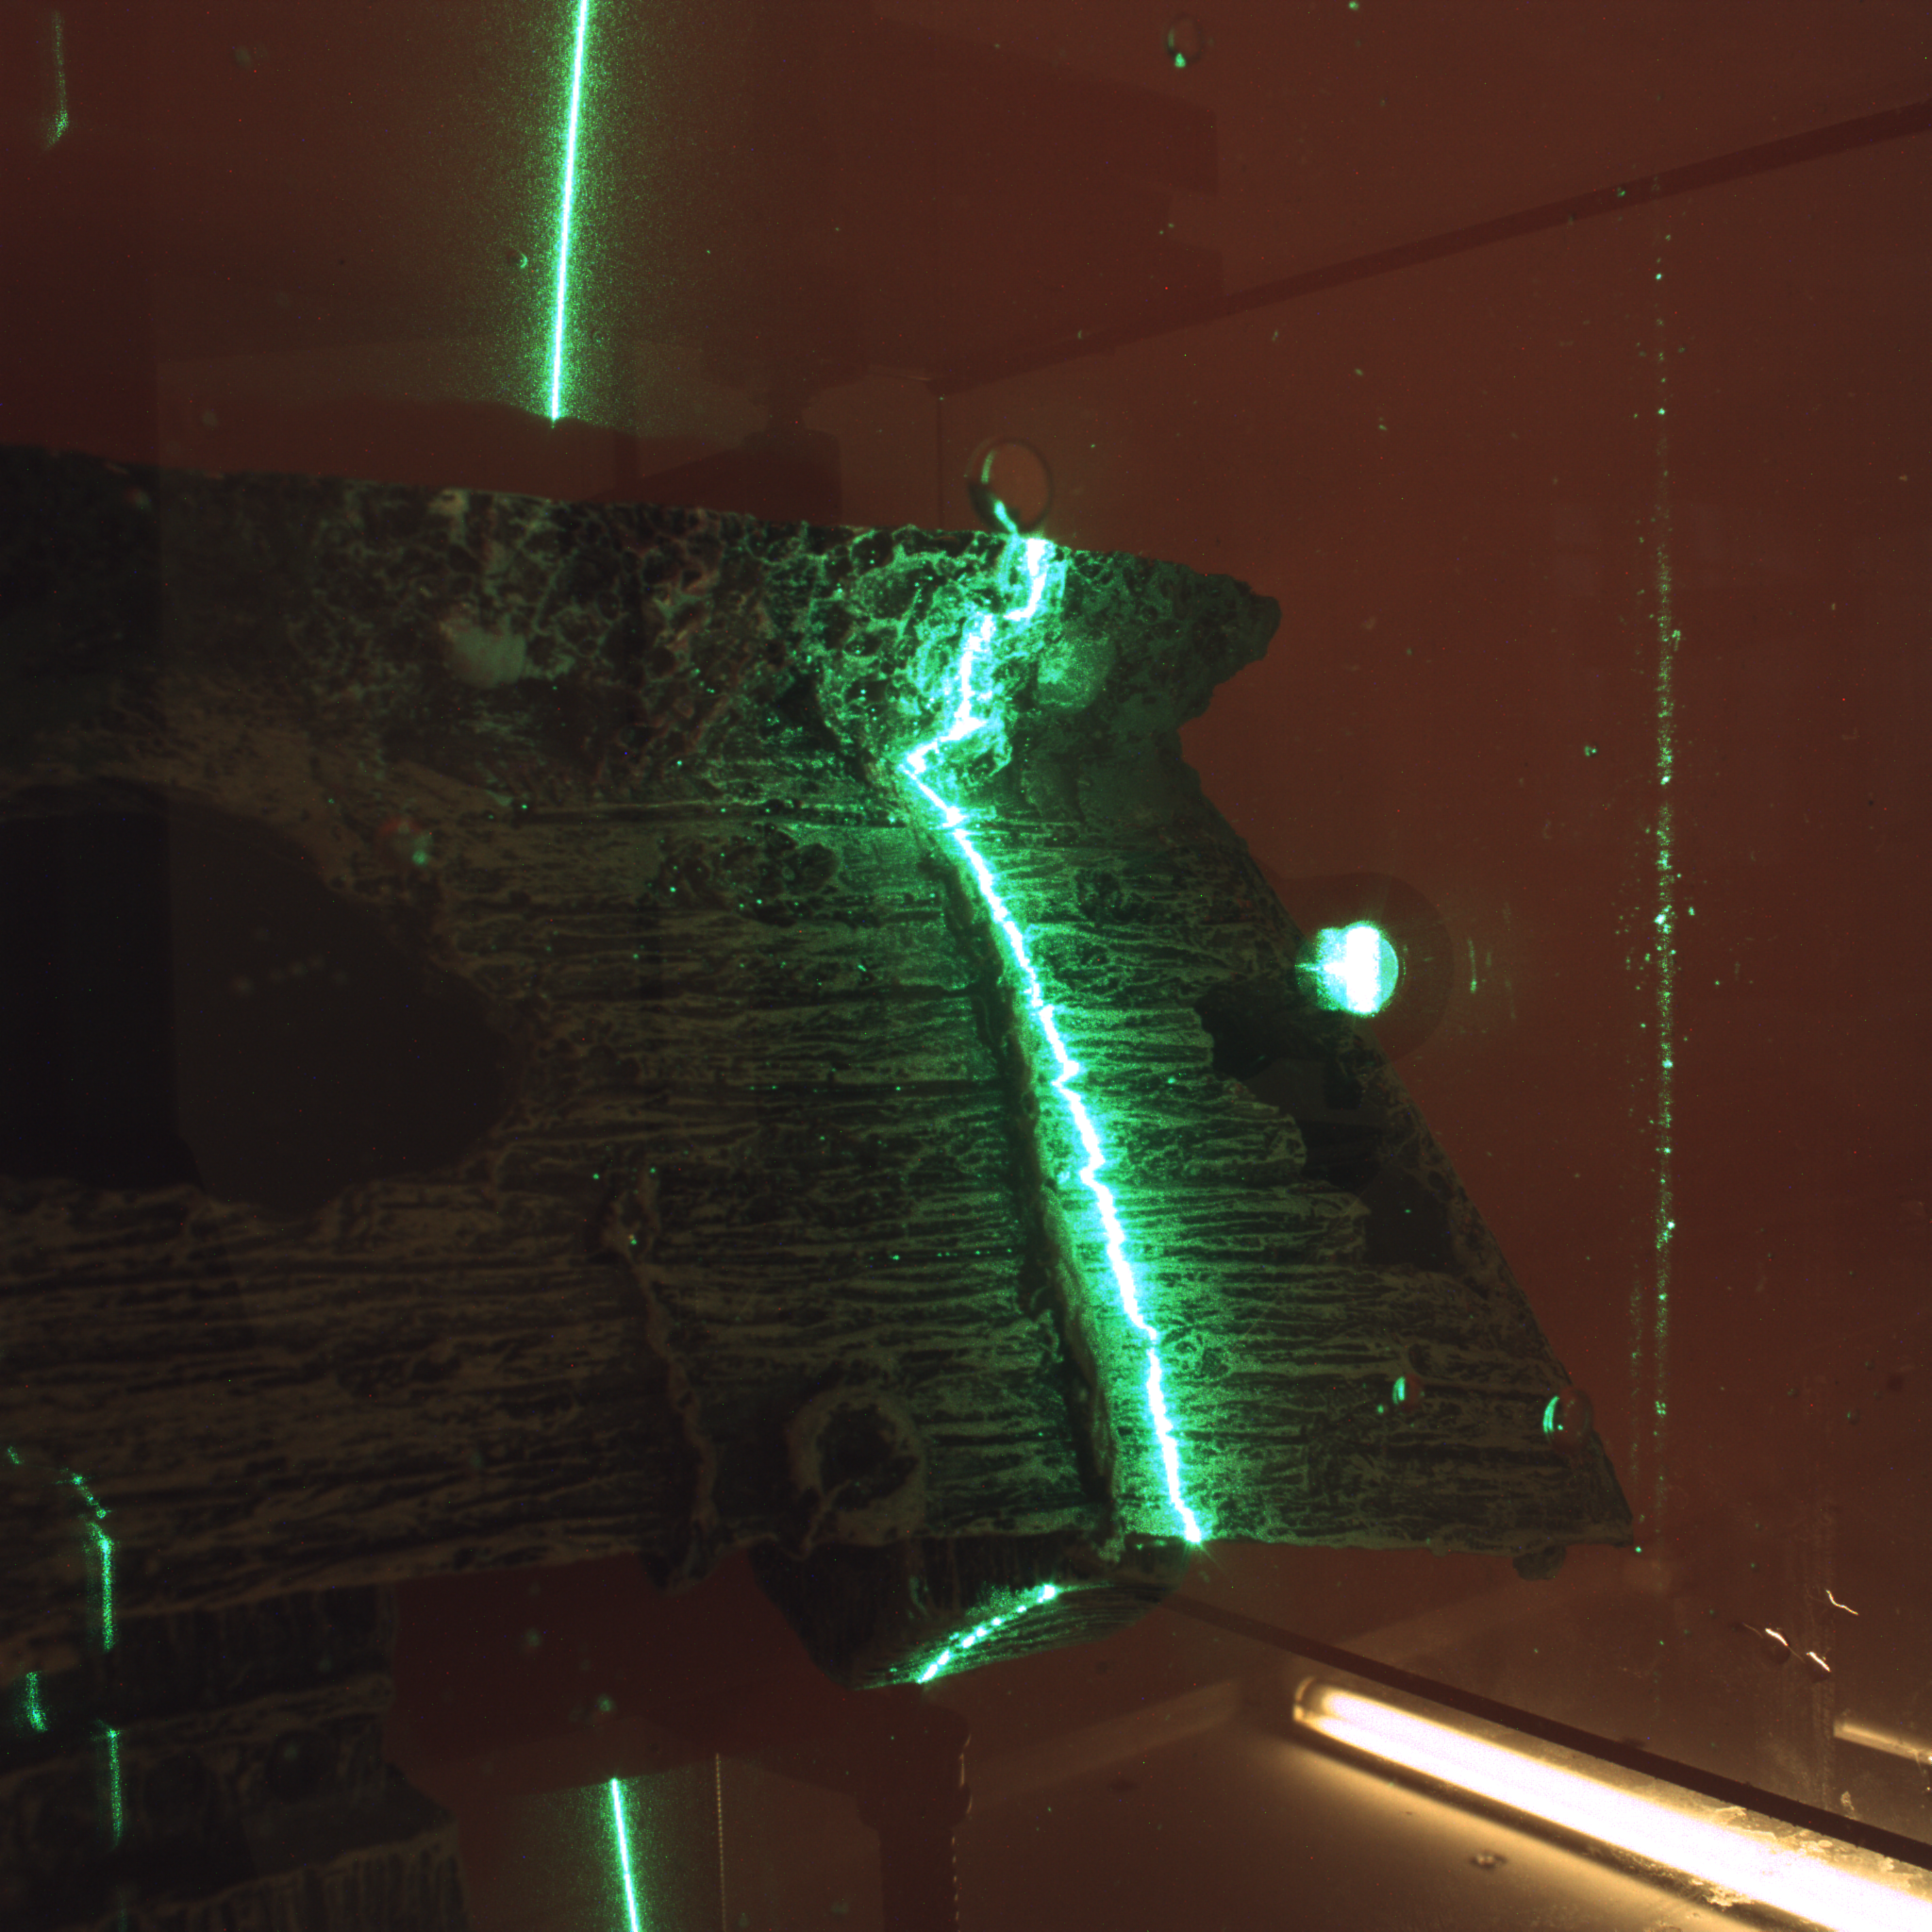
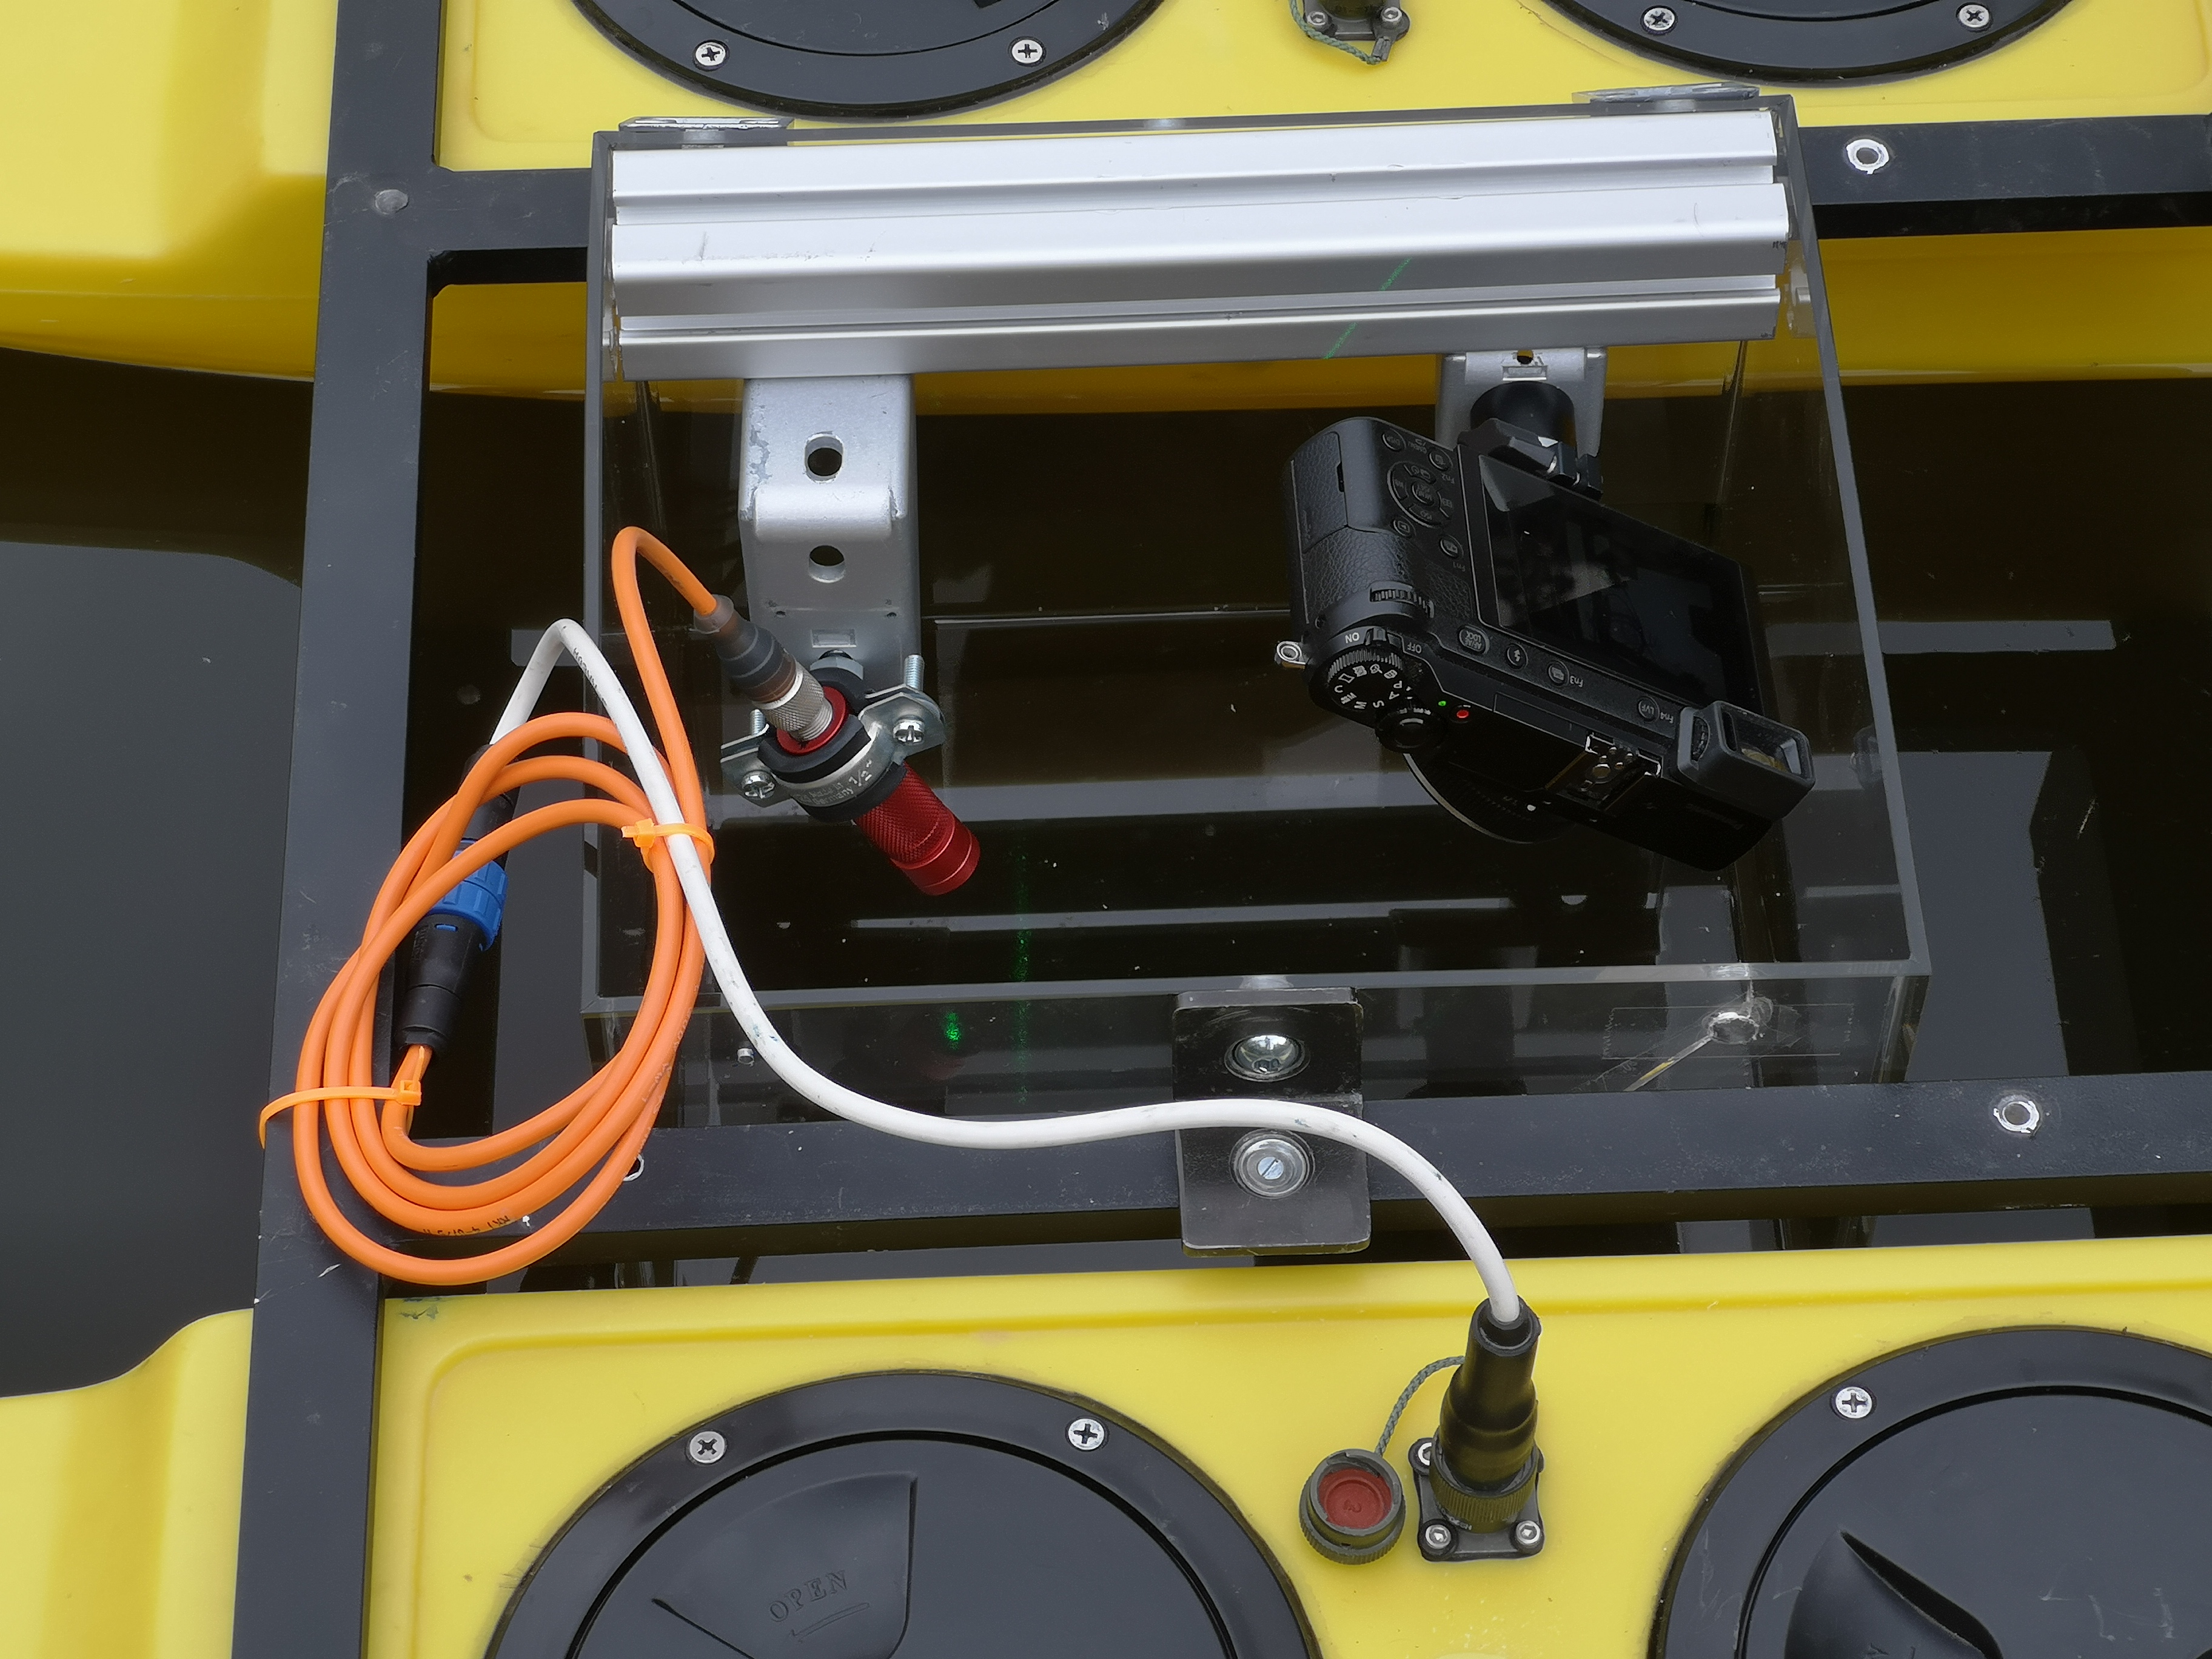
The UWV is equipped with a single-beam echo sounder, enabling the bathymetric measurement of a river (Sardemann et al., 2018) or a lake (Mader et al., 2024) applying adopted navigation and interpolation strategies. However, echo sounders are limited especially in very shallow waters. We therefore developed an optical measurement system, that delivers sub-mm accurate depths in the range of a few decimetres. The sensor system follows the principle of laser triangulation, but considers the influence of refraction to depth calculation (Sardemann et al., 2022). The system has so far thoroughly been tested in laboratory environments, and its suitability on the UWV was also proven (Fig. 4).
4.4 Calibration strategy
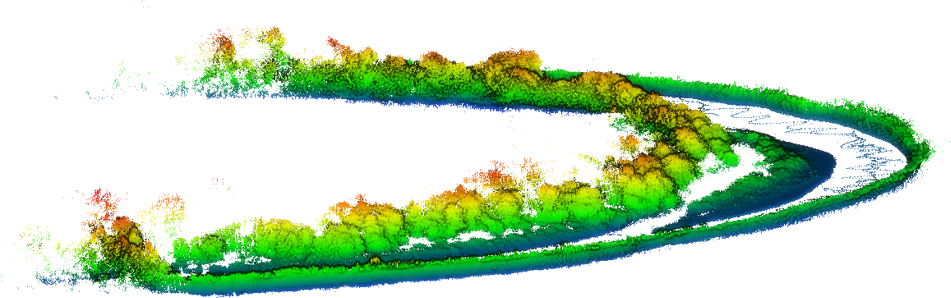
One central goal of the UWV is to combine the above-mentioned sensors to generate a geo-referenced point cloud of the water bottom and the adjacent bank areas (Fig. 5). It therefore is mandatory to calibrate the relative positions and orientations of all sensors and their coordinate systems. We developed a calibration strategy that can be applied in the field, directly before each measurement with the according sensor configuration and their final orientations (Sardemann et al., 2023).
5 High-resolution acquisition of hydro-morphological parameters of small watercourses to support flood risk management and the achievement of good ecological status
The development of small streams and drainage ditches in order to achieve a good ecological status of water bodies, as required by the European Water Framework Directive, poses a particular challenge for municipalities. For the planning of integrated measures for the protection and management of these water bodies, geodetic documentation and hydro-morphological classification are fundamental. Since data collection, especially for small second- and third-order watercourses, is highly time-consuming and cost-intensive, the project developed a combined surveying and evaluation methodology that enables efficient mapping of small water bodies using mobile handheld laser scanners, as well as the derivation of water-specific parameters from the acquired measurement data. Consequently, the project was structured around three main tasks: data acquisition, data analysis, and validation of results.
5.1 Data acquisition
The work on data acquisition initially focused on the development of a mobile low-cost multi-sensor platform, which was used for testing and development purposes (Blaskow & Schwalbe 2021). For the actual survey of stream morphology, the mobile laser scanning system GeoSlam ZEB Horizon equipped with an RGB camera was employed. Owing to its 360° × 270° field of view, even narrow and overgrown stream sections could be fully captured. A key area of work was the calibration of the relative orientation between scanner and camera in order to improve the transfer of RGB colour information onto the 3D point clouds. To this end, a procedure (including an appropriate calibration environment) was developed that allows for precise determination of both temporal offsets between the trajectories of the camera and scanner as well as deviations in the positioning of the lever arm. Stream surveys were conducted using a stop-and-go method supported by RTK-GNSS control points and loop closures. For geo-referencing, control points were defined along the stream and directly integrated into the trajectory during scanning by briefly positioning the scanner on the control points while passing. Depending on the measurement conditions, the surveying of control points was carried out either prior to or simultaneously with the scanning process.
5.2 Data analysis
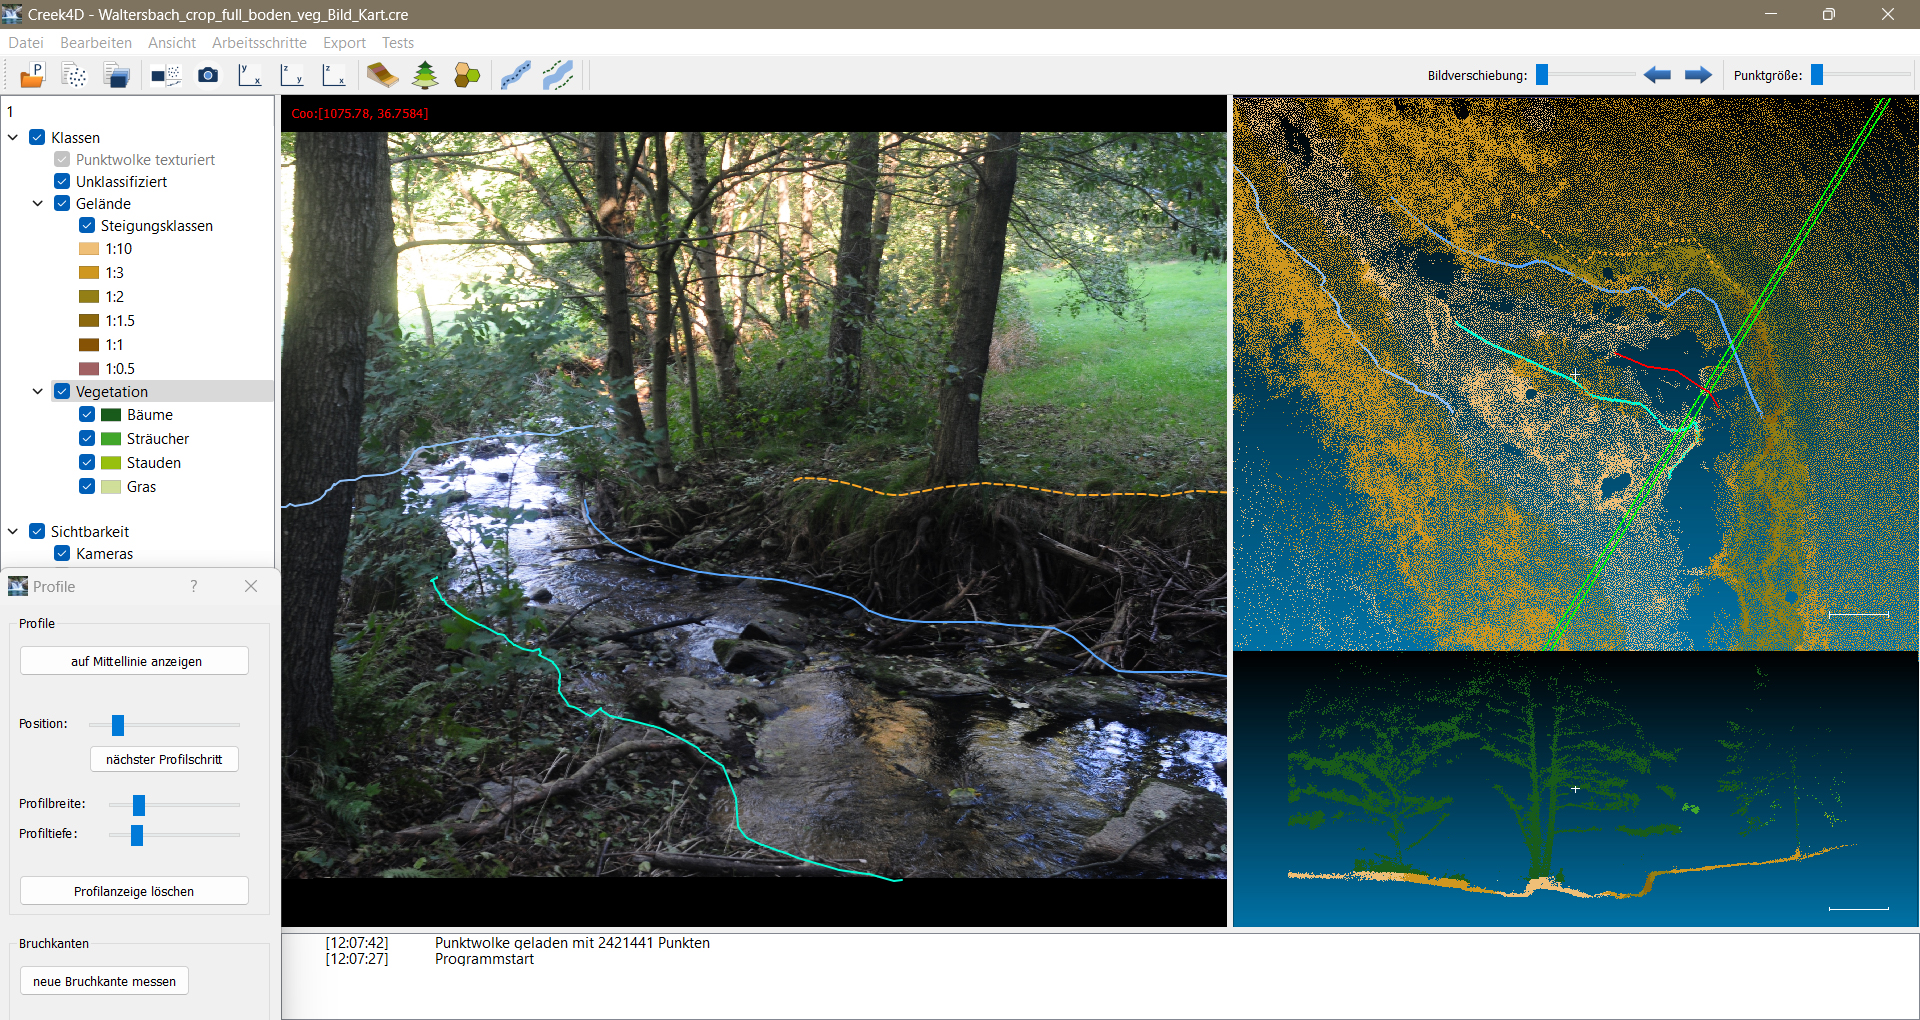
A main objective was the development of a freely available prototype software package1 capable of deriving hydro-morphologically relevant parameters from image and laser scanner data (Fig. 6).
A graphical user interface allows the visualization of input data, intermediate results, and final outputs in both 2D and 3D, as well as the control of analysis algorithms. For areal features, a method was implemented to separate terrain and vegetation points within the point cloud, classify them, and subsequently convert them into raster and vector data. This, for example, enables the mapping of slope areas or vegetation zones. Linear features such as shorelines or embankment edges are extracted through a combined analysis of point cloud and image data. In this process, lines can be measured manually or semi-automatically within the images and then projected directly into 3D space. This allows the precise derivation of creek centre-lines, riparian strips, and break lines. Point features, such as small structures or special objects, are directly marked within the point cloud and assigned with attributes. A superimposed visualization of image and laser scanning data facilitates unambiguous identification. In addition, initial tests with AI-supported segmentation were conducted, indicating potential for future automation of shoreline mapping. All detected objects can be transformed into a reference coordinate system and exported as shape-files for subsequent integration into geographic information systems. Separate files with associated attribute tables are generated for areal, linear, and point features. Key parameters, such as slope classes or vegetation height for surface features, are automatically derived and included in the corresponding attribute tables.
5.3 Validation
To assess the accuracy of the entire acquisition and evaluation process, reference and repeat measurements were carried out, particularly along shorelines. Comparisons with RTK-GNSS reference data resulted in mean deviations of approximately 0.12 m (spring survey) and 0.15 m (summer survey). Seasonal effects such as water level and vegetation density influence the interpretability of the survey data and contribute significantly to the overall accuracy. In general, the achievable positional accuracy is on the order of one to two decimetres. To evaluate efficiency, the time required for data acquisition and analysis was also documented. Compared to conventional tacheometric methods, time savings of approximately one order of magnitude were achieved.
6 Compensation of wave effects in through-water photogrammetry by processing short image sequences
The key problem when mapping and monitoring of water bodies with photogrammetric methods is the modelling or compensation of refraction effects when imaging through water. While the modelling of the refraction is clearly defined for still water surfaces, as here the water surface can be considered as a horizontal plane, the problem becomes much more complex when the water surface has waves – as actually in many cases. Several approaches, such as the one described by Sardemann et al. (2024), attempt to address this issue by mathematically modelling the water in object space using spline or Fourier parametrizations and simultaneously determining the water parameters together with the object point coordinates. However, some aspects limit this this method to rather simple wave patterns only. Firstly, a decent imaging quality of submerged features is essential for proper detection and measurement. This is seldom the case for water bodies with small crippling waves which cause irregular image distortions. Furthermore, the complexity of water modelling cannot be driven too far, otherwise the reliability and accuracy of the determination of the parameter drops dramatically. Lastly, the submerged scene must be captured simultaneously from different directions (e.g. cameras) which means a high effort in synchronisation and costs for equipment.
An alternative approach to solving the problem of wavy water surfaces is to transfer it to image space. The pixel-wise analysis of the variation of grey values within a short image sequence taken by a stationary camera is one way to reduce the disturbing effects down to an acceptable level. We assume, that the water surface moves randomly around its idle state, so moments with horizontally oriented water surface elements should occur more frequently than others. Through simple pixel-wise Median-filtering on the time axis, the ‘right’ grey value, which would ideally be captured through a horizontal water element, can be identified. The result is an image, which almost corresponds to one taken through a flat water surface. Several lab experiments provided proof of concept (Mulsow et al., 2024).
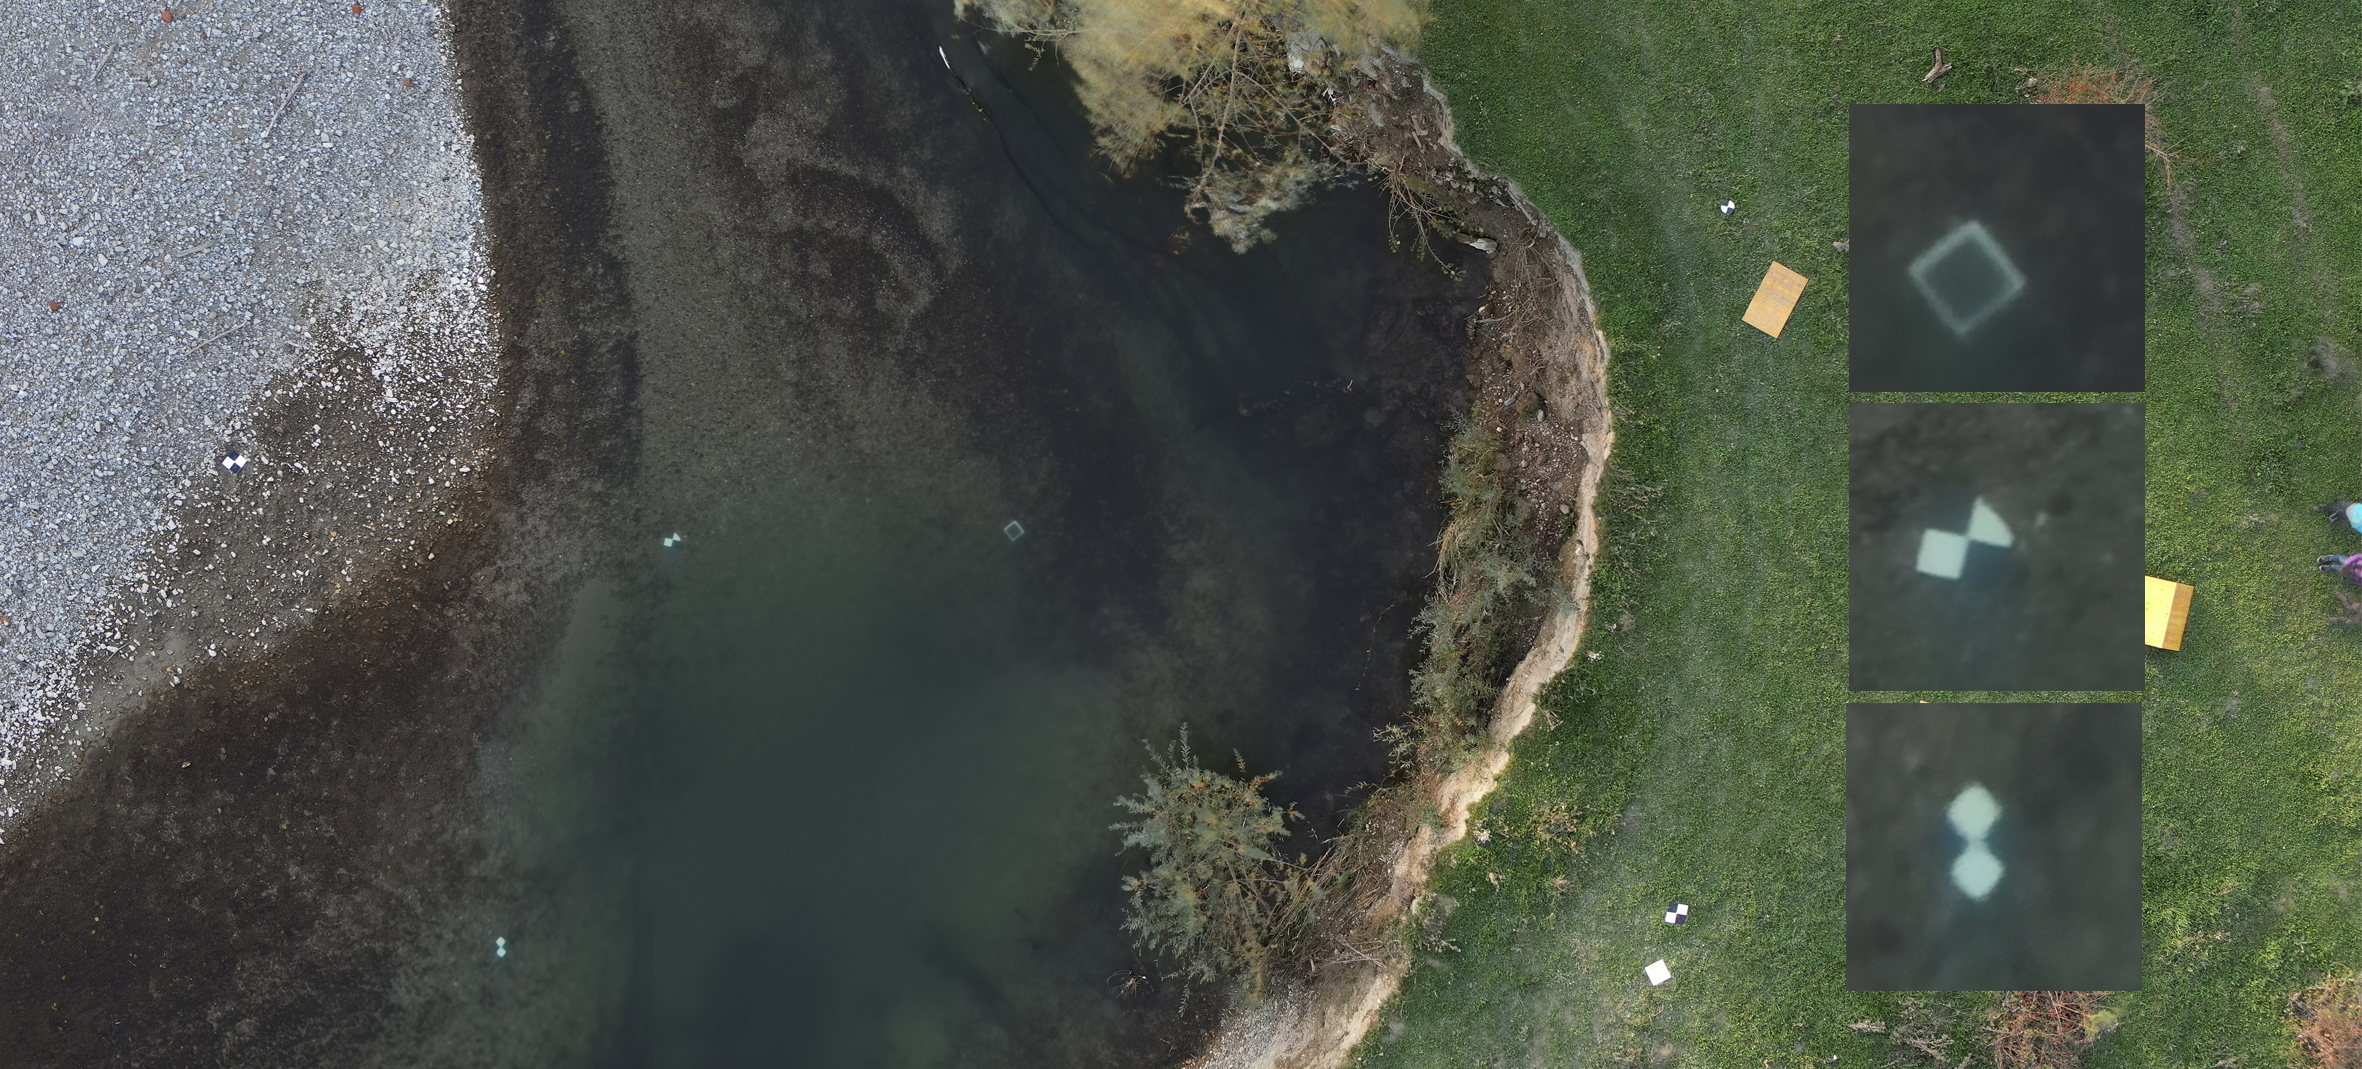
To test the method in a real-world scenario, several data sets were acquired during a measurement campaign at the pre-alpine Pielach River in October 2024 following a major flood event in September of that year (Mandlburger et al., 2025). The image sequences were captured using a DJI M350 RTK multicopter with a Zenmuse P1 45 MP RGB camera, flying at an altitude of 30 m, which means a ground sample distance of 3 mm. Operating the UAV in hovering mode, around 100 images per sequence were taken with a frequency of 0.7 Hz from defined positions. However, even with the use of a gimbal, the images showed motion effects of up to 30 pixels in every direction within a sequence. However, any remaining small movements could be compensated for by co-registering all images to a reference image (e.g. a frame in the middle of the sequence), based on least-squares matching applied to stable tie points on dry land. The RMSE of this co-registration was in the order of 0.1 pixels.
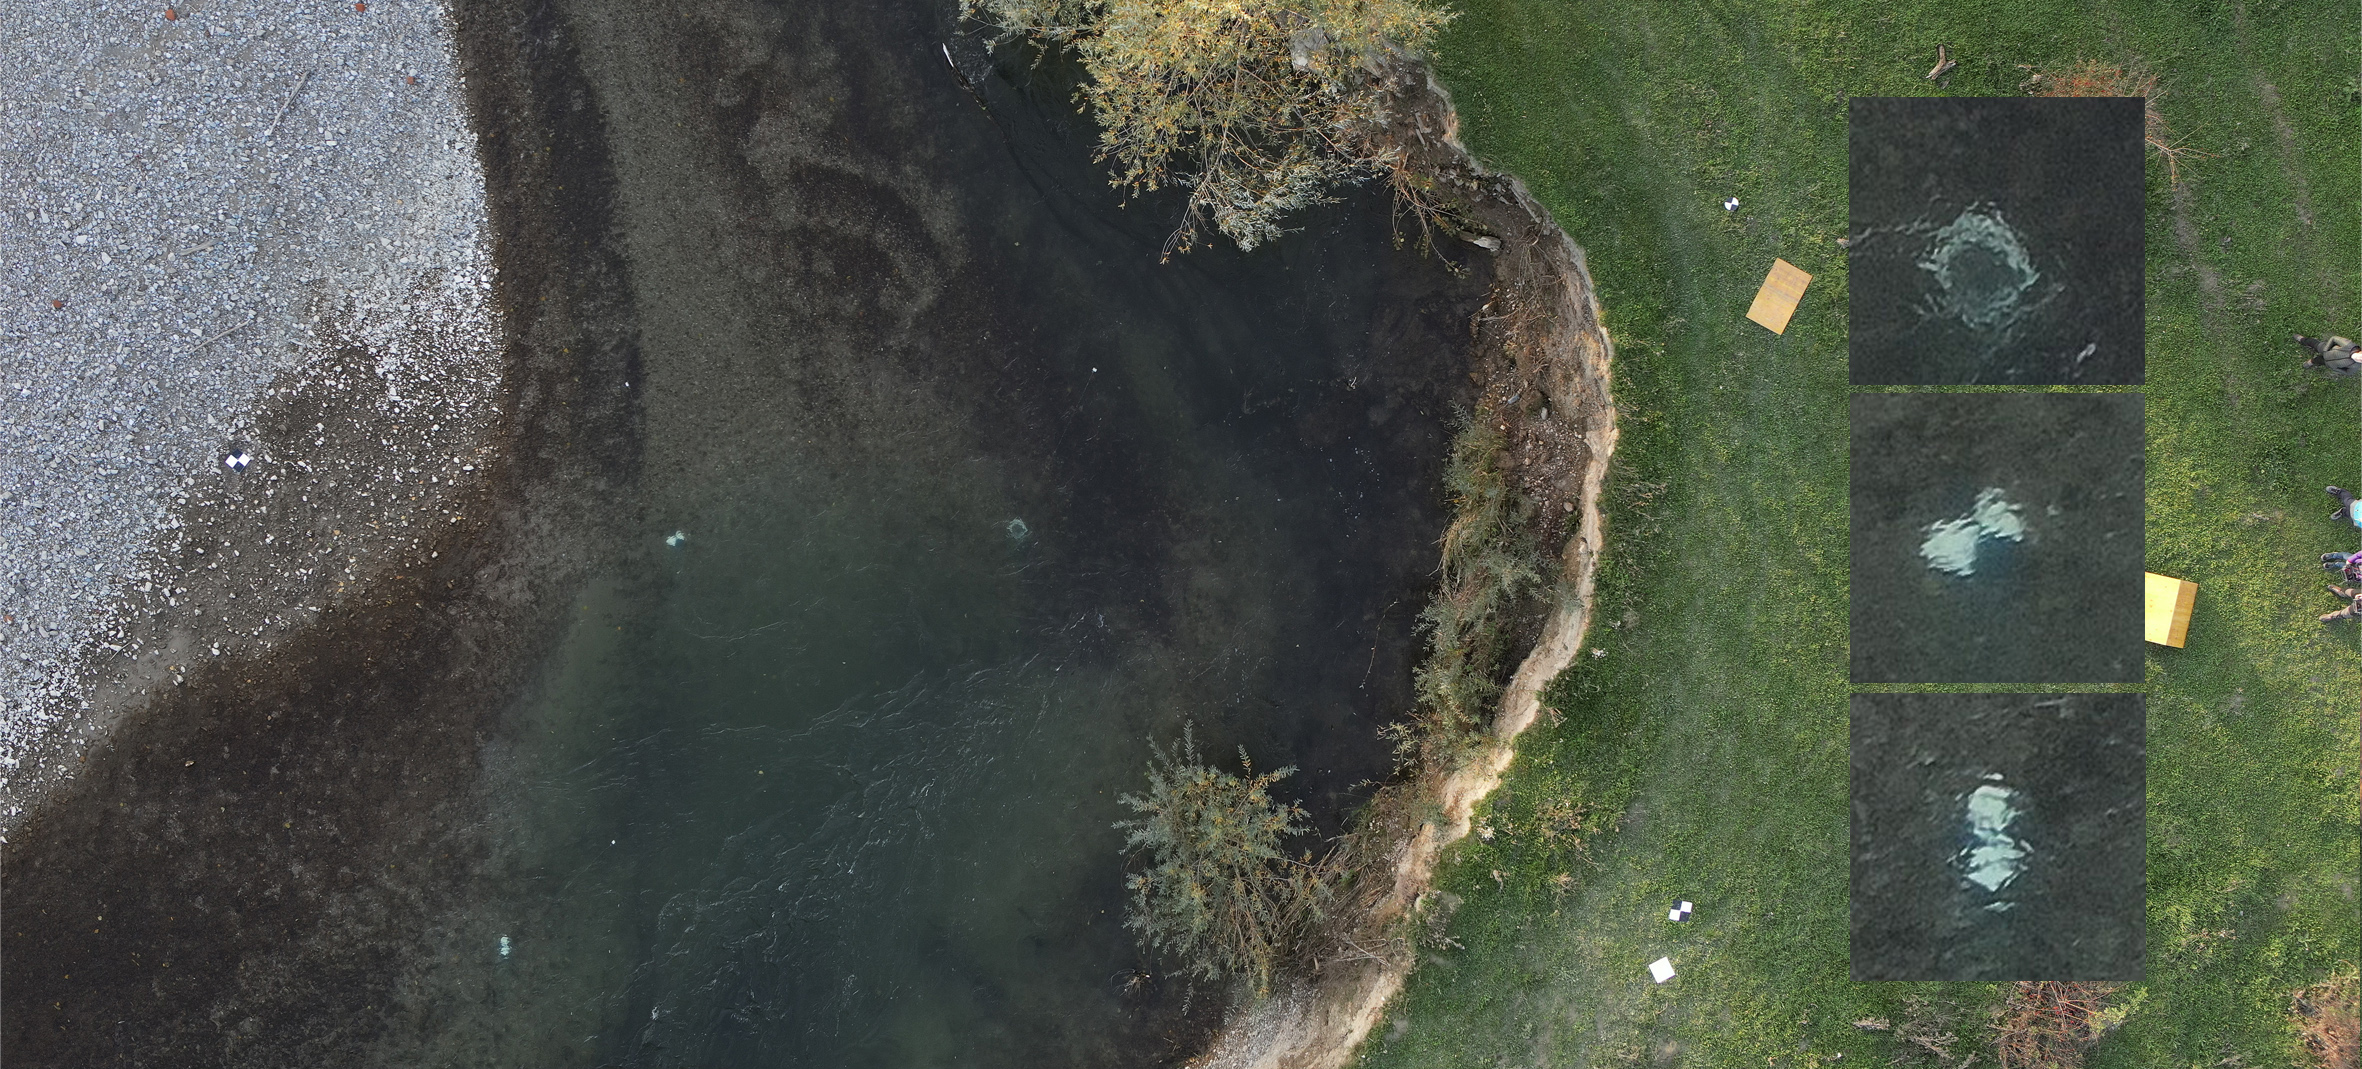
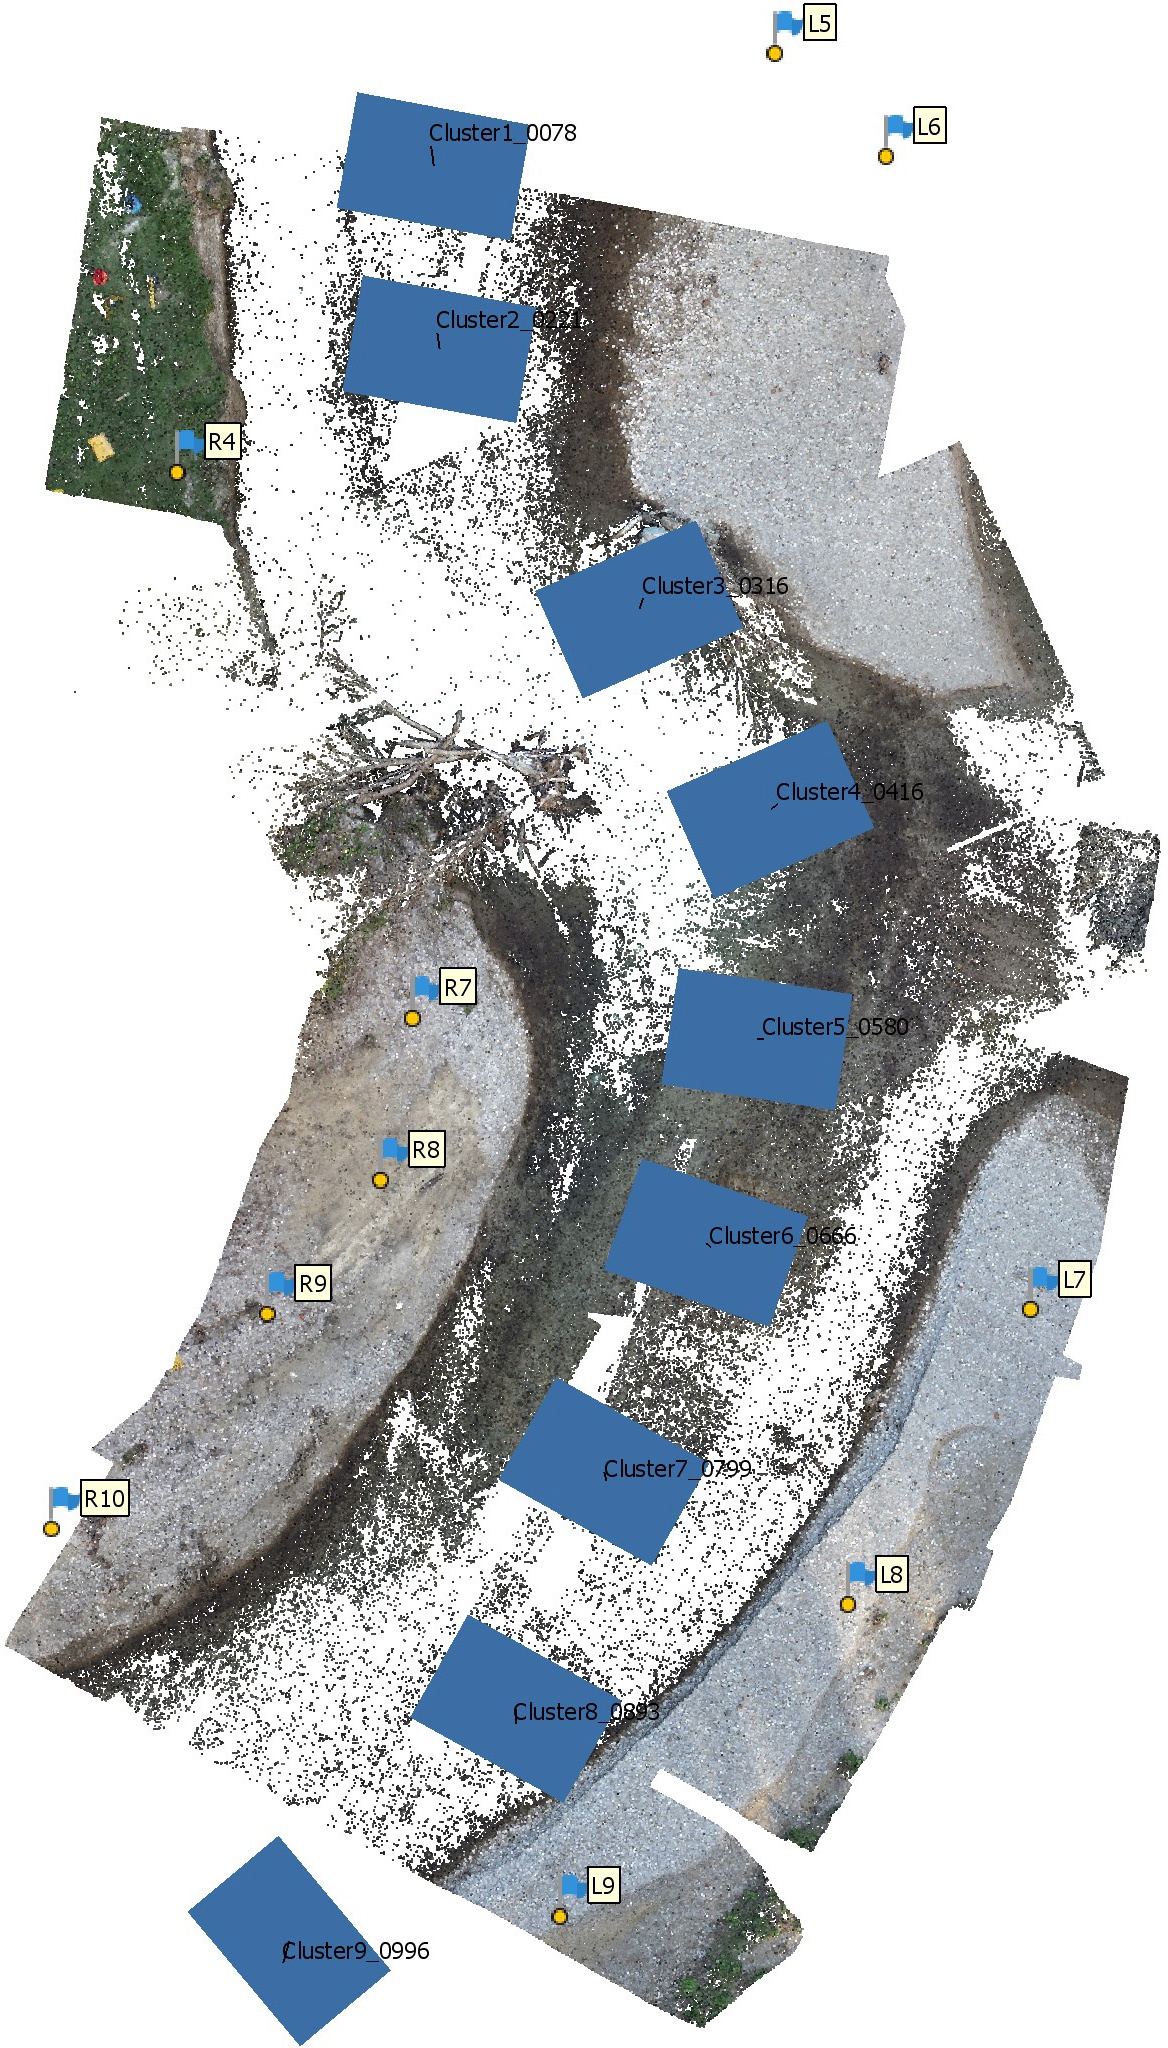
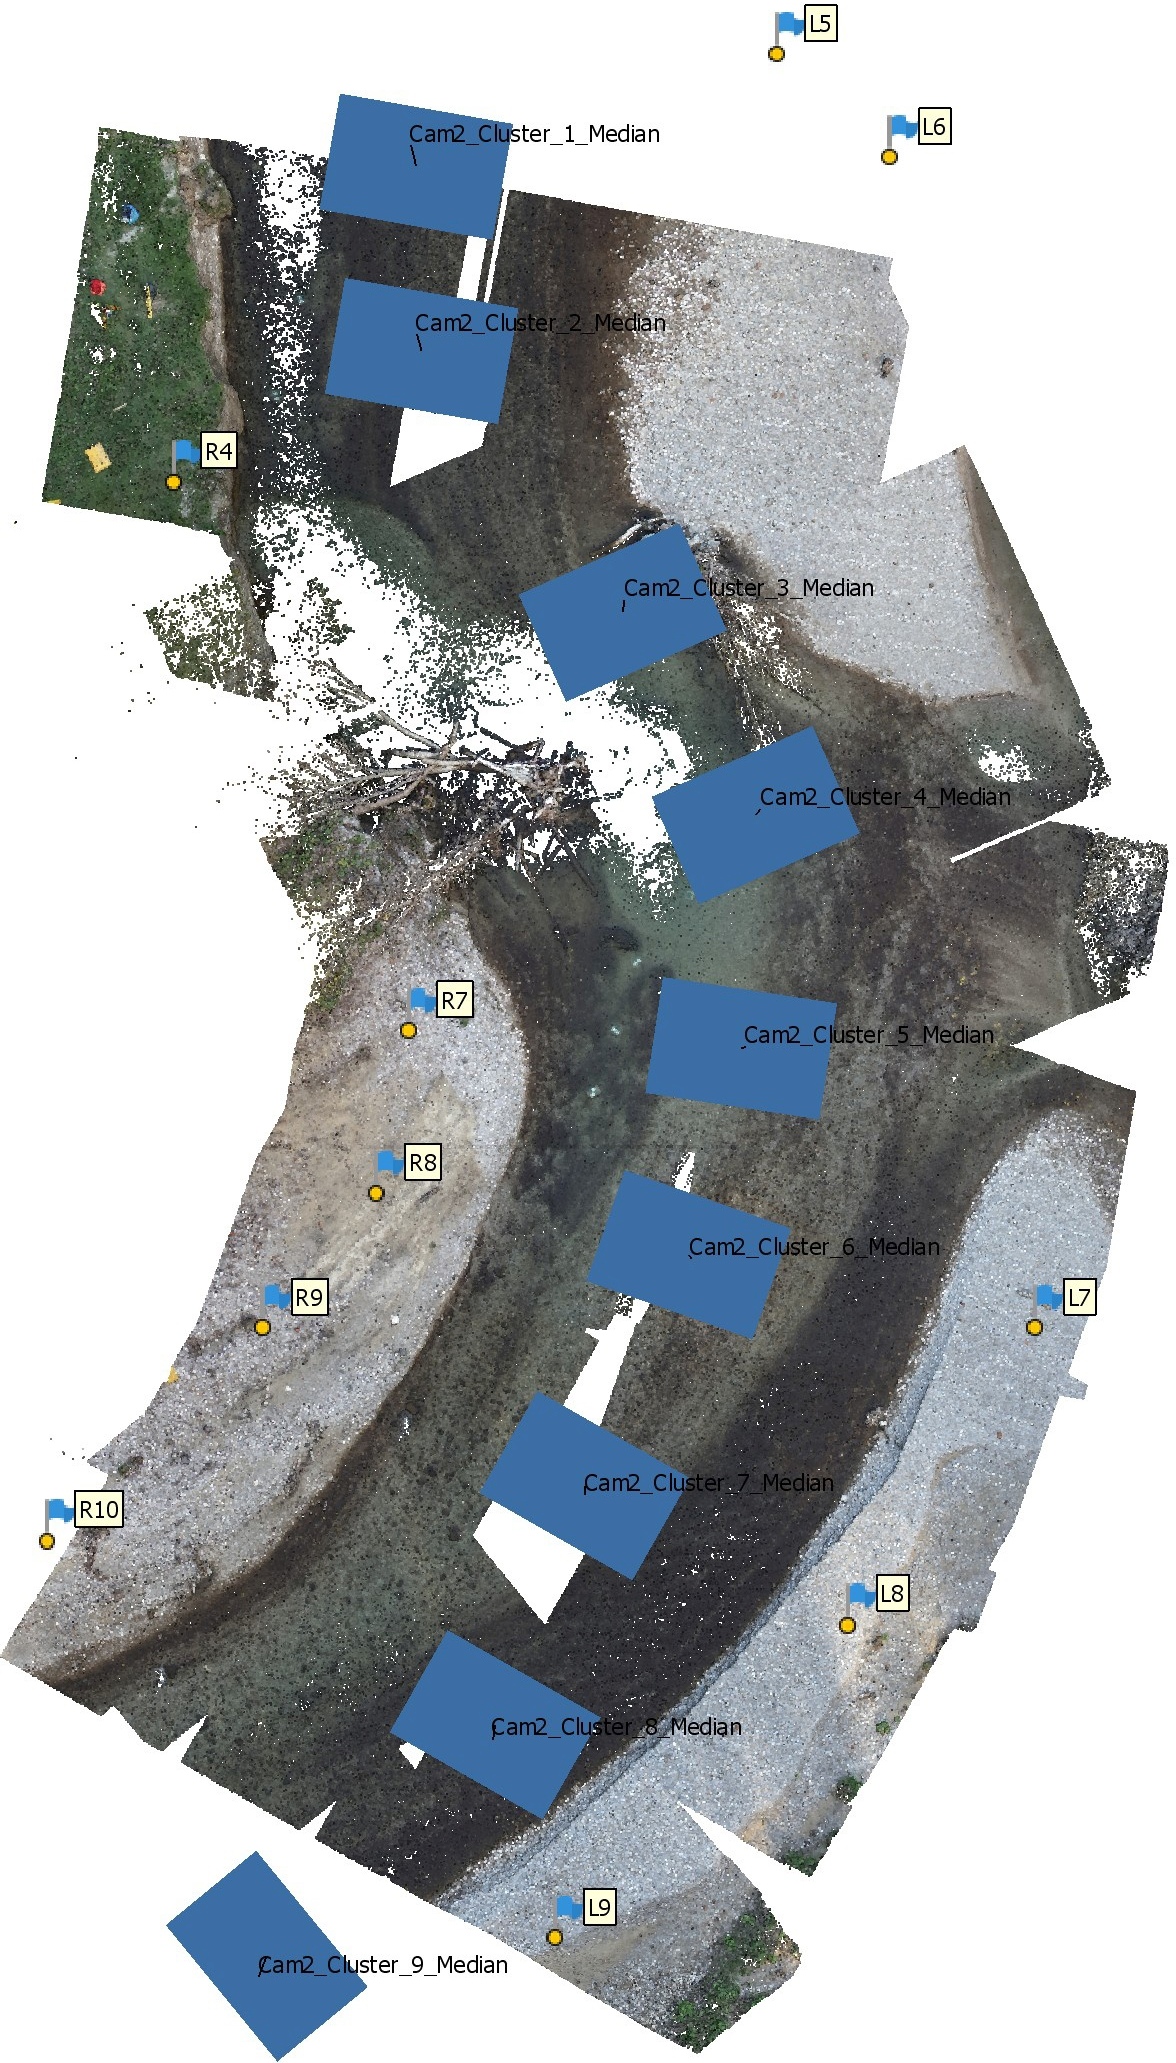
The stack of co-registered images can then be forwarded to the pixel-wise analysis of grey values within the image sequence. Finally, a corrected image with a geometry almost as if it would have been captured through a flat horizontal water surface can be forwarded to the standard multi-media photogrammetry pipeline for forward intersection of homologous image points. Fig. 7 shows the results of image sequence processing, Fig. 8 shows a comparison of Structure from Motion (SfM) results using original and sequence-processed image data. Besides the improvement in geometric accuracy for the underwater terrain points, the number of feature points could be increased significantly due to compensated local image distortions.
7 Pilot study on a photogrammetric glacier lake outburst flood early warning system
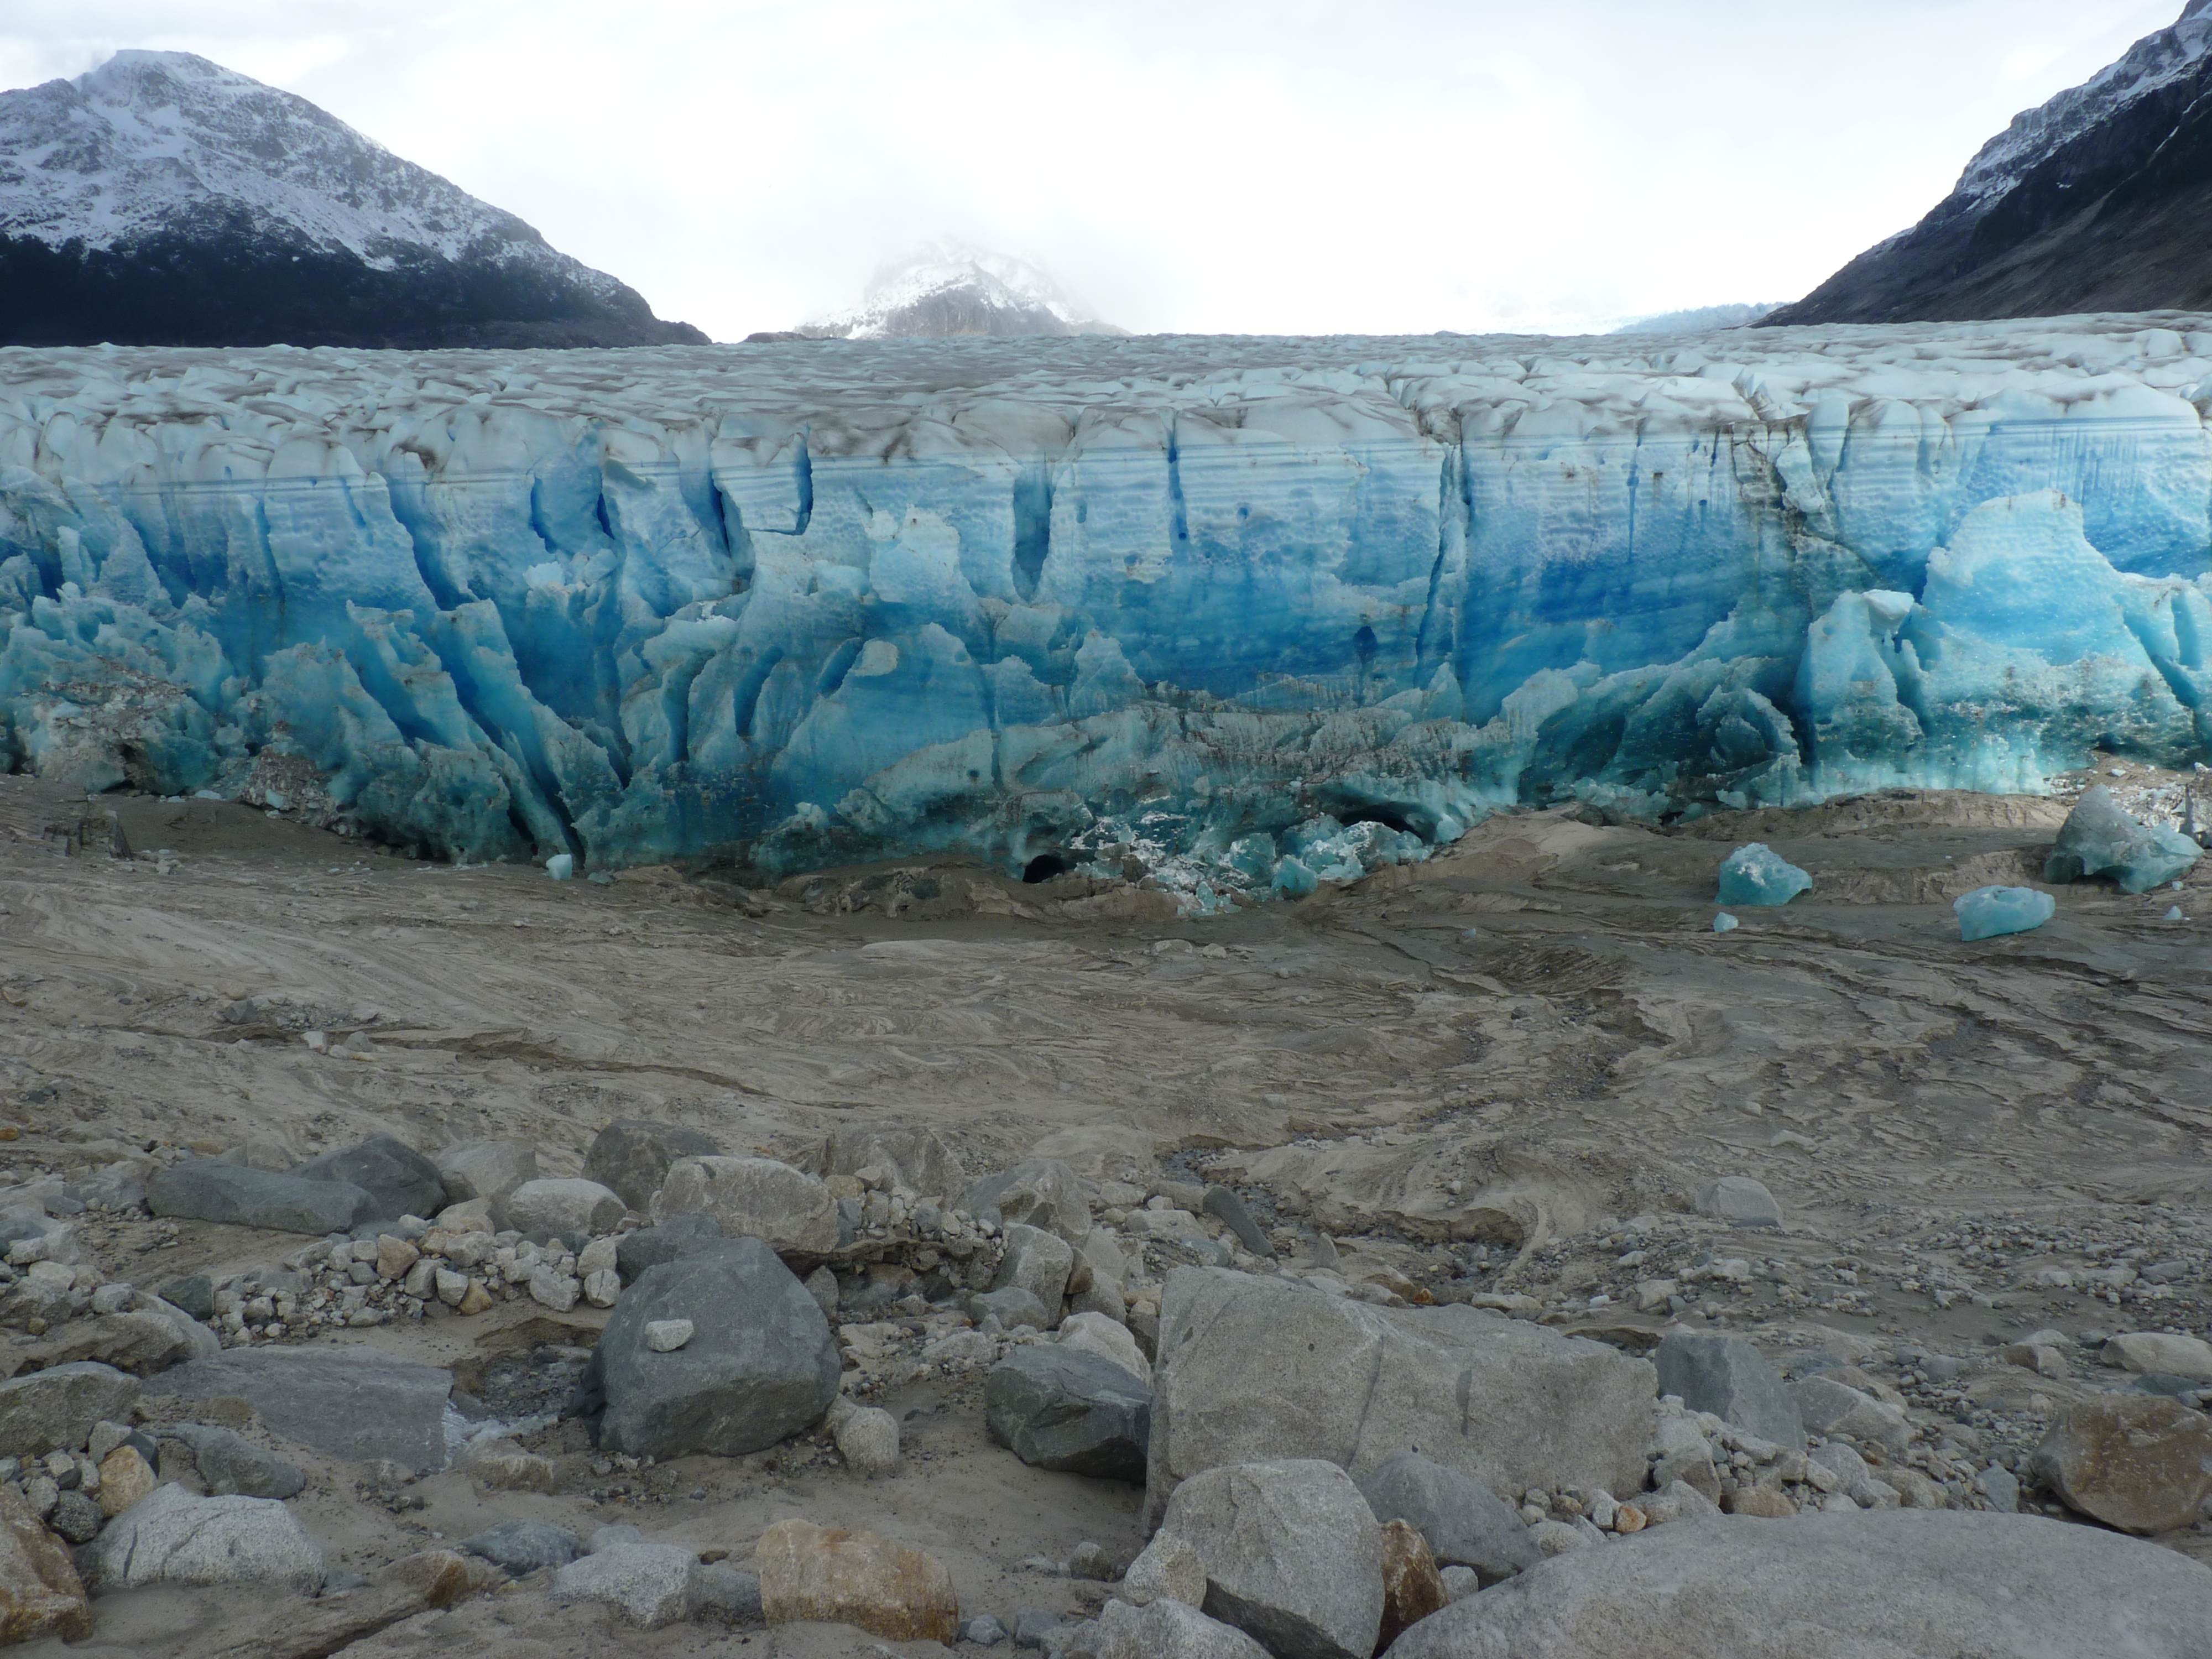
Glacier Lake Outburst Floods (GLOFs) depict an environmental risk with an increasing damage potential in many regions of the world. GLOFs are often caused by glacier margin lakes, which suddenly find a drainage path underneath the bottom of a glacier, which is retreating and destabilized as a consequence of local or global climate changes. In a typical GLOF event, a glacier margin lake may drain completely in 24 hours, causing a large flood wave in the area downstream the glacier.
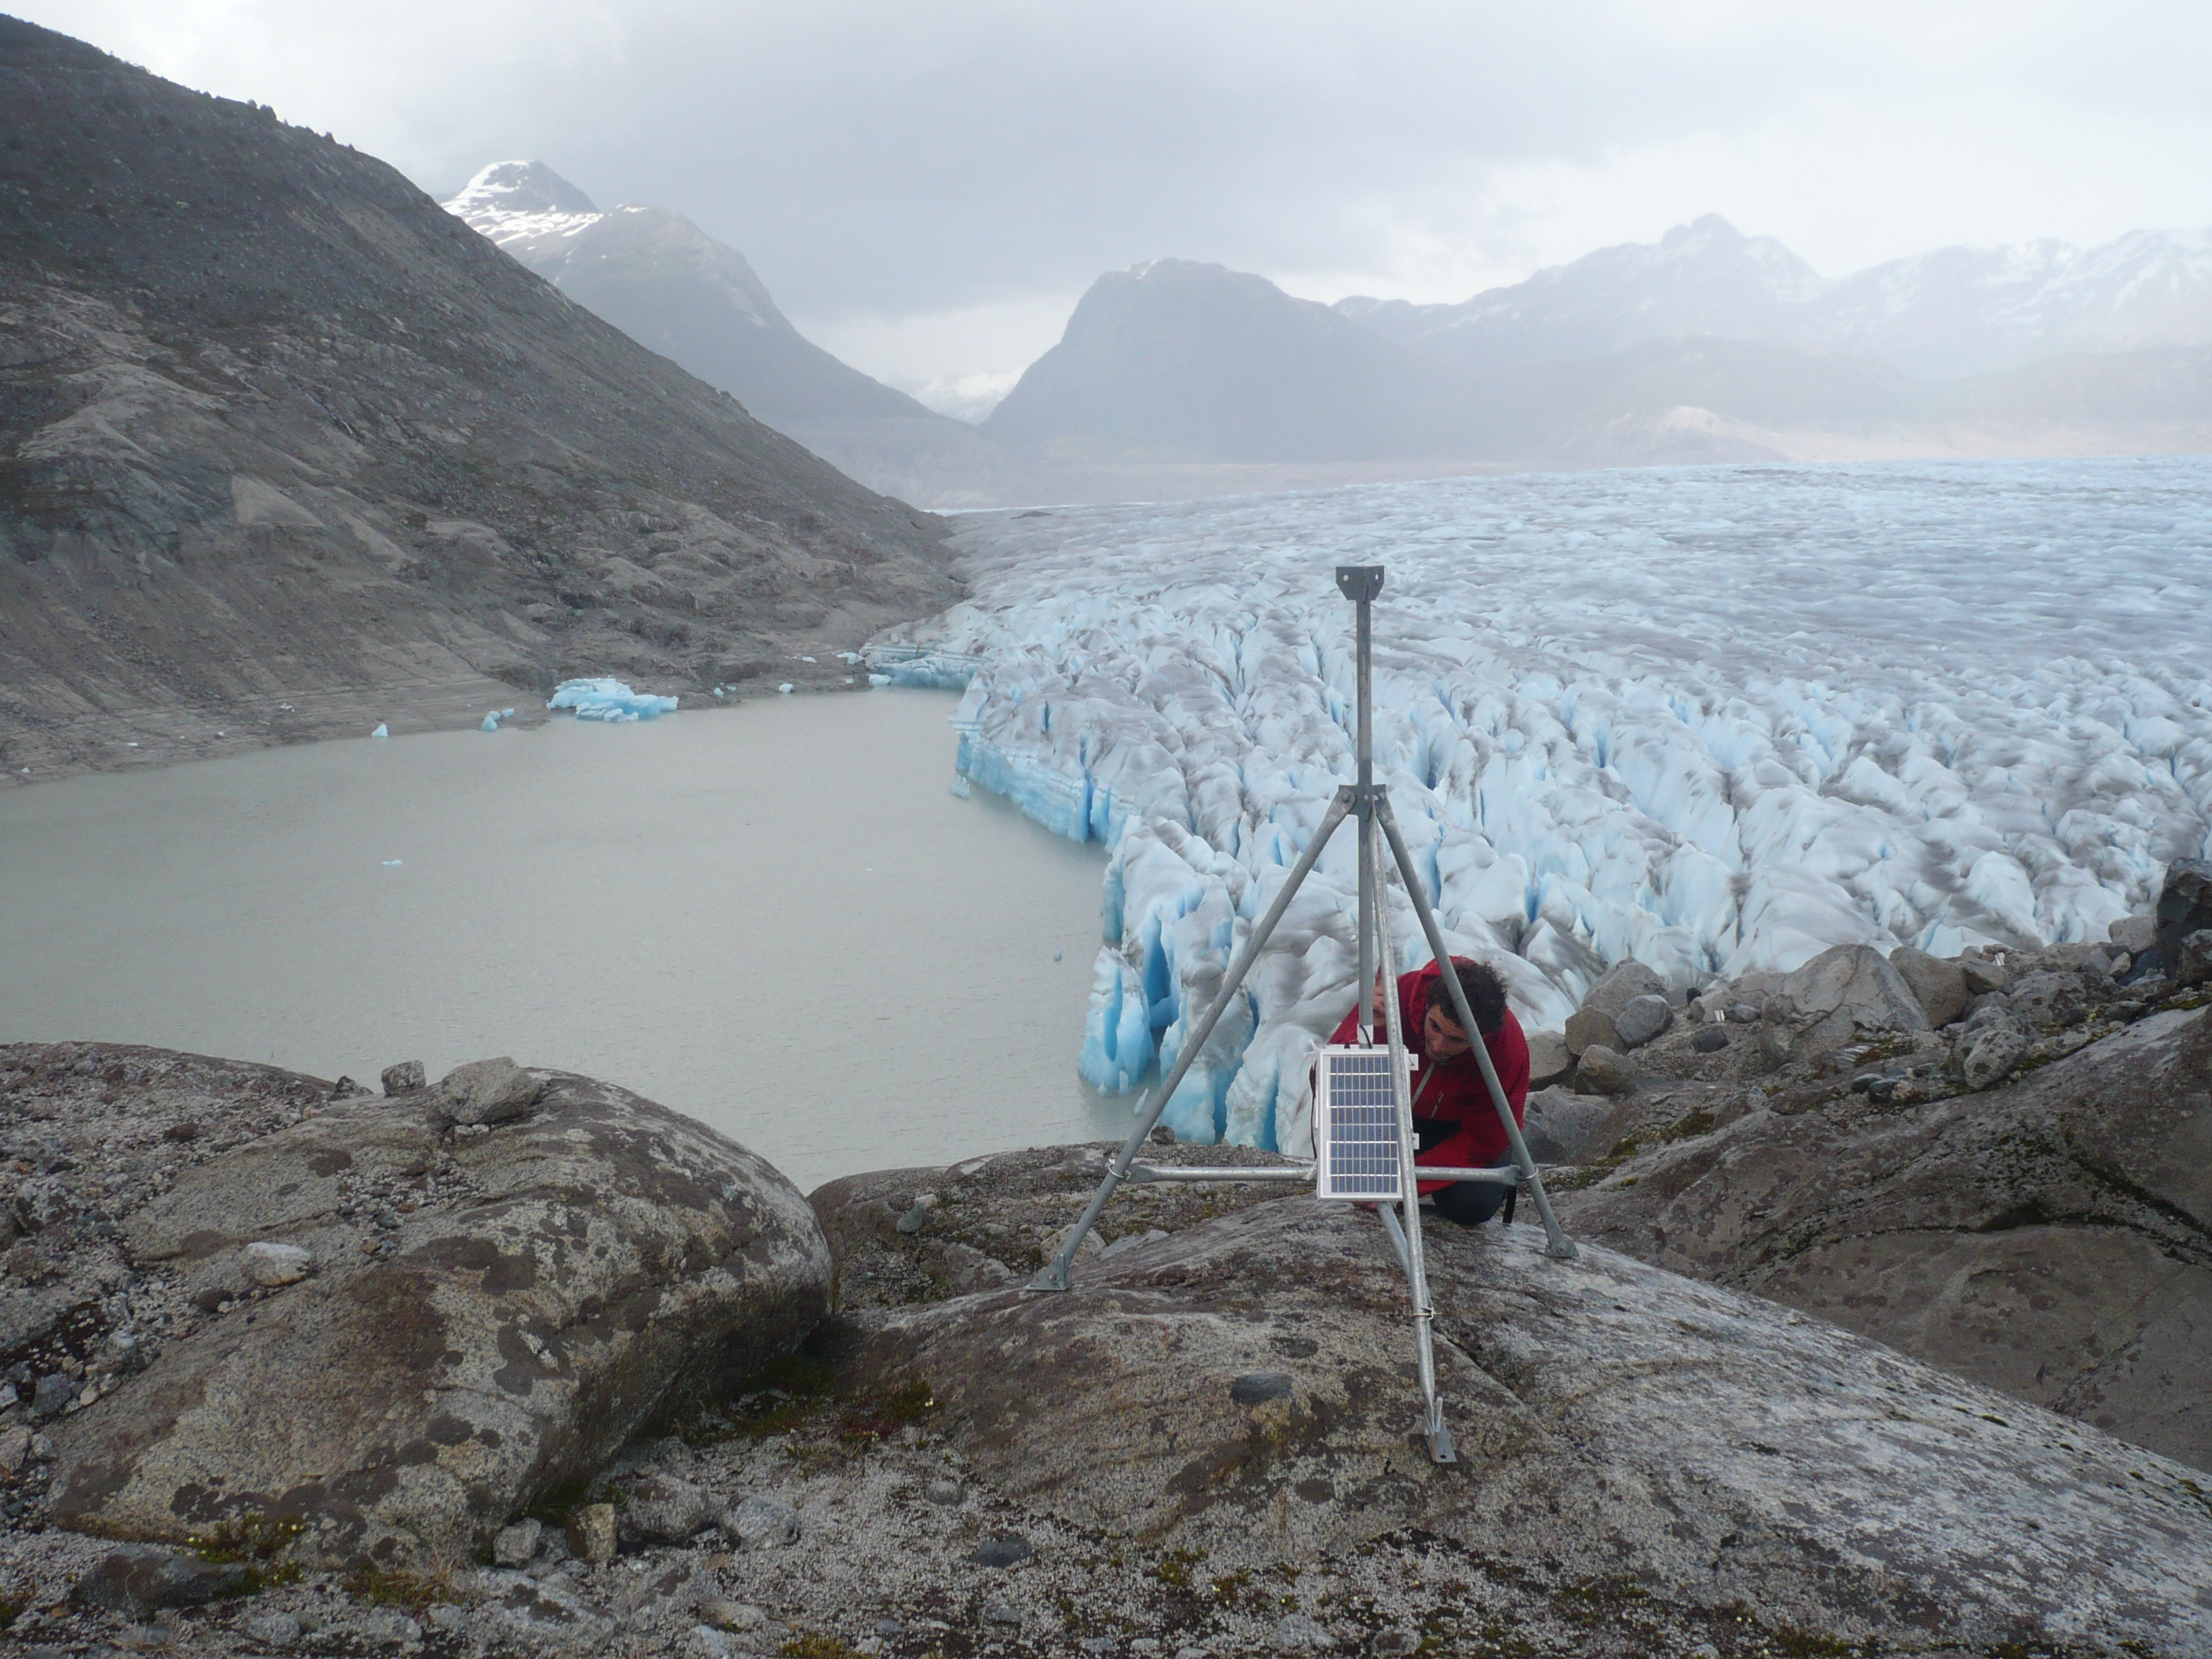
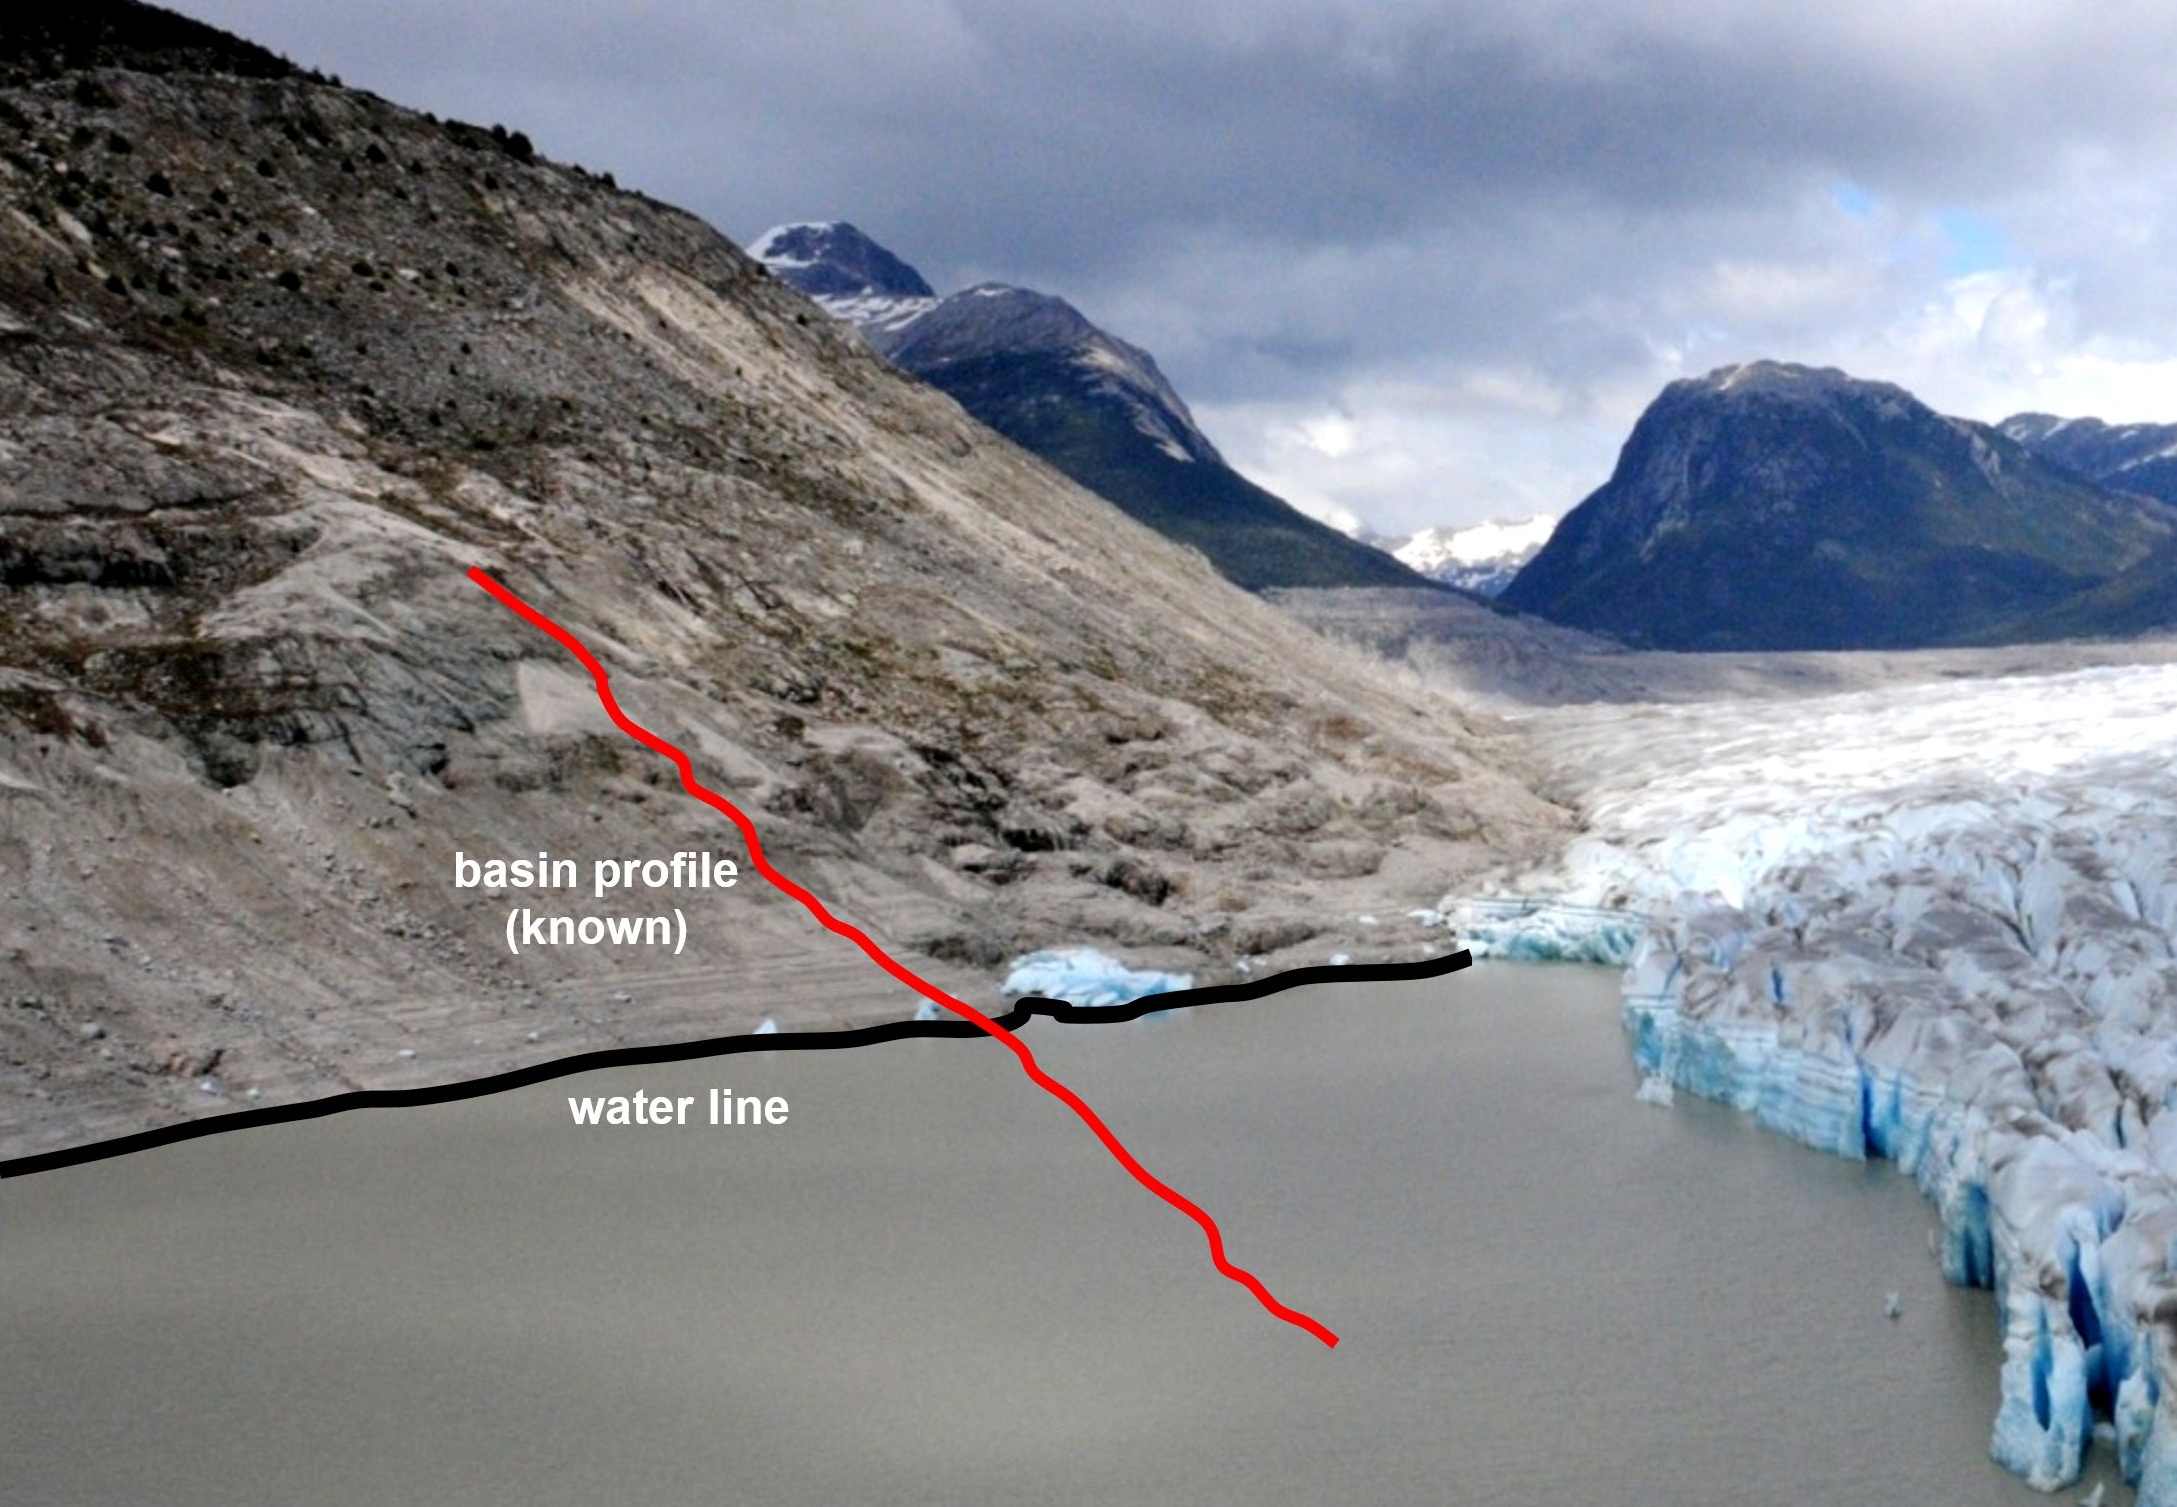
A pilot study has been conducted on the configuration of a terrestrial photogrammetric glacier margin lake monitoring system observing some recent GLOF events in the Northern Patagonian Icefield in Chile (Fig. 9; Maas et al., 2012). The monitoring system is based on a camera taking images at regular time intervals. In these images, variations of the water level can be detected by tracking the water-land interface at pre-defined image spots. Due to the drainage mechanism, which is characterized by erosion and melting at the bottom of the glacier, GLOFs are indicated by a progressive water level drop in the lake. Water level changes may be detected with subpixel accuracy by image sequence processing methods. If a 3D model of the lake bottom topography (or at least one height profile into the lake) exists, water level changes in monoscopic image sequences may be transformed into volume loss. The basic idea herein is the intersection of a terrain profile with a water level detected in the image and projected into object space (Fig. 10).
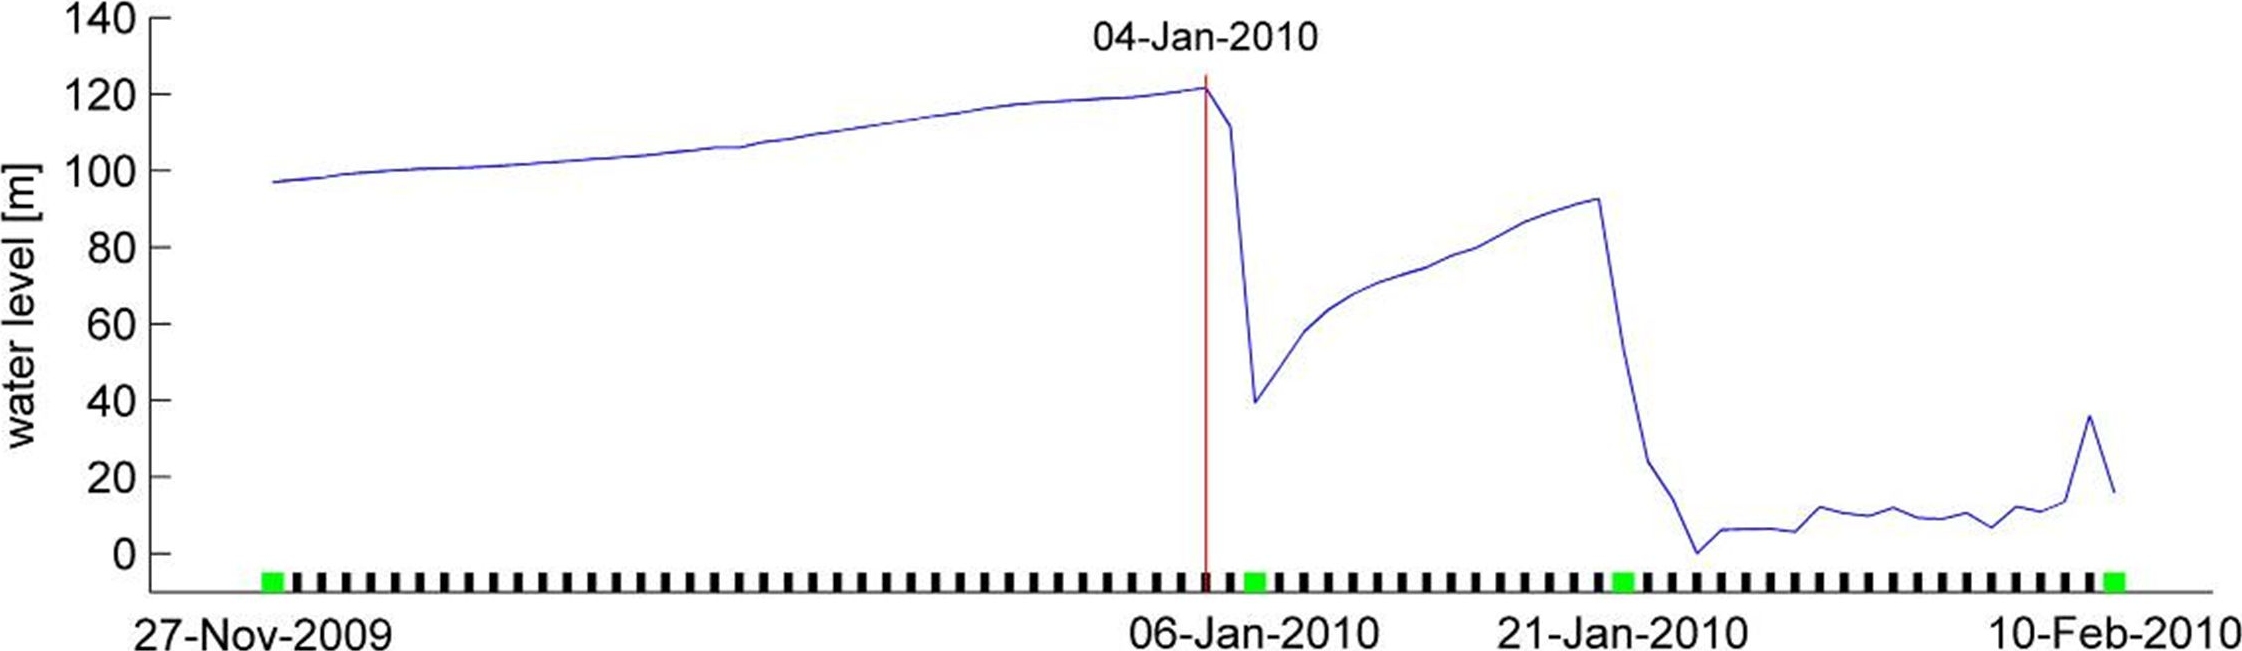
The camera orientation can be determined via a GNSS-supported photogrammetric network. Camera orientation changes, which may for instance be induced by wind, can be compensated by tracking some fiducial marks at suitable positions in the image (Schwalbe & Maas, 2017). The system has been used in a pilot study at two glacier margin lakes in the Northern Patagonian Icefield. These lakes have a depth of about 80–100 meters. The larger one (Lago Cachet II) has a length of 5 km and a maximum volume of about 200,000,000 m3. During the pilot study, several GLOF events could be recorded and processed (one of them shown in Fig. 11). Water level changes can be determined a precision of less than one decimetre. The results prove the feasibility of the concept, which has to be completed by a data telemetry and alarm system.
8 Improved LiDAR bathymetry water bottom topography acquisition by non-linear waveform stacking techniques
Coastal marine areas are subject to dynamic natural processes such as currents, tides, storm events as well as human impact, which significantly influence the topography of the seabed (Wright & Thom 2023; Hendriks et al., 2020; Kubicki et al., 2007). Continuous monitoring of seabed topography enables morphological changes to be detected at an early stage and appropriate measures to be taken to ensure safe navigation, infrastructure planning, and coastal protection. This requires high-resolution, reliable, regularly updated bathymetry data.
Ship-based hydro-acoustic methods are considered a proven method for the accurate and reliable acquisition of water bottom information. However, these methods reach their limits in shallow waters, as they are logistically complex and their efficiency decreases with decreasing water depth. Airborne LiDAR bathymetry (ALB) is a promising alternative for these areas and a useful addition in general. Bathymetric laser scanners use green laser pulses (mostly 532 nm) to acquire information about the water body (surface, column/volume, bottom) (Guenther et al., 2000). The sensors record the backscattered laser signal parts at high temporal resolution as full-waveform (FWF) signal, which provides detailed insights into the characteristics of the water body.
The underwater range of the laser signal is reduced by absorption and scattering effects in the water, especially at high turbidity levels, which often makes it difficult to detect water bottom echoes and limits the measurement process significantly (Guenther, 1985; Guenther & Goodman, 1978). While measurement depths of ~50 meter can be reached in very clear water, these may be reduced to less than two meter under turbid water conditions. This leads to data gaps and limited measurement coverage of the bottom.
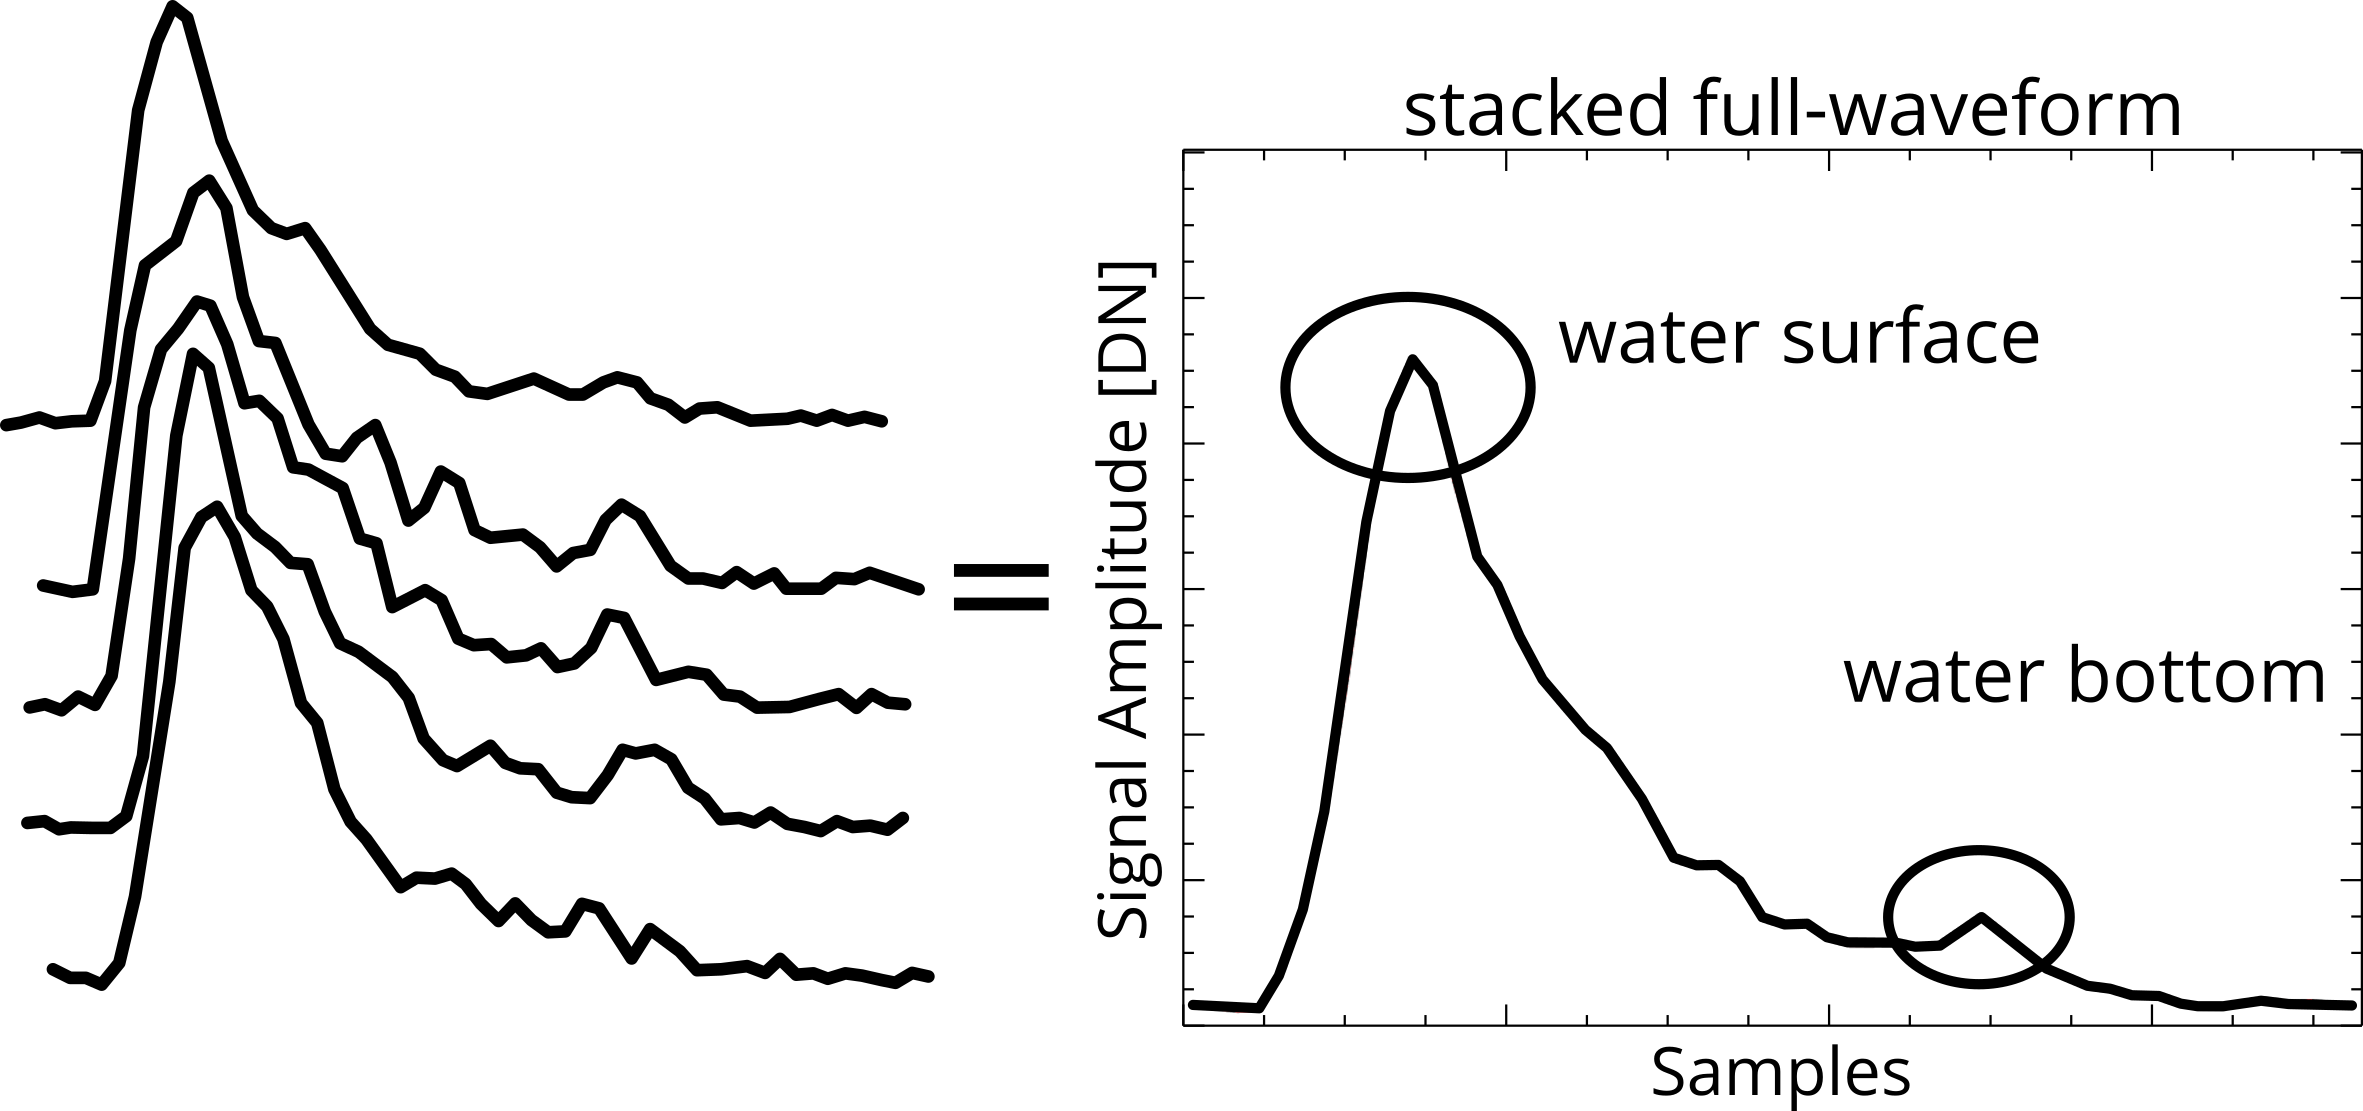
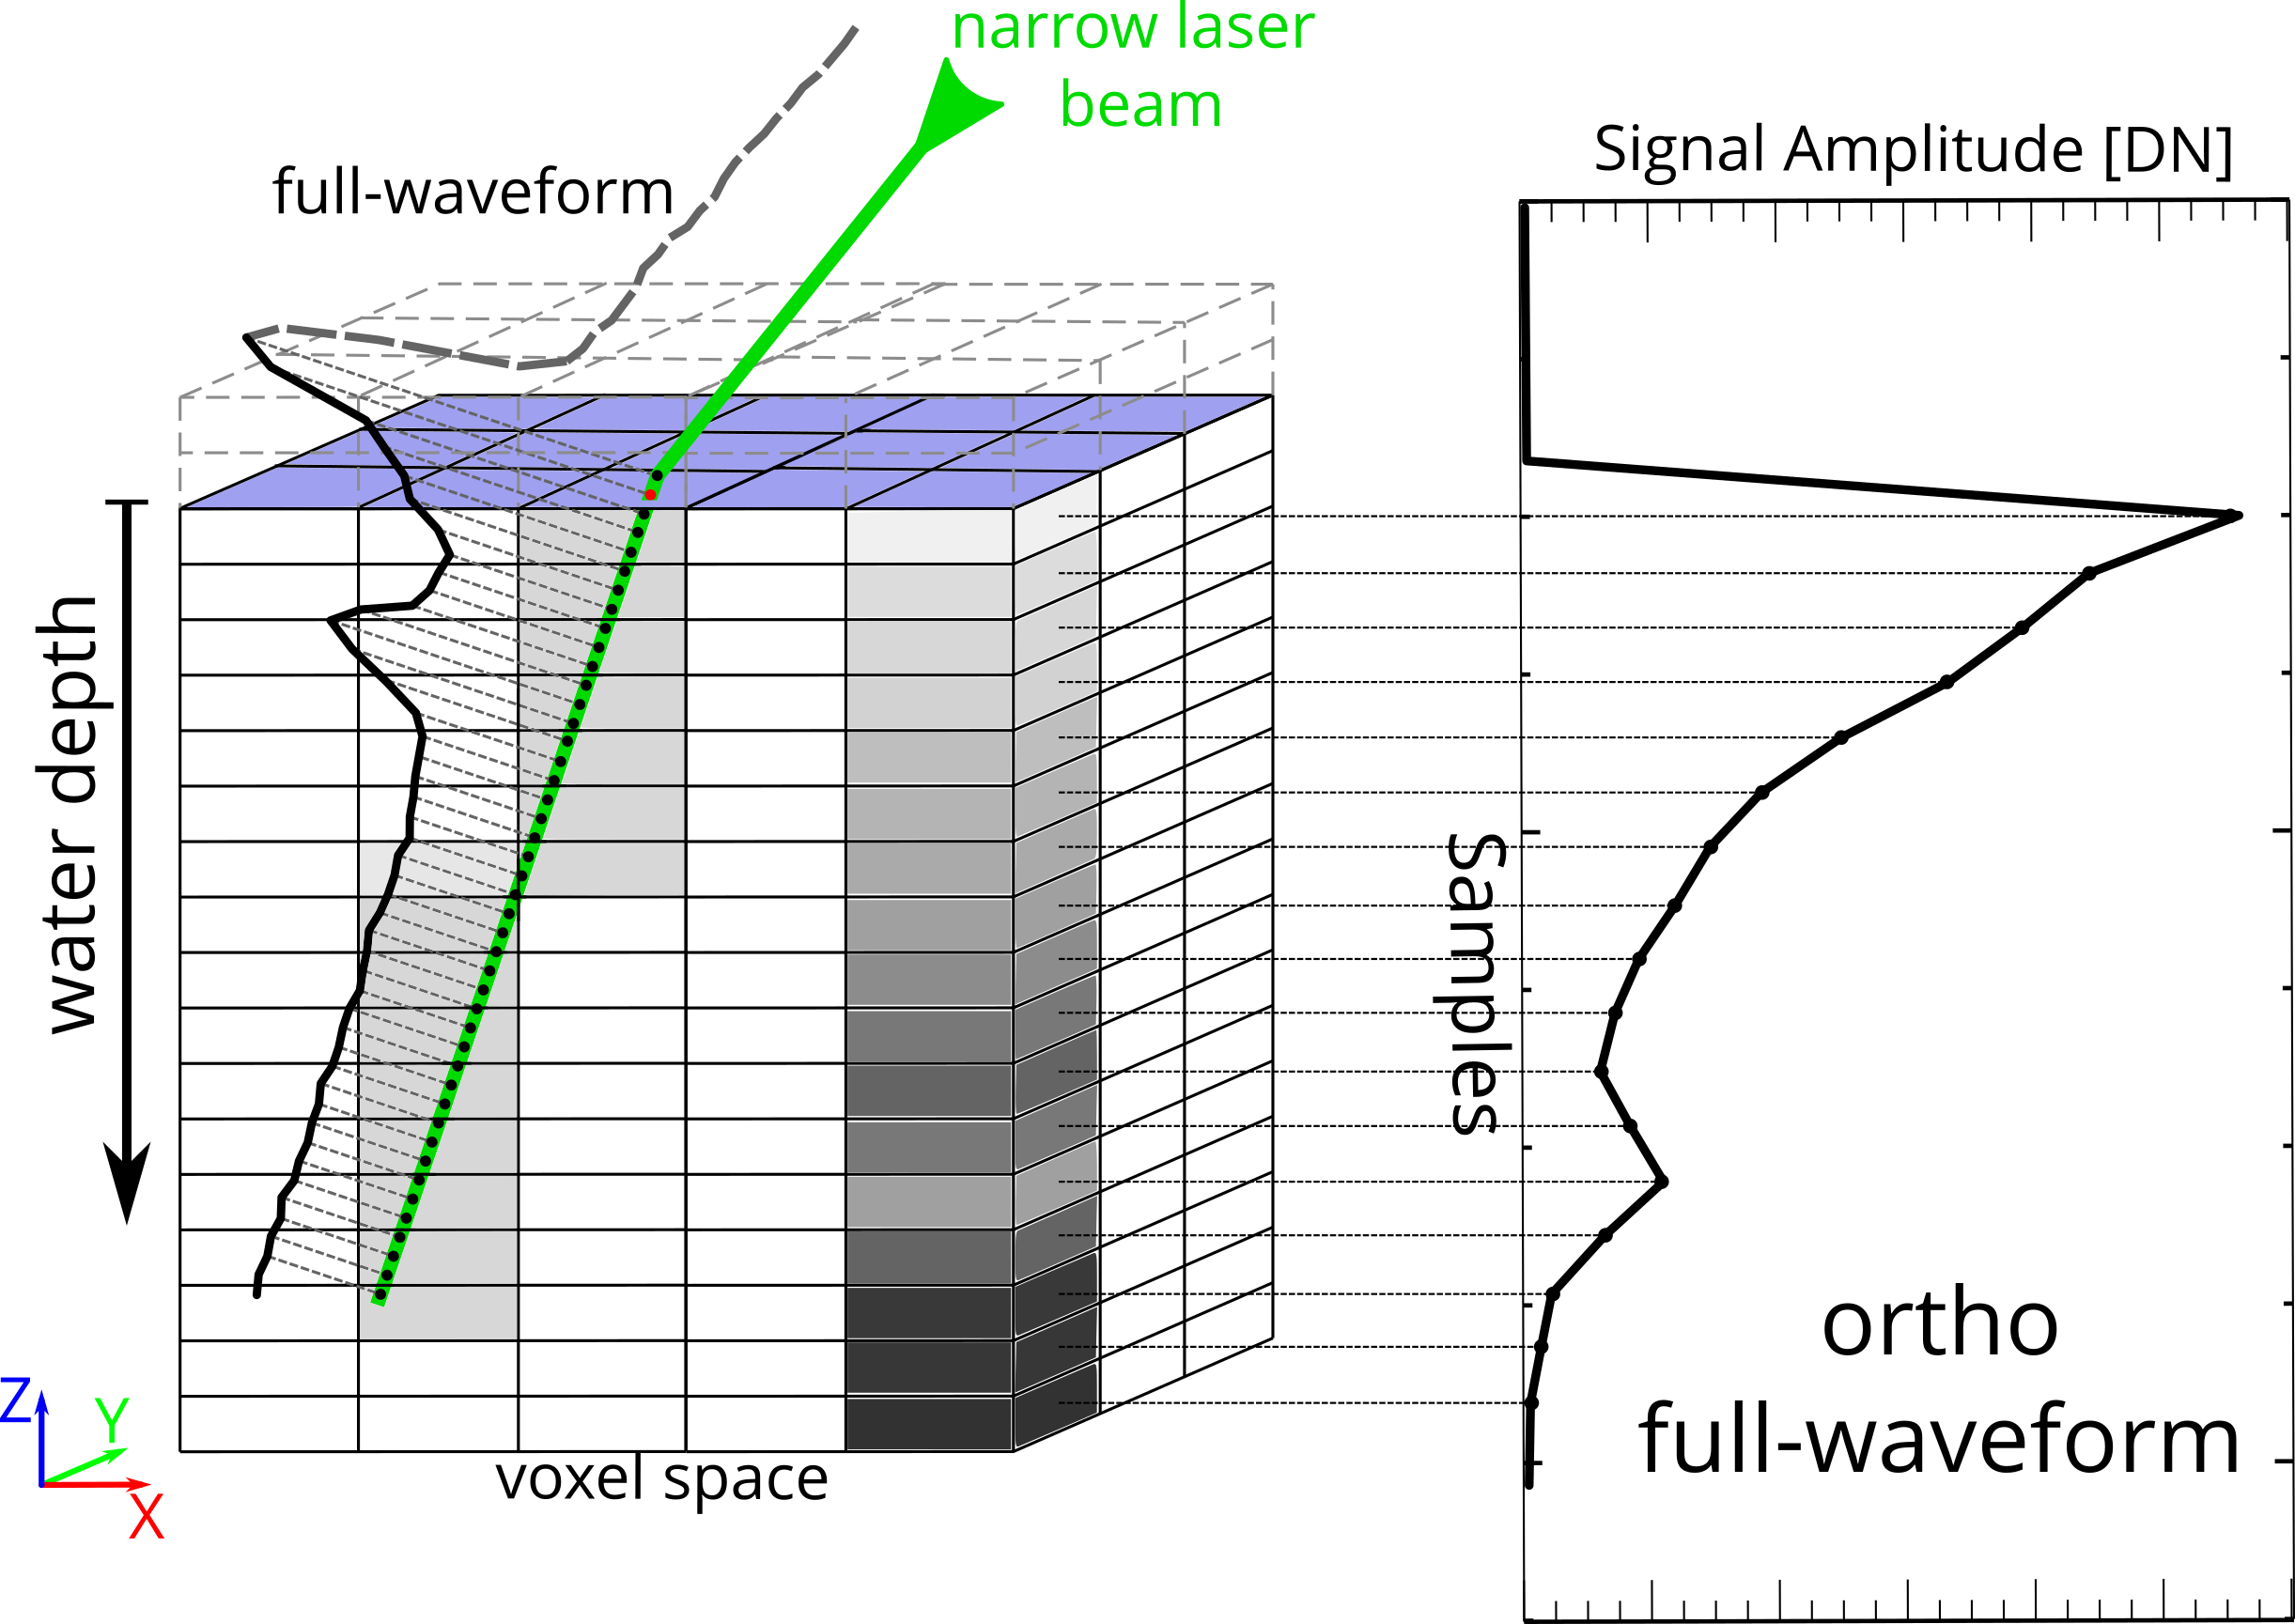
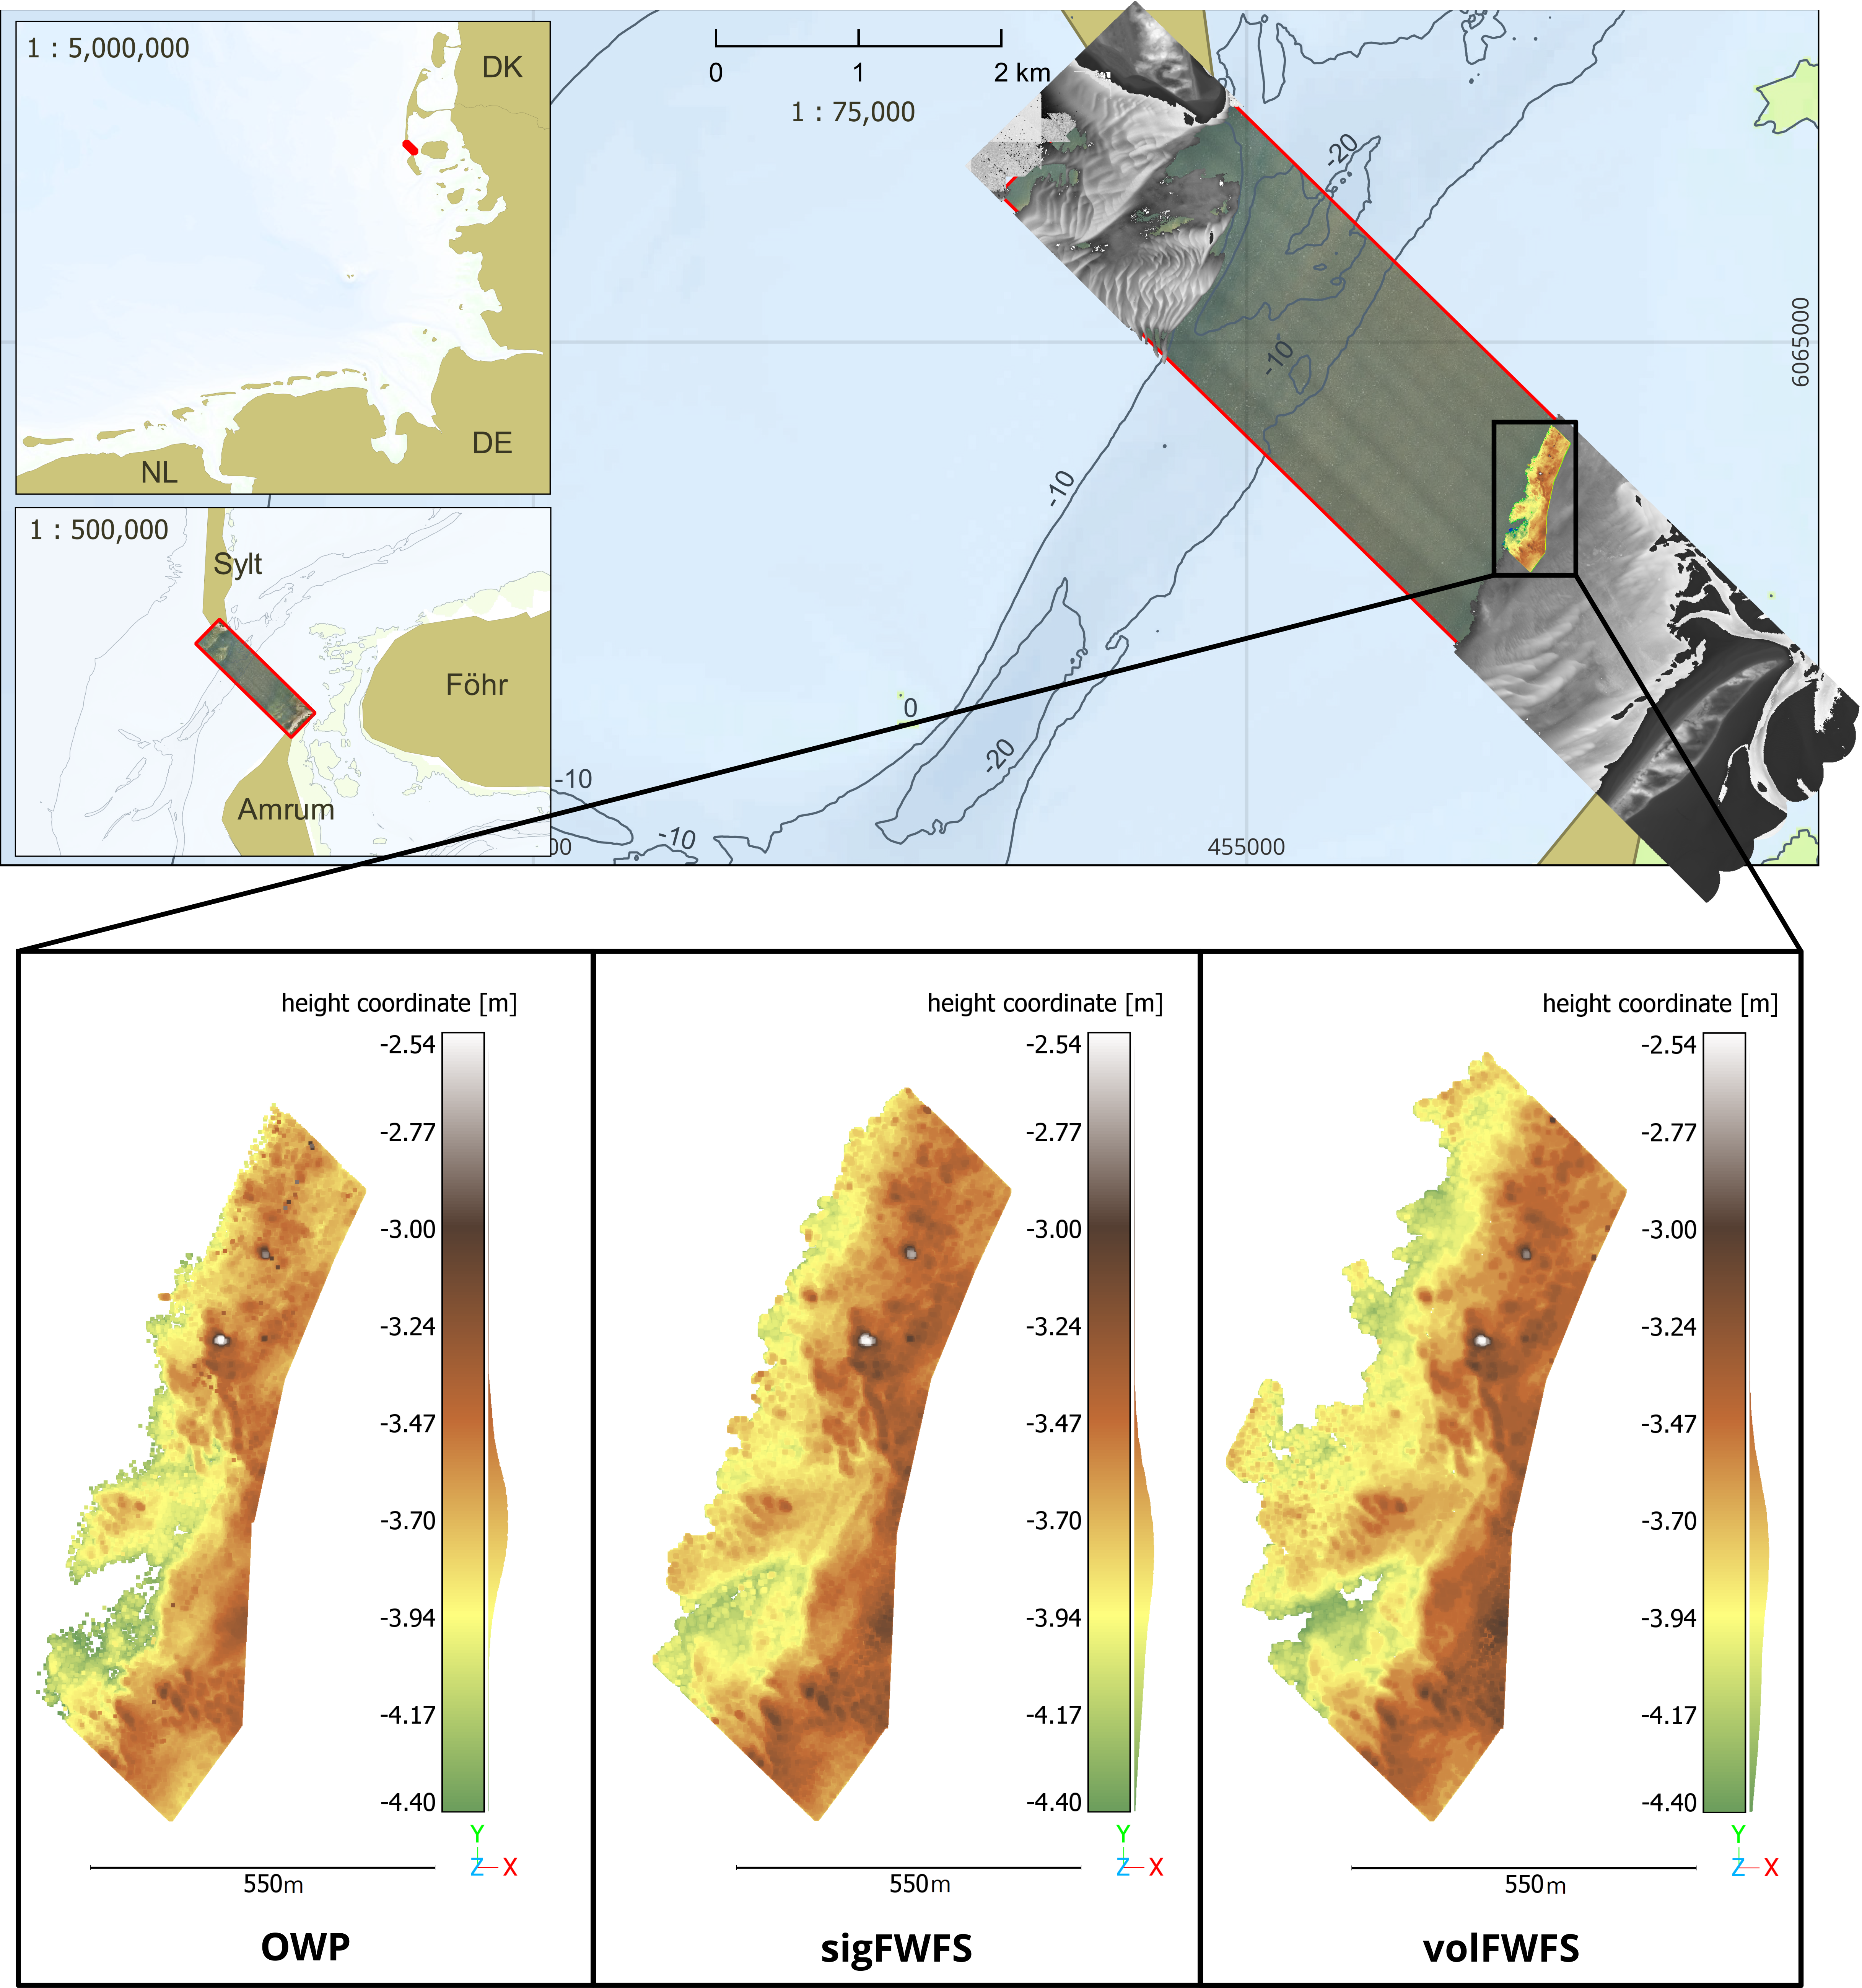
Depending on the water properties, suitable processing methods for ALB data, in particular FWF data, can significantly improve penetration depth and thus the acquisition of water bottom information. Two such processing methods are the signal-based full-waveform stacking (sigFWFS; Fig. 12; Mader et al., 2021) and the volumetric full-waveform stacking (volFWFS; Fig. 13; Mader et al., 2023a). Both approaches combine multiple adjacent FWF into a pseudo-waveform signal, assuming that closely spaced measurement signals have very similar characteristics in terms of water depth and FWF shape. The pseudo waveforms have a significantly improved signal-to-noise ratio, in consequence even weak water bottom echoes can be detected. Instead of simple averaging to avoid low pass filtering induced smoothing effects, a non-linear majority voting-based filtering techniques has been introduced (Mader et al., 2021). While sigFWFS focuses on the stacking of the FWFs themselves, volFWFS is based on the projection of the measured FWF data into a voxel space representation. Additional filtering methods increase the reliability of both methods significantly.
Both methods have been validated using ALB data from a part of an inland waterway, the Elbe River, and an area in the German North Sea (Fig. 14; Mader et al., 2021, 2023a, 2023b). The results show a significant improvement: Compared to standard data processing, the average penetration depth was increased by up to 33 % (from 1.65 m to 2.20 m) in inland waters and by 26 % (from 2.87 m to 3.62 m) in marine waters. This results in the coverage of a significantly larger area of the water bottom with measurement points. In the case of the Elbe River, the information on the riverbed was doubled. In the North Sea area, the value was lower at +14.6 %, but still represents a significant gain in water bottom information solely through enhanced data processing. Of course, the metrics of the information gained about the water bottom are dependent on the characteristics of the water, such as turbidity, and the nature of the bottom topography and can vary from water to water.
Hydroacoustic measurements were used for a quantitative validation of the FWF stacking results, confirming high accuracy and reliability achieved with the new methods for both the Elbe study area and the North Sea. The calculated RMS values are around 0.10 m for sigFWFS and volFWFS. Over 98% of the newly acquired points had an absolute height deviation of less than 0.25 m. These results demonstrate the good plausibility and reliability of the water bottom information gained through FWF stacking methods.
9 Quantification of water turbidity by volumetric analysis of LiDAR bathymetry data
Turbidity, an optical measure of water clarity, is a key water quality metric. It results from suspended inorganic and organic particles, as well as coloured dissolved materials that absorb and scatter light, reducing transparency. Turbidity levels can greatly vary within a water body, indicating factors like algae growth from fertilizers or sediment from erosion. These changes affect light transmission, impacting photosynthesis and predator visibility, making turbidity a vital environmental indicator.
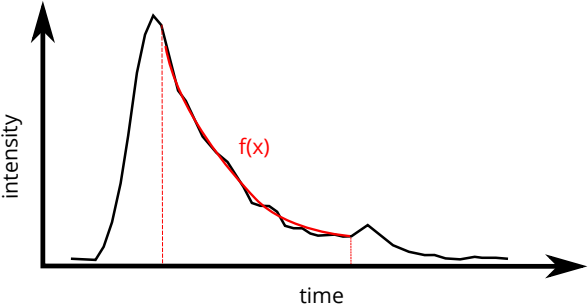
Conventional in-situ turbidity measurements are time-consuming and often only represent small areas. ALB offers a promising alternative since the measurement data not only provide detailed information about water depth but also capture valuable insights into water turbidity. Dissolved organic and inorganic particles influence the amount of laser energy that is backscattered, which in turn affects the shape of the recorded LiDAR full-waveform signal. By analysing the decay of the full-waveform signal, it is possible to comprehensively evaluate water turbidity. For this purpose, we have developed two methods: The Integral Turbidity Mapping (2D) and the Depth-Resolved Turbidity Mapping (3D). Both methods are applied to ortho full-waveforms, which are derived from volumetric reconstructions of the measurement data (Section 8).
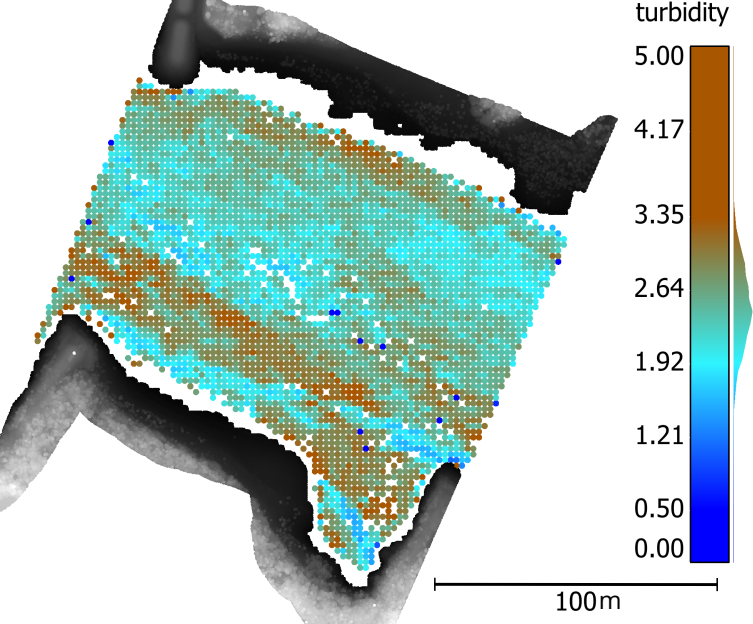
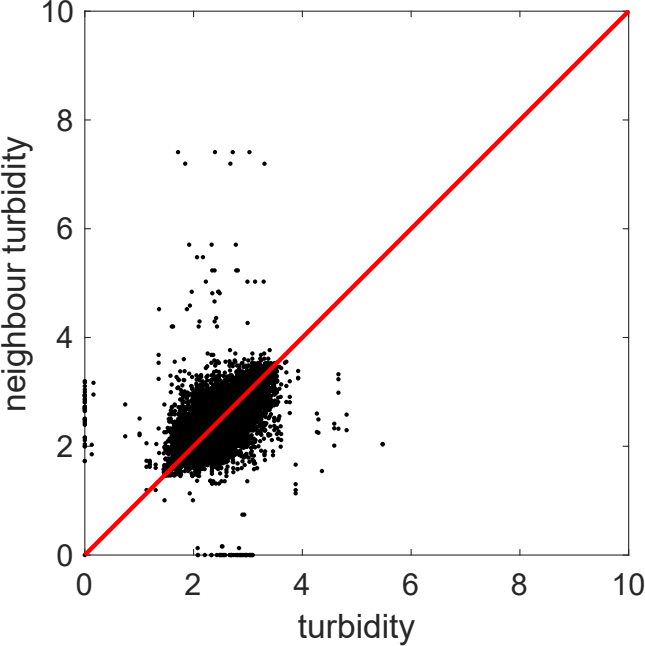
(a°In the Integral Turbidity Mapping approach (Richter et al., 2017, 2021), an exponential function is fitted into the water column part of the ortho full-waveform (Fig. 15a). The resulting exponential decay coefficient serves as a quantitative, integral, and non-metric indicator of water turbidity. This approach enables the extraction of 2D turbidity parameter fields from ALB data. Fig. 16a shows such a 2D turbidity parameter field in a study area of a shallow river. It can be seen that small-scale differences in flow velocity caused by the groynes lead to locally varying turbidity values. The results of the quantitative evaluation indicate that neighbouring full-waveforms yield similar turbidity values (Fig. 16b).
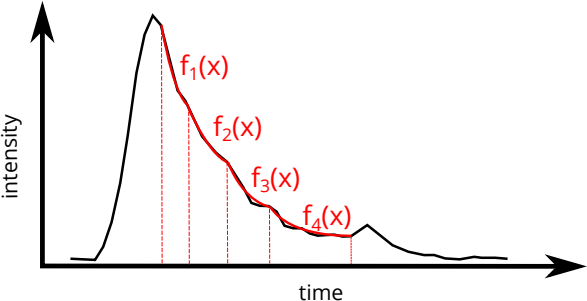
The Depth-Resolved Turbidity Mapping approach (Richter et al., 2022, 2024) enables the derivation of 3D turbidity parameter fields from small-footprint LiDAR bathymetry data. For this purpose, depth-resolved turbidity values are extracted for each water column segment of the ortho full-waveforms by fitting multiple exponential segments to the volume backscatter signal (Fig. 15b). Both the number of segments and the transition points between them are automatically determined from the dataset itself. The methodology was evaluated on a clear-water lake using UAV-based LiDAR bathymetry data. Fig. 3a shows an example of an ortho full-waveform in which three layers of varying turbidity were detected. For validation, an extensive set of conventional in-situ turbidity measurements was collected concurrently with the LiDAR survey (Fig. 17b). The comparison demonstrates strong agreement between the turbidity layers derived from the LiDAR data and those obtained from the reference measurements, confirming the reliability of the approach.
In summary, volumetric analysis of LiDAR bathymetry data enables detailed and spatially resolved turbidity quantification. Using both Integral and Depth-Resolved Turbidity Mapping, 2D and 3D turbidity fields can be generated, capturing lateral and vertical water quality variations. The strong correspondence with conventional measurements demonstrates the potential of these methods for efficient, large-scale aquatic monitoring.
10 Conclusion
The goal of the paper was to give a brief overview on some recent application of photogrammetric techniques in hydrographic environmental monitoring. Obviously, the list of applications shown in the paper is incomplete and does not claim to be representative. But the applications may give a glimpse into the large potential and the very wide range of applications of photogrammetric techniques in hydrographic measurement and monitoring tasks. Cameras and their periphery have become ubiquitous and ever cheaper, and so do small solid state LiDAR sensors, thus forming a basis for the configuration of manifold task-specific 2D or 3D spatio-temporal data acquisition systems. Subpixel accuracy image analysis techniques, combined with photogrammetric sensor modelling and calibration strategies, offer a very high accuracy potential, making even low-cost cameras a serious measurement tool. The use of such sensors for hydrographic monitoring tasks is further boosted by AI techniques increasingly facilitating the solution of complex image measurement tasks.
References
Anders, K., Winiwarter, L. and Höfle, B. (2021). Fully automatic spatiotemporal segmentation of 3D LiDAR time series for the extraction of natural surface changes. ISPRS Journal of Photogrammetry and Remote Sensing, 173, 297–308. https://doi.org/10.1016/j.isprsjprs.2021.01.015
Blanch, X., Grundmann, J., Hedel, R. and Eltner A. (2025): AI Image-based method for a robust automatic real-time water level monitoring: A long-term application case. Hydrology and Earth System Sciences – EGUSphere [preprint], https://doi.org/10.5194/egusphere-2025-724
Blanch, X., Jäschke, A., Elias, M. and Eltner, A. (2025). Subpixel automatic detection of GCP coordinates in time-lapse images using a deep learning keypoint network. IEEE Transactions on Geoscience and Remote Sensing, 63, 1–14. Error! Hyperlink reference not valid.Blaskow, R. and Schwalbe, E. (2021). Development of a low-cost, hand-held Multi-Sensor System for the Monitoring of small Water Bodies. The International Archives of Photogrammetry, Remote Sensing and Spatial Information Sciences, 43, 93–96. https://doi.org/10.5194/isprs-archives-XLIII-B1-2021-93-2021
Castano-Londono, L., Marrugo Llorente, S. D. P., Paipa-Sanabria, E., Orozco-Lopez, M. B., Fuentes Montaña, D. I. and Gonzalez Montoya, D. (2024). Evolution of Algorithms and Applications for Unmanned Surface Vehicles in the Context of Small Craft: A Systematic Review. Applied Sciences (2076-3417), 14(21). https://doi.org/10.3390/app14219693
Eltner, A., Kaiser, A., Abellan, A. and Schindewolf, M. (2017). Time lapse structure-from-motion photogrammetry for continuous geomorphic monitoring. Earth Surface Processes and Landforms, 42, 2240–2253. https://doi.org/10.1002/esp.4178
Elias, M., Eltner, A., Liebold, F. and Maas, H.-G. (2020). Assessing the influence of temperature changes at the geometric stability of low-cost chip cameras. Sensors, 20(3), 643. https://doi.org/10.3390/s20030643
Elias, M., Weitkamp, A. and Eltner, A. (2023). Multi-modal image matching to colorize a SLAM based point cloud with arbitrary data from a thermal camera. ISPRS Open Journal of Photogrammetry and Remote Sensing, 9, 100041, https://doi.org/10.1016/j.ophoto.2023.100041
Eltner, A., Sardemann, H. and Grundmann, J. (2020). Technical Note: Flow velocity and discharge measurement in rivers using terrestrial and UAV imagery. Hydrology and Earth System Sciences, 24, 1429–1445, https://doi.org/10.5194/hess-24-1429-2020
Eltner, A., Bressan, P., Goncalves, W., Akiyama, T. and Marcato Junior, J. (2021). Using deep learning for automatic water level measurement. Water Resources Research, 55(3), e2020WR027608, https://doi.org/10.1029/2020WR027608
Grundmann, J., Eltner, A., Blanch, X., Kutscher, A. and Hedel, R. (2024). Zum Einsatz künstlicher Intelligenz für die optische Bestimmung von Wasserstand und Durchfluss in natürlichen Fließgewässern. Von der Technischen Hydromechanik zu Environmental Fluid Dynamics – Dresdner Wasserbauliche Mitteilungen, 72, 11–18. https://hdl.handle.net/20.500.11970/113728
Guenther, G. C. and Goodman, L. R. (1978). Laser Applications for Near-Shore Nautical Charting. Proceedings of SPIE, The International Society for Optical Engineering/Proceedings Of SPIE, 0160, 174–183. https://doi.org/10.1117/12.956863
Guenther, G. C. (1985). Airborne laser hydrography: system design and performance factors [Technical Report, National Oceanic and Atmospheric Administration Rockville MD].
Guenther, G. C., Cunningham, A. G., LaRocque, P. E. and Reid, D. J. (2000). Meeting the accuracy challenge in airborne bathymetry [Technical Report, National Oceanic Atmospheric Administration / NESDIS Silver Spring, MD].
Hendriks, H., Van Prooijen, B., Aarninkhof, S. and Winterwerp, J. (2020). How human activities affect the fine sediment distribution in the Dutch Coastal Zone seabed. Geomorphology, 367, 107314. https://doi.org/10.1016/j.geomorph.2020.107314
Kirillov, A., Mintun, E., Ravi, N., Mao, H., Rolland, C., Gustafson, L. and Xiao, T. (2023). Segment Anything. https://arxiv.org/abs/2304.02643 (last accessed 4 October 2025).
Krüger, R., Blanch, X., Grundmann, J., Al-Rawas, G. and Eltner, A. (2024). Low-Cost sensors for measuring wadi discharge – a Raspberry Pi based seismometer and time-lapse camera setup. ISPRS Archives, XLVIII-2/W8-2024, 243–250, https://doi.org/10.5194/isprs-archives-XLVIII-2-W8-2024-243-2024
Kubicki, A., Manso, F. and Diesing, M. (2006). Morphological evolution of gravel and sand extraction pits, Tromper Wiek, Baltic Sea. Estuarine Coastal and Shelf Science, 71(3–4), 647–656. https://doi.org/10.1016/j.ecss.2006.09.011
Lague, D., Brodu, N. and Leroux, J. (2013). Accurate 3D comparison of complex topography with terrestrial laser scanner: Application to the Rangitikei canyon (New Zealand). ISPRS Journal of Photogrammetry and Remote Sensing, 82, 10–26. https://doi.org/10.1016/j.isprsjprs.2013.04.009
Lotsari, E., Hackney, C., Salmela, J., Kasvi, E., Kemp, J., Alho, P. and Darby, S. E. (2020). Sub-arctic river bank dynamics and driving processes during the open-channel flow period. Earth Surface Processes and Landforms, 45(5), 1198–1216. https://doi.org/10.1002/esp.4793
Luhmann, T., Fraser, C. and Maas, H.-G. (2016). Sensor modelling and camera calibration for close-range photogrammetry. ISPRS Journal of Photogrammetry and Remote Sensing, 115, 37–46, https://doi.org/10.1016/j.isprsjprs.2015.10.006
Maas, H.-G., Mulsow, C., Wendt, A., and Casassa, G (2012). Pilot Studies with a Photogrammetric Glacier Lake Outburst Flood Early Warning System. Int. Arch. Photogramm. Remote Sens. Spatial Inf. Sci., XXXIX-B5, 523–527. https://doi.org/10.5194/isprsarchives-XXXIX-B5-523-2012
Mandlburger, G., Rhomberg-Kauert, J., Gueguen, L.-A., Mulsow, C., Brezovsky, M., Dammert, L., Haines, J., Himmelsbach, T., Schulte, F., Amon, P., Winiwarter, L., Jutzi, B. and Maas, H.-G. (2025). Mapping shallow inland running waters with UAV-borne photo and laser bathymetry. The Pielach River showcase. Journal of Applied Hydrography, 130(3), 42–54, https://doi.org/10.23784/HN130-06
Mader, D., Richter, K., Westfeld, P. and Maas, H.-G. (2021). Potential of a non-linear Full-Waveform stacking technique in airborne LiDAR bathymetry. PFG – Journal of Photogrammetry, Remote Sensing and Geoinformation Science, 89(2), 139–158. https://doi.org/10.1007/s41064-021-00147-y
Mader, D., Richter, K., Westfeld, P. and Maas, H.-G. (2023a). Volumetric Nonlinear Ortho Full-Waveform Stacking in Airborne LiDAR Bathymetry for Reliable Water Bottom Point Detection in Shallow Waters. ISPRS Journal of Photogrammetry and Remote Sensing, 204, 145–162. https://doi.org/10.1016/j.isprsjprs.2023.08.014
Mader, D., Richter, K., Westfeld, P., Nistad, J.-G. and Maas, H. (2023b). Analysis of the potential of full-waveform stacking techniques applied to coastal airborne LiDAR bathymetry data of the German Wadden Sea National Park. The International Hydrographic Review, 29(2), 46–64. https://doi.org/10.58440/ihr-29-2-a31
Mader, D., Richter, K., Sardemann, H. and Maas, H.-G. (2024). Erprobung von UAV-basierter Laserbathymetrie an einem alpinen Bergsee. DGPF-Jahrestagung 2024 (44. Wissenschaftlich-Technische Jahrestagung der DGPF), 295–309.
Mulsow, C., Mandlburger, G. and Maas, H.-G. (2020). Comparison of Subaquatic Digital Elevation Models from Airborne Laser Scanning and Imagery. ISPRS Ann. Photogramm. Remote Sens. Spatial Inf. Sci., V-2–2020, 671–677.
Mulsow, C., Sardemann, H., Gueguen, L.-A., Mandlburger, G. and Maas, H.-G. (2024). Concepts for compensation of wave effects when measuring through water surfacesin photogrammetric applications. The International Archives of the Photogrammetry, Remote Sensing and Spatial Information Sciences, XLVIII-2-2024, 289–295, https://doi.org/10.5194/isprs-archives-XLVIII-2-2024-289-2024
Richter, K., Maas, H.-G., Westfeld, P. and Weiß, R. (2017). An approach to determining turbidity and correcting for signal attenuation in airborne lidar bathymetry. PFG–Journal of Photogrammetry, Remote Sensing and Geoinformation Science, 85(1), 31–40. https://doi.org/10.1007/s41064-016-0001-0
Richter, K., Mader, D., Westfeld, P. and Maas, H.-G. (2021). Water turbidity estimation from lidar bathymetry data by full-waveform analysis–comparison of two approaches. The International Archives of the Photogrammetry, Remote Sensing and Spatial Information Sciences, 43, 681–688. https://doi.org/10.5194/isprs-archives-XLIII-B2-2021-681-2021
Richter, K., Mader, D., Westfeld, P. and Maas, H.-G. (2022). Determination of 3D Water turbidity parameter fields from LiDAR bathymetry data by volumetric data analysis. The International Archives of the Photogrammetry, Remote Sensing and Spatial Information Sciences, 43, 945–951. https://doi.org/10.5194/isprs-archives-XLIII-B2-2022-945-2022
Richter, K., Mader, D., Sardemann, H. and Maas, H.-G. (2024). UAV-based LiDAR Bathymetry at an Alpine Mountain Lake. The International Archives of the Photogrammetry, Remote Sensing and Spatial Information Sciences, 48, 341–348. https://doi.org/10.5194/isprs-archives-XLVIII-2-2024-341-2024
Sardemann, H., Eltner, A. and Maas, H.-G. (2018). Acquisition of Geometrical Data of Small Rivers with an Unmanned Water Vehicle. Int. Arch. Photogramm. Remote Sens. Spatial Inf. Sci., XLII–2, 1023–1027. https://doi.org/10.5194/isprs-archives-XLII-2-1023-2018
Sardemann, H., Mulsow, C. and Maas, H.-G. (2022). Accuracy Analysis of an Oblique Underwater Laser Lightsheet Triangulation System. PFG 90, 3–18. https://doi.org/10.1007/s41064-022-00196-x
Sardemann, H., Blaskow, R. and Maas, H.-G. (2023). Camera-aided Orientation of Mobile Lidar Point Clouds Acquired from an Uncrewed Water Vehicle. Sensors, 23(13), 6009. https://doi.org/10.3390/s23136009
Sardemann, H., Mulsow, C., Gueguen, L.-A., Mandlburger, G. and Maas, H.-G. (2024). Multimedia Photogrammetry with non-planar Water Surfaces – accuracy analysis on simulation basis. Int. Arch. Photogramm. Remote Sens. Spatial Inf. Sci., XLVIII-2-2024. https://doi.org/10.5194/isprs-archives-XLVIII-2-2024-363-2024
Schwalbe, E. and Maas, H.-G. (2017). The determination of high-resolution spatio-temporal glacier motion fields from time-lapse sequences. Earth Surf. Dynam., 5, 861–879. https://doi.org/10.5194/esurf-5-861-2017
Ulm, M., Elias, M., Eltner, A., Lotsari, E. and Anders, K. (2025). Automated change detection in photogrammetric 4D point clouds: Transferability and extension of 4D objects-by-change for monitoring riverbank dynamics using low-cost cameras. Applied Geomatics. https://doi.org/10.1007/s12518-025-00623-9
Wagner, F., Eltner, A. and Maas, H.-G. (2023). River Water Segmentation in Surveillance Camera Images: A Comparative Study of Offline and Online Augmentation using 32 CNNs. International Journal of Applied Earth Observation and Geoinformation, 119, 103305. https://doi.org/10.1016/j.jag.2023.103305
Wright, L. D. and Thom, B. G. (2023). Coastal Morphodynamics and Climate Change: A Review of Recent Advances. Journal Of Marine Science and Engineering, 11(10), 1997. https://doi.org/10.3390/jmse11101997
Zamboni, P., Blanch, X., Marcato Jr., J., Goncalves, W. and Eltner, A. (2025). Do we need to label large datasets for river water segmentation? Benchmark and stage estimation with minimum to non-labeled image time series. International Journal of Remote Sensing, 46(7). https://doi.org/10.1080/01431161.2025.2457131
Authors’ biographies

Prof. Dr. sc. techn. habil. Hans-Gerd Maas is professor of Photogrammetry at TU Dresden, involved both in research and teaching. His research focus is on the integration of imaging sensors (both cameras and lidar) and processing algorithms for the development of efficient solutions for new challenging measuring tasks in high-resolution spatio-temporally resolved 3D data acquisition, combined with strict geometric and stochastic sensor modelling and calibration for optimizing solutions. He has been involved in several collaborative research centers and research training groups and was former president of ISPRS Technical Commission V.
Robert Blaskow is a research associate at the Institute of Photogrammetry and Remote Sensing at the TU Dresden. His research interests include the development of efficient monitoring methods for water bodies and water-related infrastructure using mobile laser scanning and unmanned aerial vehicles (UAVs). He is currently working on a project focusing on optical 3D measurement methods for generating, updating and acquiring condition data for digital twin models of bridges.

Prof. Dr.-Ing. Melanie Elias is professor of Geovisualisation at HTW Dresden since August 2025. From 2014–2025 she was research associate at TU Dresden, contributing to projects on intelligent patient positioning, glacier monitoring, river‑change detection, crowdsourced hydrology networks. She earned her Ph.D. in 2021 on smartphone‑based photogrammetric water‑level measurement via crowdsourcing. Her work focuses on multiscale 3D/4D reconstruction from terrestrial, UAV, aerial and satellite data, advanced spatiotemporal visualisation, and low‑cost AR‑enabled environmental monitoring tools.
Dr.-Ing. David Mader is a PostDoc at the Institute of Photogrammetry and Remote Sensing at the TU Dresden. In 2022, he received his Ph.D. on novel methods for the analysis of airborne LiDAR bathymetry data. In this context, he developed full-waveform stacking techniques for the detection of weak water-bottom echoes in airborne LiDAR bathymetry. His research focuses on improved derivation of water bottom topography from airborne LiDAR bathymetry data, enabling an efficient monitoring of shallow water areas of rivers, lakes and oceans.
Christian Mulsow began his career as a surveying technician at a private company in Rostock. After completing his degree in Geodesy in 2003, he joined the Institute of Photogrammetry and Remote Sensing at TU Dresden as a technical assistant. His research interests include developing methods for compensation and modelling of refraction in close-range applications. In recent years, he has focused his research on optical bathymetry of inland waters, particularly from UAVs..

Dr.-Ing. Katja Richter is a research associate at the Institute of Photogrammetry and Remote Sensing at the TU Dresden. In 2018, she received her Ph.D. on the topic “Analysis of full-waveform airborne laser scanner data for volumetric representation in environmental applications”. Her research interests include the development of novel data analysis techniques in airborne LiDAR bathymetry with a particular focus on deriving high spatial resolution water turbidity parameters and increasing the accuracy potential of the measuring method.
Hannes Sardemann, Ph.D. has a B.Sc. in Geodesy and Geoinformation from the University of Bonn and a M.Sc. in Geodesy from TU Dresden. In 2023 he finished his Dr.-Ing. on photogrammetry from an uncrewed water vehicle. His current research focuses on through-water-photogrammetry with wavy water surfaces.

Dr.-Ing. Ellen Schwalbe studied Geodesy at TU Dresden from 1998 to 2003. Since 2004, she has been a research associate at the Institute of Photogrammetry and Remote Sensing at TU Dresden. In 2013, she received her PhD with a dissertation on the development of methods for deriving high spatio-temporal resolution motion vector fields of glaciers from monoscopic image sequences. Since then, she has been involved as a postdoctoral researcher in several projects, with a particular focus on environmental monitoring.
Jun.-Prof. Dr.-Ing. Anette Eltner is Junior Professor for Geosensor Systems at TU Dresden. She studied Geography at TU Dresden and obtained her PhD on photogrammetric methods for soil erosion assessment. Her research focuses on high-resolution sensing and photogrammetric techniques for geomorphology, hydrology, and environmental monitoring. She has authored 94 scientific publications (59 peer-reviewed journal papers) and serves as Chief Editor of Geoscientific Instrumentation, Methods and Data Systems.