


Abstract
1 Introduction
In 2018, the operational draft at the Port of Santos was increased by 30 centimeters. The São Paulo State Dock Company (CODESP) estimated a 10 % increase in the company’s revenue, in the order of USD 435 million per year. According to CODESP, this increase was made possible by two main factors: dredging services and the technology used for depth monitoring, which includes studies on fluid mud (Carneiro, 2018).
According to the United States National Oceanic and Atmospheric Administration (NOAA), an additional inch of draft allows a ship to gain up to USD 60,000 in additional cargo capacity (NOAA, 2025a). In ports, channels, and waterways where the fluid mud layer reaches significant thickness, this gain goes beyond economic values and represents strategic advantages in market competition and in efforts to reduce the cost of goods reaching the general public.
Chamanmotlagh et al. (2024) report that the Port of Emden (Germany) has areas where the fluid mud layer can reach 4.5 meters. In the Port of Zeebrugge (Belgium), the layer thickness reaches 3 meters in some stretches and 2 meters at the port entrance (Vanlede et al., 2019). In the Europort (Netherlands), up to 2 meters of maximum draft are achieved by conditioning the mud with a water injection process and using the definition of nautical depth (Kiricheck & Rutgers, 2020). The competitive gains of these ports, and many others in Europe, are remarkable.
If mud with the right consistency to be considered navigable is found in a channel, and correctly measured, that channel may require less dredging to maintain operational parameters. Poorly defined nautical depths can lead to unnecessary dredging or to navigation restrictions (PIANC, 2014). There are also other reasons for studying and measuring the fluid mud layer in a port: it can affect ship maneuverability, dynamic draft, buoyancy, and make the bottom harder to detect by navigation echo sounders.
Characterizing and measuring the fluid mud layer is complex due to the large volume of material, the biological, physical, and chemical properties of sediments, and their interaction with the environment – influenced by currents, tides, wind-driven turbulence, temperature variations, mixing of fresh and saltwater, rainfall, among other factors. In addition, human activities such as ship movements, dredging, and the discharge of treated water affect the maintenance and/or changes in the fluid mud layer.
Characterizing fluid mud and using it to define operational port parameters has been a well-established practice in American and European ports and waterways for decades (Kirby et al., 1980; Teeter et al., 1992; Wurpts & Torn, 2005). However, these technologies have often faced resistance from government agencies responsible for permits and authorizations, though they have been adopted gradually. The safety-efficiency dilemma has increasingly been resolved by the integration of both through the use of techniques and technology.
The objective of this study is to review methods in ports with significant amounts of unconsolidated suspended mud, analyze the hydrographic and sedimentological surveys carried out in the Port of São Francisco do Sul (Brazil), and propose a method for defining the fluid mud layer and the nautical bottom, in accordance with PIANC (2014). Defining the nautical bottom is essential to optimize both navigation safety and port operational efficiency.
There are huge challenges to introduce and implement the nautical bottom concept in the Brazilian ports. In the forefront are the lack of government agencies support and the reduced critical mass in ports and universities. Additionally, there is little awareness on the directions to follow, linked to the two challenges above mentioned. Uncertainties in the short and long runs would make it difficult to secure investments to establish the necessary infrastructure (equipment, vessels, laboratories) in a country with an area larger than the European countries (except the Russian part but including Greenland) combined. Brazil is also home to large river systems, with an estimated 42,000 km of navigable inland waterways.
2 Background
According to McAnally et al. (2007), fluid mud is a high concentration of fine sediments in which sedimentation is substantially hindered by the closeness of sediment grains with flocs, and which has not yet formed an interconnected matrix with bonds strong enough to eliminate its potential mobility. Local characteristics can favor the maintenance of sediments in suspension and prevent them from consolidating into a material with high viscosity. However, the definition of fluid mud is not universally established, nor are its measurement methods, since both depend on local characteristics and management needs.
Greiser et al. (2002) point out that an important component of fluid mud is organic matter, which can account for more than 60 % of the in-situ mud particle volume, being responsible for particle aggregation and stabilization of the internal structure of the fluid mud. The particles remain suspended for long periods due to their low density and the buoyancy of the flocs (Wurpts & Torn, 2005; Shakeel et al., 2022).
In the United States, fluid mud conditions are more frequent in districts of warmer regions and are more prevalent in estuaries where mineral-rich freshwater mixes with saltwater. In these places, mineralogical flocculation of freshwater sediments is accelerated when the sediment reaches saltwater. These flocculants are very loose aggregates with a water content equal to or greater than 95 % and can remain suspended for long periods (USACE, 2013).
Measuring the thickness of the fluid mud layer is a necessary challenge. When the upper layer of sediment is not well consolidated, the three methods normally used by the U.S. Army Corps of Engineers (USACE) – sounding pole, lead line, and acoustic echo sounder – will generally not correlate with each other and may not even give consistent readings from one moment to the next when using the same instrument or technique (USACE, 2013).
The concentration of sediment in water reduces the propagation speed of sound, which can significantly affect acoustic measurements with echo sounders. USACE (2013) correctly points out that in unconsolidated bottoms – that is, fluid mud – records cannot be reliably interpreted without some form of correlated or corroborative information. The echo sounder alone is not enough to monitor fluid mud, neither for navigation nor for port management.
Various methods and equipment are used to measure the thickness and navigability of fluid mud. The lower limit of navigable mud is defined as the nautical bottom (PIANC, 2014). One technique is to measure the in-situ sediment density, and there are different methods to perform this task. According to Claeys (2006), it is possible to distinguish methods as
- remote sensing with echo sounding (acoustic density profile, based on acoustic impedance transitions), and
- profiling with point measurement devices using instruments based on Gamma-ray, tuning fork, and acoustics.
However, a single critical density value cannot always be chosen as the criterion for the nautical bottom (Shakeel et al., 2019). Yield stress is an important discontinuity in the transition between fluid and solid mud, and it can also be a parameter to specify the nautical depth, as used in the Port of Emden (Wurpts & Torn, 2005). Yield stress and density are two essential rheological characteristics for determining nautical depth in the Port of Hamburg (Shakeel et al., 2022). Therefore, multi-criteria approaches – such as combining rheological and echo sounding criteria – can be used to determine nautical depth, depending on the local characteristics.
As fluid mud approaches the consolidation point, its yield stress increases, and its viscosity rises sharply. Beyond the consolidation point, mud can behave like a weak gel or a soft solid. There is no single formula that universally relates all these properties, but rheological tests (e.g., rheometer measurements) help identify the critical yield stress or density that marks the consolidation point. By evaluating rheological properties of fluid mud samples through tuning fork data, Fonseca et al. (2018) describe the functioning of the Densitune, a model similar to the one used in this study.
Carneiro et al. (2017) evaluated strategies for measuring fluid mud layers and their rheological properties in the Port of Santos, where up to 1.4 m of fluid mud was found, with a critical density of 1,200 kg/m³. The Port of Emden in Germany defined the mud layer with a yield stress of 100 Pa as the navigable depth (Wurpts & Torn, 2005). Adopting 100 Pa as a reference for the Port of Santos, critical densities would range from 1,200 to 1,275 kg/m³. Using 1,200 kg/m³ was thus a safer choice for the moment. Carneiro (2018) notes that the critical density of 1,200 kg/m³ is also used in the ports of Rotterdam and IJmuiden (Netherlands), Bangkok (Thailand), and Nantes-Saint-Nazaire and Bordeaux (France).
An important aspect of fluid mud studies is its impact on ship maneuverability. According to Verwilligen et al. (2014), a full-mission maneuvering simulator study was carried out in the Zeehavenkanaal for access to the Port of Delfzijl (Netherlands) and showed the possibility of working with a nautical bottom located lower than the top of the mud layer. This allowed the port to receive ships with greater draft without additional dredging. To validate the simulator study conclusions, full-scale ship maneuvering tests were performed with a general cargo vessel departing from the port.
In all simulations at Delfzijl, pilots managed to carry out maneuvers acceptably. It was concluded that maneuvers at that port, with vessels navigating with small negative under keel clearance (UKC) relative to the top of a fluid mud layer, were acceptable, provided the pilots had experience with local conditions and were aware of the effects of the mud-water interface on ship handling. It is noteworthy that this channel is about 3.2 nautical miles long.
The above aspects show the possibility and complexity of measuring, mapping, and using the fluid mud layer to improve navigation safety and port operation efficiency. Consequently, the U.S. and many European countries have structures that allow fluid mud navigation to be managed by specialized agencies and ports with competent hydrography services. In the U.S., for example, USACE is responsible for the subject – not the three agencies representing the country at the International Hydrographic Organization (IHO): NOAA’s Office of Coast Survey, the National Geospatial-Intelligence Agency, and the Navy’s Meteorology and Oceanography Command (IHO, 2025).
In Belgium, France, Germany, Netherlands, and UK, for example, ports and their approaches are the responsibility of port authorities, which carry out surveys and decide on fluid mud navigation, not the hydrographic services represented at the IHO. Austria and Switzerland carry out surveys and nautical charting of their navigable channels and are not IHO Member States. In these countries and in the U.S., agencies and port authorities decide on fluid mud navigation, advised by pilotage services, due to local knowledge and operational needs that cannot be delegated to organizations without such knowledge or vested interest in operations.
These aspects stem from the fact that the IHO does not focus exhaustively on surveys in estuarine regions with high sediment loads. This is due to historical reasons linked to governmental organization in Europe and the U.S., where the IHO headquarters is located. Most IHO Presidents (now Secretary-Generals) and Directors have come from these regions. Currently (2025), the representatives are from Germany, the U.S., and Italy. Furthermore, for most of its existence, the IHO has focused on surveys for nautical charting.
For example, the NOAA Field Procedures Manual and the Hydrographic Survey Specifications and Deliverables (2021, 2025b) do not mention “fluid mud”, while this is extensively covered in USACE (2013). Survey specifications in areas with fluid mud depend on the location and are subject to the considerations of each USACE district.
The very creation of the IHO in 1921 was driven by the need to sound and map the oceans in support of international navigation. This began to change when IHO Member States realized the value of Hydrography beyond nautical charting and navigation safety. The publication of S-44 Edition 6.0.0 (IHO, 2020a) marked a new era for survey standardization. But even in this standard, there is no aim to standardize surveys in waters with high sediment loads. However, the IHO Hydrographic Manual (IHO, 2011) presents a broader view, recommending the use of low-frequency echo sounders – though this was not incorporated into current versions of S-44 (IHO, 2024). The reason is that this publication presents survey standards without specifying the technology.
The comments above are not a criticism of the functioning of the IHO and the hydrographic services of its Member States, but simply an observation, since setting universal standards for such heterogeneous environments is often not a tangible goal. Nautical charting is inherently international, and worldwide adoption of standards requires very restrictive approaches. Particularities of each estuarine environment with high sediment loads must be addressed locally, as is the case in Babitonga Bay.
3 Literature review on navigable mud layer measurement
Among the many academic studies, some have been selected for review, particularly due to their connections with the agencies and port authorities involved. References from these articles were used in this study to provide a basis for the analytical method, as well as for the conclusions and recommendations. Not all the references easily apply to the present case. Some of them, like those involving rheological properties, will take time to prove to port authorities and other governmental agencies that they bring value and are worth investments.
3.1 Effects of recirculation dredging on the density, strength, settling, and oxygen concentration of fluid mud in the Port of Emden (Chamanmotlagh et al., 2024)
A bathymetric mapping was carried out using a dual-frequency single-beam echo sounder Kongsberg EA 440. The lutocline (fluid mud–water interface) and the fluid mud-bed interface were detected at 200 kHz and 15 kHz, respectively. According to the EA 440 manual, the accuracy of this dual-frequency echo sounder depends on pulse length, being 0.6 cm for 200 kHz and 4.9 cm for 15 kHz. In-situ vertical profiles of density and yield stress were obtained using a Rheotune from Stema. This tool has often been used to quantify strength and density properties of fluid mud for nautical bottom applications (Kirichek & Rutgers, 2020).
In field surveys, density increased significantly with depth, consistent with the natural sedimentation process observed in fluid mud environments. This phenomenon is attributed to the settling of denser particles towards the bottom due to gravity, resulting in a stratified density gradient. From the consolidation point onward, density alone was not considered an adequate criterion for the nautical bottom, as material strength could vary significantly. Using only sediment density as a navigation criterion may overlook the complexity of mud, where similar densities do not guarantee identical yield stresses (Kirichek et al., 2018a; Kirichek & Rutgers, 2020; Shakeel et al., 2021). Consequently, the authors conclude that both density and yield stress are important criteria for defining the nautical bottom.
3.2 Study of fluid mud layers in ports and navigation channels (Carneiro, 2018)
Fluid mud does not behave according to Newton’s Law (classical fluid) nor Hooke’s Law (classical soil mechanics). Due to high sediment concentrations, it exhibits non-Newtonian rheological properties. While Newtonian fluids have well-defined viscosity, non-Newtonian fluids have viscosity that varies with shear rate. For the Port of Emden, sediments with a yield stress lower than 100 N/m² were defined as navigable. In Itajaí (Brazil), the critical density was adopted as the parameter for navigable fluid mud, defined as 1,300 kg/m³. This density is higher than that used in other ports, which usually ranges between 1,200 and 1,250 kg/m³. According to Pion & Alfredini (2019), the Port of Itajaí has a 50 cm fluid mud layer throughout the area of interest, with some places reaching up to 2.5 m thickness.
The author concludes that combining survey strategies such as acoustic methods, density measurements, and laboratory tests – such as granulometry and rheological properties – is better for navigation purposes when defining the nautical bottom, instead of relying solely on echo sounders. As in solutions already used in major ports worldwide, defining the fluid mud layer can reduce dredging, among other advantages.
A study was conducted in the Port of Santos, the busiest and largest port in Brazil. Due to the extension of the port and its access channel, there is spatial and temporal variability, with the thickness of fluid mud layers increasing towards the inner parts of the port, accompanied by a decrease in sand content. The study was carried out along a 3 km linear transect. During a tidal cycle, the minimum thickness occurred at slack water. The study concluded, among other things, that the critical density for the Port of Santos should be 1,200 kg/m³, allowing up to 1.4 m of navigable fluid mud. It is important that the nautical bottom criterion considers not only rheology and echo sounding but also environmental and port-related parameters and pilot training.
3.3 Fluid mud properties and nautical depth estimation: A case study in navigation channel of Duyen Hai Port, Viet Nam (Nguyen & Le, 2023)
The authors argue that most navigation channels worldwide choose the rheological parameter of fluid mud density to determine nautical depth. This guideline was applied in 18 ports, with the density criterion ranging from 1,150 to 1,300 kg/m³. However, density alone is not a sufficient criterion to predict the rheology of different muds. Therefore, a single critical density value cannot be chosen for the nautical bottom criterion (Shakeel et al., 2019, 2022).
The authors also note that yield stress is an important discontinuity in the transition between fluid, pre-consolidated, and solid mud. In many ports, yield stress is the parameter specifying nautical depth, including in the Port of Emden (Wurpts & Torn, 2005). The combination of density and yield stress are two essential rheological characteristics for determining nautical depth in the Port of Hamburg (Shakeel et al., 2022). The authors conclude that multi-criteria approaches, combining rheology and echo sounding, should be used to determine nautical depth.
3.4 Current surveying strategies in ports with fluid mud layers (Kirichek et al., 2018a)
This article provides an overview of survey strategies that are or can be used in ports and waterways with fluid mud layers. The combination of acoustic methods with others based on density or shear strength measurements is discussed. Typically, fluid mud can be described as a mixture of water, organic matter, and mainly cohesive mineral sediment, generally found in estuaries and rivers with low-intensity currents. Fluid mud is in a transitional state and will eventually settle and consolidate over time, unless disturbed by dredging, currents, or other mechanical processes.
Traditional acoustic bathymetry often fails to detect a sharp interface between fluid mud and consolidated bed. Fluid mud layers can be substantially thick, with small density gradients within the layer. These gradients are often insufficient for detecting acoustic impedance differences. Therefore, other strategies have been developed for surveying ports and waterways with fluid mud layers.
The authors prepared a schematic concept of the nautical bottom (Fig. 1). Applying these definitions requires understanding the physical characteristics of mud and how mud layers affect vessel behavior. Based on experimental research in the Port of Rotterdam in 1974, a density of 1,200 kg/m³ was chosen as the physical characteristic defining the nautical bottom. In other ports, this density value varies from approximately 1,150 to 1,300 kg/m³, or the nautical bottom is defined by echo sounding or rheological criteria.
Kirichek et al. (2018a) gives an overview of different methods for assessing the density and rheological properties of the mud. Due to the non-linear relationship between density and the mud strength, the approach for defining practical criteria for port authorities should be investigated in laboratory in order to assess the best set of parameters. The approach could include the relationship of this set of parameters and acoustic methods.

3.5 Conducting surveys in fluid mud (Buchanan, 2008)
Larry Buchanan, from Teledyne Odom Hydrographic, discusses the challenges of conducting surveys in fluid mud environments. An expert in acoustic propagation and echo sounders, he explains how fluid mud affects acoustic signals, including propagation speed, transmission losses, and reflectivity. He also discusses the dilemmas in selecting the appropriate frequency for an echo sounder in such environments.
USACE (2013) acknowledges this dilemma: In general, higher-frequency transducers (100 kHz to 1,000 kHz) will provide more accurate depth measurements due to frequency characteristics and narrower beam widths. A major disadvantage of high-frequency transducers is that there is high signal attenuation with depth, and low-density suspended sediments or bottom vegetation will readily reflect the signal.
High-frequency transducers are not recommended in areas where suspended sediment layers commonly occur. In these areas, frequencies between 20 kHz and 50 kHz are typically used to define dredging volumes. The manual also correctly states that in unconsolidated bottoms – that is, fluid mud – records cannot be reliably interpreted without correlated or corroborative information.
Recognizing that acoustic sensor information alone is not sufficient to establish safe navigation depth in a channel when fluid mud or suspended materials are present in the water column, there has been a search for tools to confirm depths recorded by the echo sounder and for determining nautical depth. When a ship passes through a fluid mud layer, external forces affect its control and maneuverability. The rheology of fluid mud, like that of any real liquid, is defined by its viscosity – its ability to deform and reshape. The direct influence of this property on a vessel’s safe navigation makes it an excellent factor to help determine nautical depth.
The difficulty, however, is that the viscosity of the material is not easily obtained in real time. Often, samples must be collected and sent to a laboratory for analysis. The need for real-time, continuous monitoring requires near-immediate results. There are several density-measuring devices capable of determining fluid mud density levels in real time. Once the rheological properties of materials in a specific location are established, appropriate density levels can be determined as safe navigation levels, for determining nautical depth. Generally, these density-measuring devices are directly connected to an existing echo sounder or provide their own specific acoustic signal.
In most cases, calibration is carried out to establish material properties, after which density levels can be determined during hydrographic survey operations. Once established, calibration values for a location change little, if at all. Only periodic confirmation of calibration values is needed. The range of acceptable density levels varies widely from port to port. Studies indicate that the critical nautical bottom density ranges from 1,150 kg/m³ in Zeebrugge (Belgium) to 1,270 kg/m³ in Cayenne (French Guiana)1. A typical echo sounder record also allows identification of the fluid mud layer when compared to other bottom types. This makes determining nautical depth simpler and certainly more accurate.
As seen in the above studies, there is a variety of sensors and techniques to address the definition of the nautical bottom and nautical depth. It is also understandable that the local environmental characteristics pose a challenge for port authorities and that they require especial consideration in the selection of the sensors and techniques to assess the parameters that will deliver safety of navigation and efficient port operations.
4 Analysis of standards and guidelines for surveys and projects involving fluid mud
In general, the standards of the IHO, adopted in Brazil by the Directorate of Hydrography and Navigation, are the obvious references for guiding hydrographic surveys in the country. Although the IHO has evolved its standards, as mentioned in Section 2, the focus on hydrographic surveys in areas with high sediment concentration and on defining the nautical bottom has not yet been – and perhaps never will be – incorporated into its objectives, particularly in the Standards for Hydrographic Surveys (IHO, 2024).
In this complex context of surveys in areas with fluid mud and high sediment loads, many other institutions have stood out in terms of standards and guidelines for surveys. The importance of the World Association for Waterborne Transport Infrastructure (PIANC) is noteworthy. The PIANC Report (2014) proposes guidelines and recommendations for the design of ports and their access channels, maneuvering areas, and anchorages. It also defines operational restrictions within a channel and provides guidelines for establishing requirements for depth, width, and other parameters.
One of the pillars of this manual (PIANC, 2014) is the establishment of the nautical bottom concept. It defines the nautical bottom as the level where physical characteristics of the bottom reach a critical limit beyond which contact with a ship’s keel causes either damage or unacceptable effects on controllability and maneuverability. Additionally, nautical depth is defined as the instantaneous and local vertical distance between the nautical bottom and the undisturbed free water surface.
A first step in this approach is to replace terms such as “bottom” and “depth” with the concepts of nautical bottom and nautical depth, which are more appropriate in fluid mud environments. In fact, in the zone between the water-mud interface and the hard bottom, the physical properties of the mud (density, rheological characteristics) change gradually with increasing depth. Therefore, the definition of the bottom must be based on local circumstances and intended application.
Implementing the nautical bottom approach is recommended in waterways and ports when fluid mud layers cover the bottom. If the water-mud interface is accepted as the bottom level, a reduction in UKC value can be allowed. Even navigation with a negative UKC relative to the interface can be considered, meaning that the ship’s keel is permanently in contact with mud. Selecting the water-mud interface as the reference bottom level in fluid mud locations can be questioned, as the bottom is neither clear nor easily defined.
Common bathymetric techniques, such as echo sounding, lead to interpretation problems in muddy areas: high-frequency signals reflect off the water-mud interface, while low-frequency waves penetrate the sediment deposit and may indicate a water depth greater than that actually shown on the nautical chart. Selecting the upper limit for the bottom may be safe, but can cause problems in waterway maintenance, since the water-mud interface level can show significant tidal and seasonal variations and is difficult to maintain using common dredging methods. It is also less efficient both for dredging and for achieving economic efficiency.
In practice, determining the nautical bottom is rarely done based on rheological measurements that require laboratory analysis. Most survey methods are based on the density parameter, which is simpler and easier to measure. Still, care should be taken by using absolute viscosity or yield stress values in addition to density. Anyhow, methods and parameters vary from place to place. Emden (Germany) uses maximum yield stress (100 Pa) as the parameter for defining the nautical bottom, while most ports around the world use density limits for the nautical bottom (Kirichek et al. 2018b). Yield stress is an important component in European countries, but it is rarely used in Brazilian ports, requiring more investigation on the impacts nationwise.
In the United States, the leading institution for conducting surveys and regulating navigation in channels and ports with fluid mud is the U.S. Army Corps of Engineers (USACE), which is responsible for dredging and surveys in coastal navigable channels and inland waterways. Conventional hydrographic surveys in areas with fluid mud can often result in ambiguous depth measurements due to its effects on mechanical (lead line) and acoustic techniques.
USACE recognized these effects as early as 1954 (PIANC, 2014), when it unsuccessfully tried to determine nautical depth by correlating lead line depths with echo sounder measurements. It has also investigated measuring nautical depth with towed devices (Teeter, 1992) and is continuously evaluating other established and emerging technologies for measuring fluid mud, defining nautical depth, and managing projects for a nautical depth policy.
The USACE Hydrographic Surveying Engineer Manual (USACE, 2013) emphasizes that it is unlikely that the nominal accuracy standards recommended in the manual can be achieved in projects containing fluid mud, suspended sediments, extreme tidal ranges, or highly irregular topography and geomorphology. In summary, the accuracy standards and the related performance tests for quality control and assurance described in the manual should be considered only as recommended guidelines.
According to USACE (2013), single beam systems are generally preferred in areas where fluid mud exists. Multibeam systems have bottom detection methods (amplitude, phase, interferometric) that vary with signal strength, automatic signal processing, incidence angle, manufacturer, and other factors. In such areas, depth measurements may not be consistent from one survey to another, between different systems, or even within the same system at different beam angles. The USACE Manual also correctly points out that in unconsolidated bottoms – that is, fluid mud – records cannot be reliably interpreted without correlated or corroborating information (Buchanan, 2008).
The NOAA Office of Coast Survey does not explicitly regulate surveys in fluid mud areas, as seen in its two main publications – the Hydrographic Survey Specifications and Deliverables (NOAA, 2025b) and the Field Procedures Manual (NOAA, 2021). The other U.S. agencies working in Hydrography – the National Geospatial-Intelligence Agency and the Naval Meteorology and Oceanography Command – have their own internal operational regulations.
Some remarks on the IHO are relevant. The IHO Standards for Hydrographic Surveys, Publication S-44 Edition 6.2.0 (IHO, 2024), refer to fluid mud only when discussing acoustic backscatter. Regarding depth determination, it states: In waters of very high turbidity, such as estuaries, for example, this minimum depth can be determined based on sediment concentrations in the water. This sediment concentration can be measured through water density using a densimeter. However, there is no specific reference to echo sounder frequency – which is expected, as the publication aims to be technology-independent. Nevertheless, special and exclusive orders can only be achieved with high-frequency multibeam operations (coverage, accuracy, propagated uncertainties), without taking into account surveys in non-Newtonian fluids such as fluid mud.
The IHO Manual on Hydrography, Publication C-13 (IHO, 2011), provides some guidelines on conducting surveys in sediment-rich areas. It specifies that the frequencies for sediment echo sounders are below 8 kHz and that the use of dual-frequency echo sounders allows the separation of the seabed return from the soft surface sediments and the underlying rock due to their different acoustic impedances. It goes further in recommending the use of dual frequency echo sounder in shallow areas of unconsolidated sediments to differentiate soft sediments from the bed rock.
In Brazil, hydrographic surveys require authorization by the Brazilian Hydrographic Service, operated by the Directorate of Hydrography and Navigation (DHN) of the Brazilian Navy. The IHO S-44 publication is the basis for the Brazilian Maritime Authority Standards for Hydrographic Surveys (NORMAM, 2023a). Reflecting the limitations presented earlier, Brazilian standards do not refer to surveys in fluid mud areas and prohibit the use of single-beam echo sounders for Category “A” surveys (those that will be used to update nautical charts), not taking into account the technical progress of the institutions mentioned in this report. This may seem like criticism, but it is not: the Brazilian Hydrographic Service must regulate surveys on a national scale where there are no significant local particularities. In such locations, local authorities – such as port and waterway authorities – should be responsible for surveying standards considering local characteristics of those areas.
5 Surveys conducted in the Port of São Francisco do Sul (Brazil)
5.1 Characterization of the area of interest
The area of interest for this study comprises Berth 301 of the Terminal Santa Catarina (TESC), located within the port complex of São Francisco do Sul, in the Babitonga Bay. This bay is an estuarine complex located in the northern part of the State of Santa Catarina, between latitudes 26º07’ and 26º27’ S. It is the largest estuary in the state and contains its most extensive mangrove area. Morphologically, it features a main channel oriented NE/SW, approximately 3.8 km wide, 24 km long and reaching depths of up to 28 m, as well as two elongated axes oriented SE/NW.
The bottom sediments can be grouped into two distinct classes, based on their biodetritic carbonate composition: lithoclastic and lithobioclastic sediments. The bottom sediments range from fine sand (sediments composed of 100 % sand) to various levels of muddy deposits. The climate is temperate (humid mesothermal with hot summers) and is influenced by both polar and tropical Atlantic air masses. Average monthly temperatures range between 15–18 °C in winter and 24–26 °C in summer. Relative humidity, also under maritime influence, reaches an annual average of 80%.
The area is under a microtidal regime (amplitude < 2 m), of a mixed, predominantly semidiurnal type, with unequal high and low tides. The average tidal range is about 0.85 m, reaching a maximum of 1.28 m during spring tides and a minimum of 0.27 m during neap tides. Current measurements showed a peak instantaneous velocity of approximately 1.76 m/s during the ebb tide of a spring tide, aligned with the main channel axis (Vieira & Horn, 2017).
The turbidity in the investigation area, near TESC (Terminal Santa Catarina), is low, despite the presence of a fluid mud layer, due to the high rate of water renewal associated with the bay’s proximity to the ocean (Projeto Baías do Brasil, 2018). The salinity intrusion is also relevant near the TESC, which leads the water salinity to seawater levels. Far from the ocean, the bay receives fresh water from a significant drainage basin.
According to information obtained from TESC (2025), the berths have the following characteristics (Table 1). According to the Rules and Procedures of the Santa Catarina Port Captain (NPCP-SC, 2022), not to be confused with the Port Authority, the UKC at these berths ranges from 1.9 to 2.7 m, depending on the type of vessel.

Fig. 2 (nautical chart 1804 crop) shows an overview of the Babitonga Bay region, which contains the study area covered by this report. Fig. 3 presents the plan of nautical chart 1804, detailing the Port of São Francisco do Sul, with TESC highlighted in red, enclosing the three berths.
The reference depths for the berths in question were obtained from a hydrographic survey conducted by Hidrotopo in February 2025. The survey followed NORMAM (2023a) specifications for Category “A”. The minimum depth in the area was 13.5 meters for Berth 301 (Fig. 4). This depth updates the nautical chart for Berth 301. In the vicinity of the berth, the bottom description (“nature of the seabed”) is recorded as clay (Arg) and silt (Ld), with no rock (R) identified along Berth 301 (Fig. 3).
This survey represents the depth of the upper limit of the fluid mud layer, since the sharp density gradient from water to fluid mud (lutocline) provides a strong reflector for high-frequency echo sounders – as in the case of the system used at the berths, operating at 200 kHz. This same lutocline is not a strong reflector for frequencies of 24 or 33 kHz, which better detect the transition from fluid to consolidated mud (e.g., Chamanmotlagh et al., 2024; USACE, 2013).


5.2 Systems and subsystems used in the hydrographic survey
To assess the fluid mud layer at Berth 301, the deliverables of the hydrographic survey conducted by Hidrotopo during 27–29 April, 30 May – 2 June, and 15 July 2025 were analyzed. This survey was carried out from a manned vessel equipped with the following acquisition and data processing systems:
Positioning: Hemisphere VS330 GNSS receiver, with corrections via the Fugro Marinestar service, achieving horizontal accuracy of less than 10 cm (95 % confidence level; Fugro, 2025).
Motion sensor: TSS DMS-05 motion sensor for roll, pitch, and heave corrections applied to depths measured by the echo sounder, compensating for vessel motion.
Sound velocity profiler: AML-3 LGR sensor, providing sound speed in the water column for correcting echo sounder depth measurements.
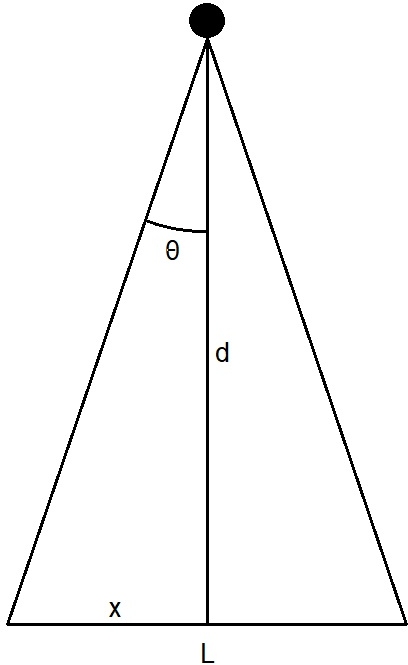
Acoustic bathymetry: Teledyne Odom Hydrographic Echotrac CVM dual-frequency single beam echo sounder (200 kHz and 24 kHz) with a OTSBB200/24-4/20 transducer. Fig. 5 and Table 2 summarize the bottom footprint according to beamwidth and typical berth depth.

Direct bathymetry: Hand lead line for depth measurement independently of the echo sounder.
Bottom sampling: Van Veen grab sampler with preliminary onboard analysis of seabed sediment. Characteristics such as texture, granulometry, composition, and color were noted according to IHO (2020b). Samplings were taken both to characterize the bottom and to calibrate the densimeter.
Water level monitoring: Pulsar Measurement dBi-T 6 sensor with Technolog Cello HDT-2 data logger for tidal height monitoring to reduce soundings.
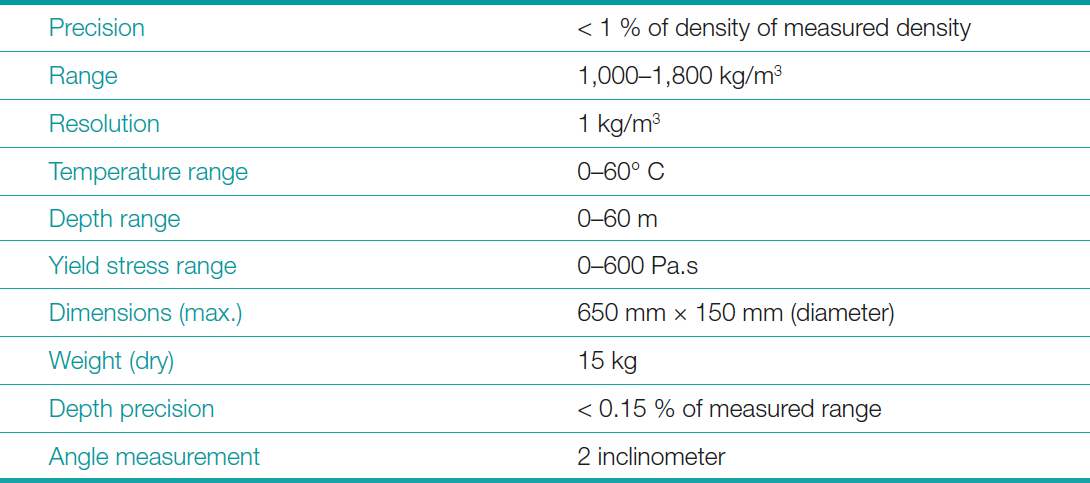
Densitometry: The density and yield stress of the mud, as a function of depth, were assessed using a non-radioactive densimeter, model DensiTune, manufactured by Stema Systems. These mud properties are used to aid in determining nautical depth. The equipment’s main technical specifications are summarized in Table 3.
DensiTune uses the tuning fork principle to derive density. The tuning fork probe consists of tines that are designed to vibrate at a specific frequency and amplitude. When a tuning fork is immersed in a fluid, the frequency and amplitude of the vibration changes due to the changes in mass, as it happens in the transition from water to the mud. This change in frequency and amplitude is proportional to the density changes and rheological properties of the substances, allowing the assessment of the mud density.
These frequency and amplitude changes are then correlated with the density of the material through a calibrated algorithm, providing a density measurement. The yield stress of the mud is also derived using this system. However, the focus of this work lays on the density and not the yield stress. Few Brazilian port authorities and research labs that work with fluid mud use density as the main parameter for the definition of the nautical bottom. There is very little critical mass both to produce the necessary knowledge and to consume it at the decision-making level.
As stated in PIANC (2014), fluid mud with low density has a viscosity and yield stress that are not, or only slightly, dependent on density. As a consequence, yield stress will be presented as information only and will be subject to further investigation in future works. Where density was monitored, the DensiTune also provided yield stress profiles for 10 and 100 Pa.
Before probing the bottom, the system has to be calibrated with a local fluid mud sample. This procedure was done at each density location and processed using the DensiCal software.
Yield stress refers to the minimum stress required to initiate flow in cohesive mud. It is a critical parameter for determining when mud begins to behave like a fluid, which is important in seabed assessments for navigational safety. When low resistance to ship motion is required, for example, to allow vessels to navigate safely through fluid mud layers, a low yield stress is desirable. Yield stress is used to define the seabed in some ports, and a limit of 25 Pa is common in international guidelines (PIANC, 2014), although higher values are also used. It is especially relevant for cohesive sediments, such as clay-rich mud, as it helps determine when the mud resists ship motion. This parameter will be further explored in future works.
Data acquisition and processing: Hypack system for bathymetry; Stema DensCal/DensLog for density and yield stress calibration, acquisition, and processing.
5.3 Survey planning and execution
The survey lines were established parallel to the pier housing Berths 300, 301, and 302, in a direction of 138°–218°, as shown in Fig. 3. The lines with the dual-frequency single-beam were planned at 10-m intervals, starting from the pier line. Considering the information shown in Table 2, the bottom coverage for the low-frequency sensor is equivalent to 45 % bottom coverage.
Sampling points for density, yield stress, hand lead depth, and sediment were selected to ensure adequate representation of the information. These points are represented in Fig. 6. These data are relevant to the area of interest (Berth 301), a subset of the data collected for other areas (berths 300 and 302) that may be addressed in future work. No additional points were collected near the pier at berth 301 due to the high occupancy rate of the berth.
The echo sounder was calibrated using bar check to ensure proper operation of the data acquisition system. All collected data was horizontally georeferenced to the WGS-84 system and converted to UTM (Universal Transverse Mercator) Zone 22, Southern Hemisphere, with the central meridian at 51º W.
Vertical coordinates, indicating depth, are all reduced to the chart datum (except in echograms, as discussed in item 6). All information in the survey and this report is referenced to Time Zone Papa, Greenwich Mean Time minus 3 hours (GMT-3).

6 Data analyses
6.1 Analysis of information and navigable mud measurements in the Port of São Francisco do Sul
Although this survey is part of a comprehensive campaign commissioned by TESC, this report primarily analyzes data related to Berth 301, as the objective is to evaluate the information needed to define the fluid mud layer and the nautical bottom at this area. These two elements will then used to assess the impact of the bottom on the port’s operational parameters and suggest measures to optimize these parameters, benefiting the efficiency of port operations and safety of navigation.
The survey used the chart datum defined in NORMAM (2023a) as a vertical reference. Tide height measurements were taken using the tide gauge installed at the TESC I Tide Gauge Station, located at the western end of Berth 101 of the port of São Francisco do Sul (Latitude 26° 13’ 58″ S and Longitude 048° 38’ 19″ W), whose data are recorded in Form F-41-Padrão-TESCI-60312 – version 1/2024.
The three phases of the survey took place from 27–29 April, 30 May – 2 June, and 15 July 2025. On the last day, two additional densimeter and lead line casts were carried out to complement the area of interest (Berth 301), since the area was already covered by a post-dredging multibeam survey in February 2025, and with this dual-frequency (200/24 kHz) single-beam survey. The choice for the 24 kHz frequency was due to its good correlation with density in this type of environment, tested in previous surveys in the Ports of São Francisco do Sul and Itajaí, both in the coast of the State of Santa Catarina.
Bottom samples were collected at points within the area of Berth 301 (points 01, 02 and 03), as well as at Berths 300 (points 04 and 05) and 302 (points 06, 07, 08), indicated in Fig. 7. The samples were described as clay with low-strength, high-plasticity, soft consistency, and brown color, consistent with the classification of nautical chart 1804 (plane) and with estuaries with fluid mud. According to Greer (2008), combinations of clay, silt and organic matter are commonly called mud. The samples were analyzed onboard the survey vessel, in accordance with NORMAM (2023a), and no additional analyses were performed due to the lack of resources and available laboratories. According with IHO (2011), grain size for clay is < 0.002 mm (very fine sediments). These analyses are consistent with the densimeter results for a fluid mud bottom. Future work will contemplate laboratory analysis for bottom samples.
This is consistent with the geotechnical report by CoastalPort Engenharia (CPE) No. CPE048-RL-001 (CPE, 2024). According to the report: During the geotechnical survey, all points penetrated 44.5 meters (the survey limit), without reaching the bedrock. A layer of compacted plastic sediment was observed, penetrating approximately 10 meters into the seabed.
The four survey points were located in the extension of the TESC pier, as shown in Fig. 8. These results are consistent with the observations and information collected in the hydrographic survey, that did not find evidence of bedrock.
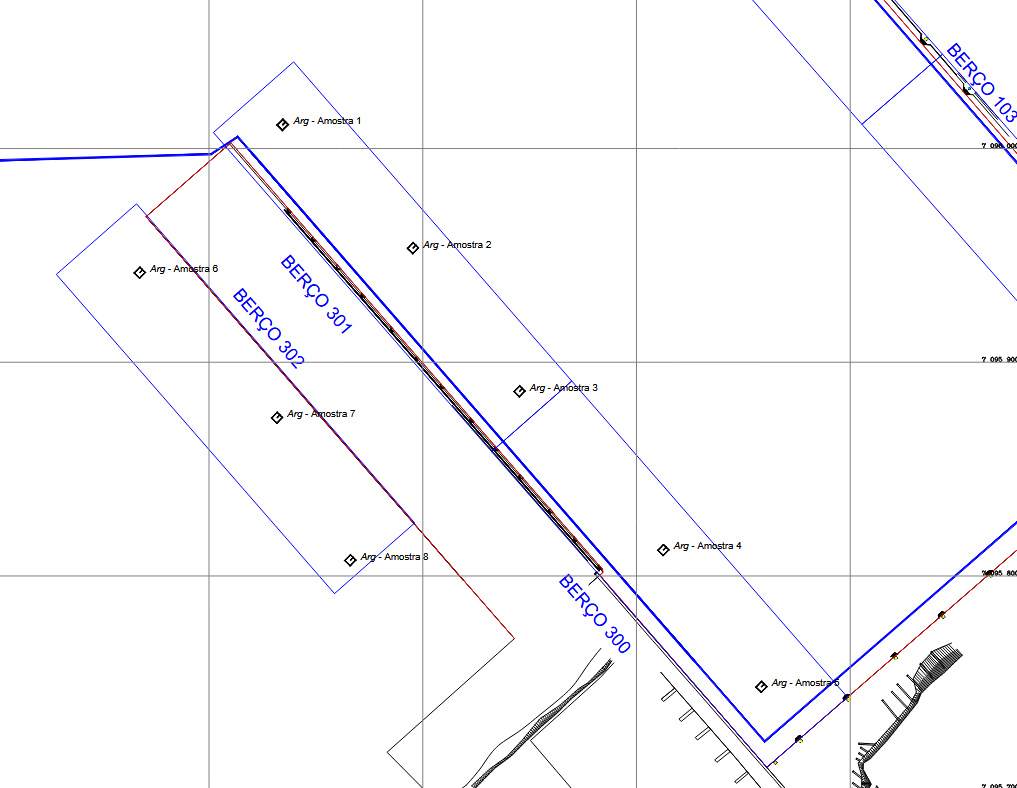
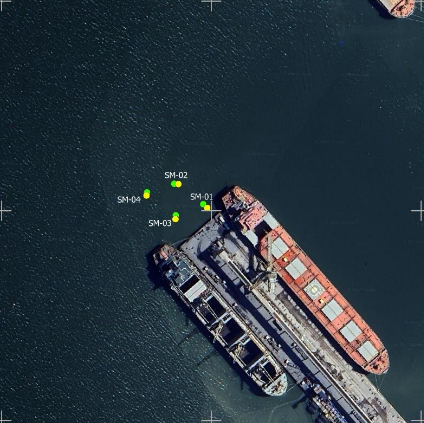
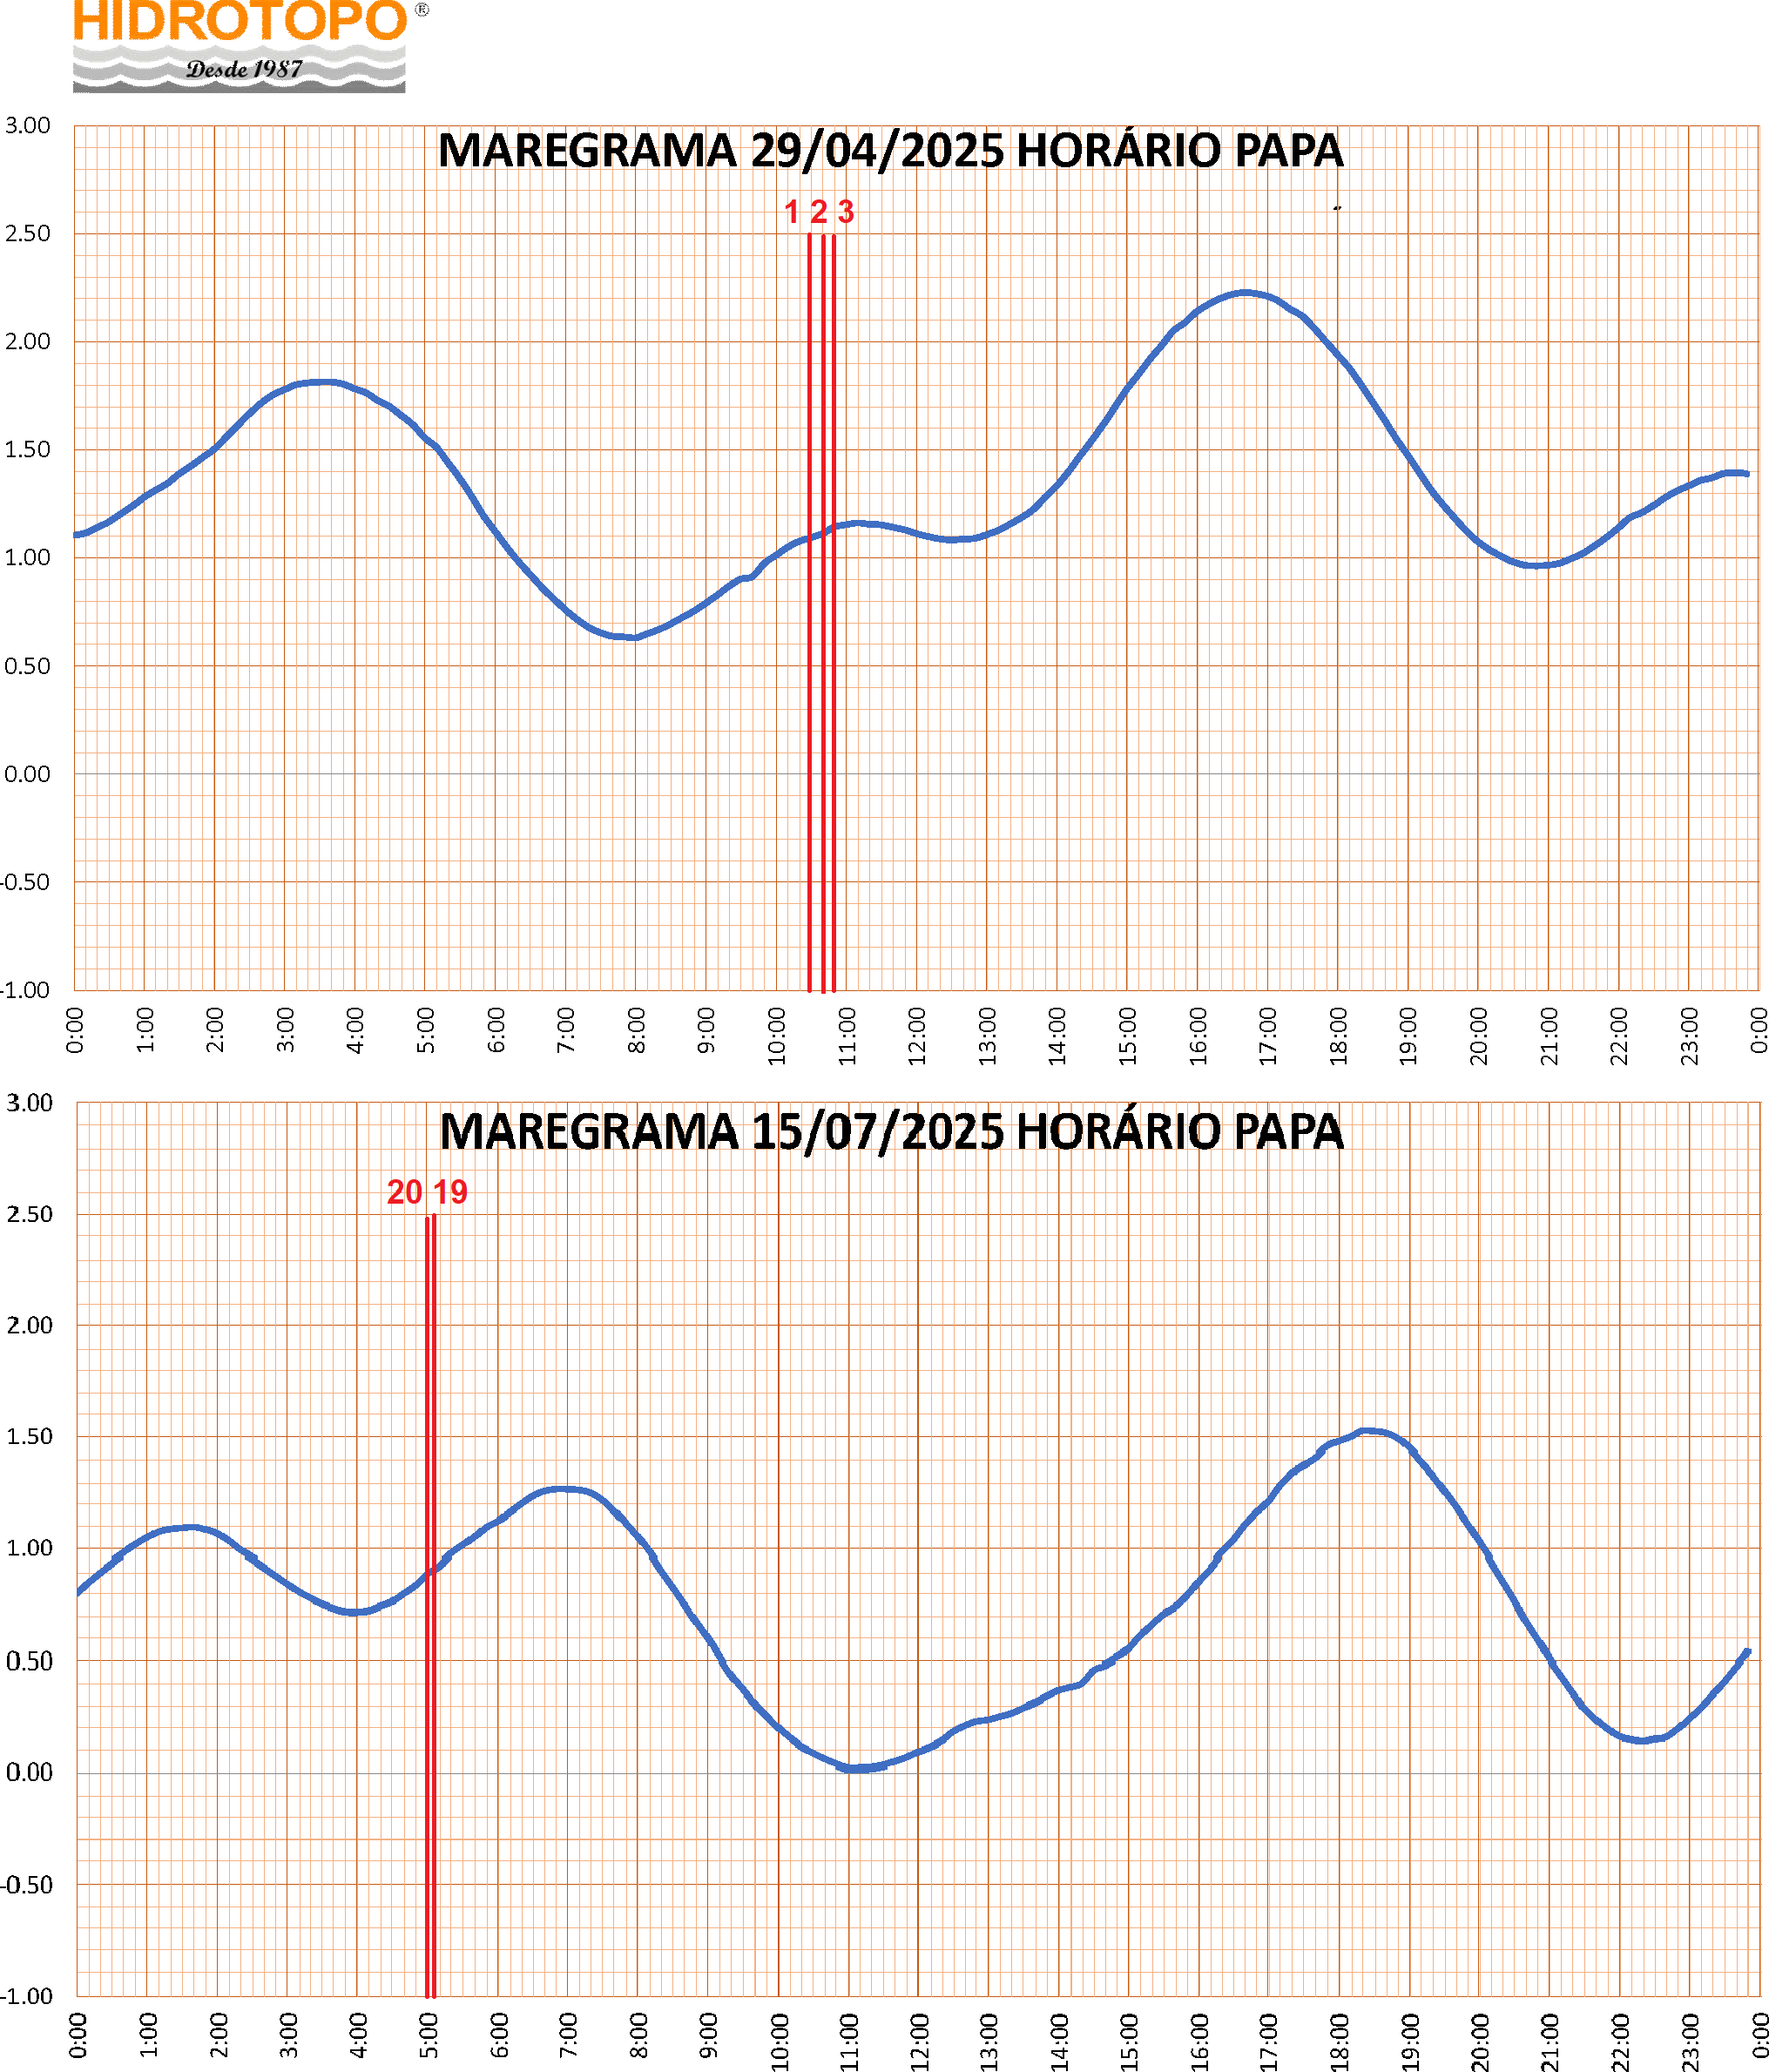
Fig. 9 presents the digital tide gauge records in analog format for 29 April and 15 July 2025, when density and yield stress data were collected. The vertical bars, labeled 01, 02, 03, 19, and 20, represent the times when density, and hand lead line data were collected, when the tidal current was not significant, barely interfering with the task of lowering and raising the data collection systems. During the density data collection, surveyors noted fair weather with light winds, no rain, low turbidity and insignificant surface currents. Environmental conditions were not expected to pose additional stress in the survey area.
Knowledge of tide times and phases is important for analyzing densimetric and bathymetric profiles, since suspended sediments and the fluid mud layer (unconsolidated sediments) are subject to stress caused by the current associated with the tidal height, along with currents of non-astronomical origin. Both the densimeter and the echo sounder detection can be affected by oscillations in the sediment layers (USACE, 2013). These currents are an important condition for providing dynamic energy to the sediments and reducing the rate of fluid mud consolidation (Carneiro, 2018).
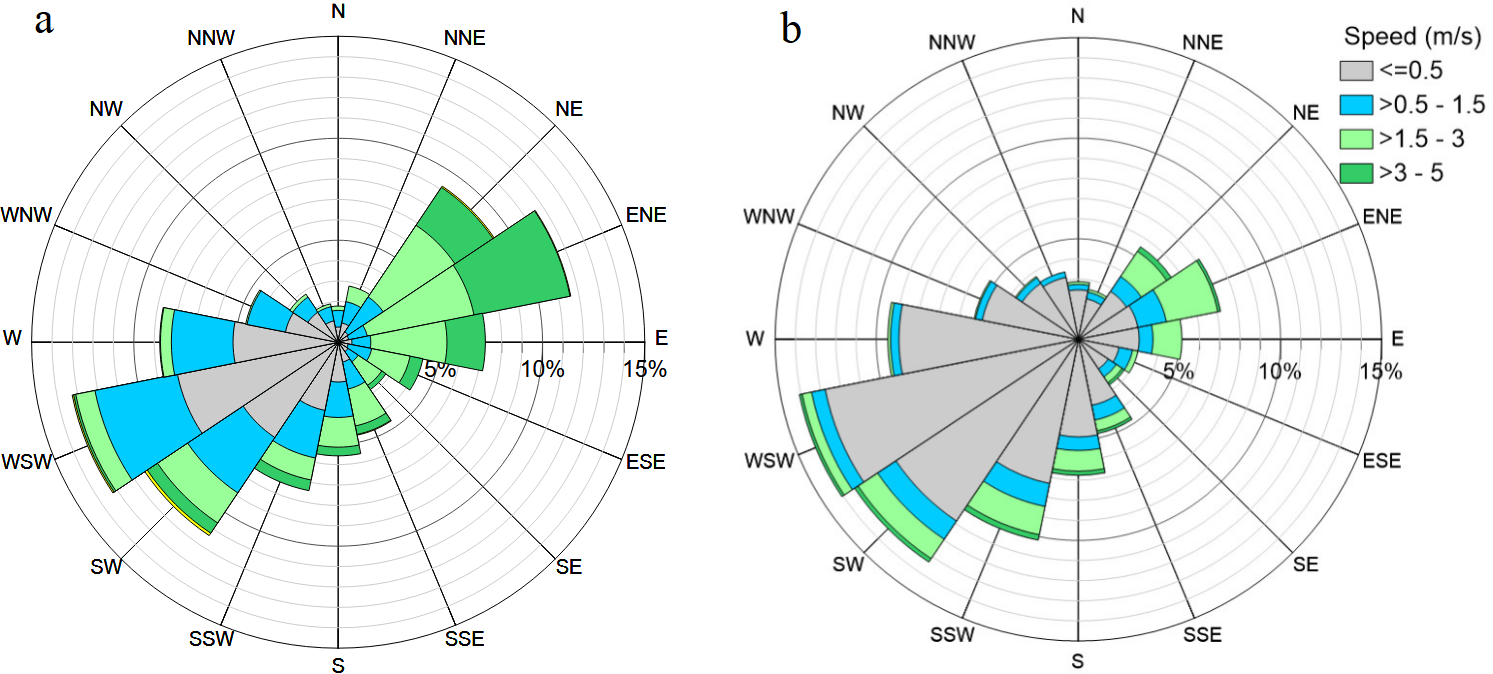
Fig. 10 shows the wind rose for the summer and winter of 2019, a snapshot of the environmental conditions in the region. In the summer, WSW and ENE winds are more frequent, approximately 25 % of the time, with an average intensity of 1.38 m/s and a maximum of 5.9 m/s. In the winter, WSW and SW winds are more frequent, 27 % of the time, with an average intensity of 0.44 m/s and a maximum of 5.1 m/s (Cunha & Abreu, 2023). These data were obtained from the meteorological station of the National Institute of Meteorology (INMET). These winds are an important forcing factor in keeping sediments out of the consolidation zone, allowing the use of unconsolidated (fluid) mud for navigation.
6.2 Density and bathymetry analysis
Although adequate rheological tests can be performed in the laboratory, it is still difficult to generate rheological profiles in situ. Therefore, these properties are generally correlated with more easily measurable properties, such as density and acoustic measurements (Carneiro 2018). Studies on ship maneuverability and empirical models show that fluid mud does not pose an obstacle to navigation when its density is equal to or less than 1,200 kg/m3 (Michimoto, 2019). Therefore, a densimeter was used to measure the depth where a density of 1,190 kg/m3 occurs, lower than the limit suggested by the author and other studies, as an initial and safe step.
The data collected at points 01, 02, 03, 19, and 20 (Fig. 6) showed the following depths, as listed in Table 4, for densities of 1,190 kg/m³ and 1,290 kg/m³, lead line, and low-frequency echo sounder. These values, as expected, indicated greater depths than those obtained with multibeam bathymetry (also shown in the table) and high-frequency single-beam bathymetry. The depth 14.3 m at point 19 stands out when compared to all other depths, being closer to the high-frequency bathymetry. However, a closer look into density changes shows the reason for this discrepancy.

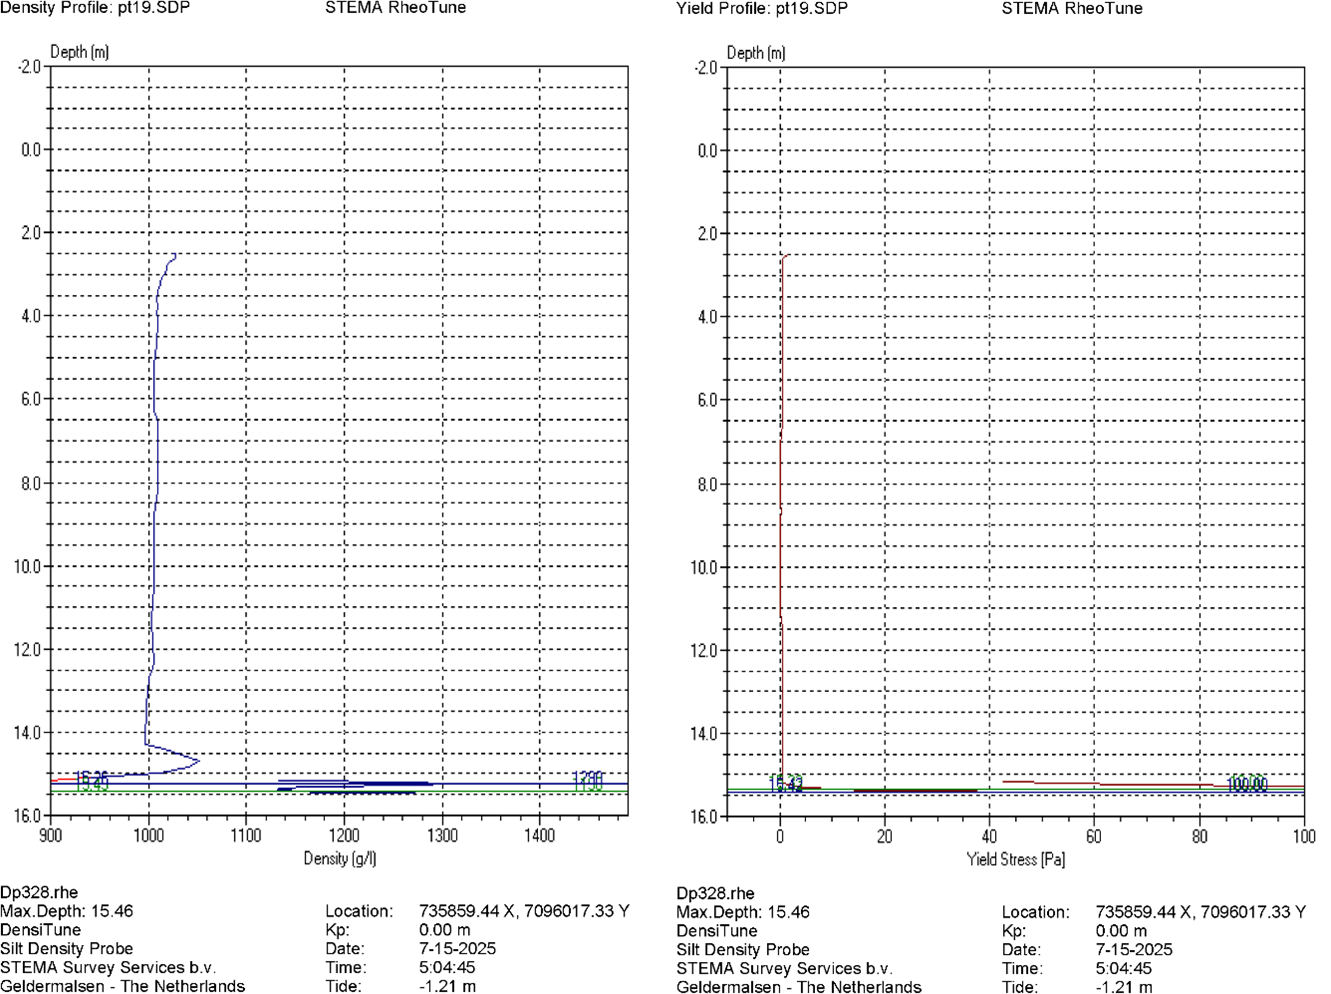
Fig. 11 shows the density (left) and yield stress (right) profiles for point 19. It can be seen that the first density gradient appears at 14.3 m, the depth where the low-frequency echo sounder indicates a depth of 14.3 m (Table 4). Naturally, this is not the bottom, as the densimeter then indicates a depth of 15.26 m, where the density of 1190 kg/m3 is measured (green line). The yield stress profile for 10 Pa (green line) indicates the bottom at 15,23 m. Density and yield stress values can be seen as useful information to remove ambiguities and used as additional safety factors. This can also potentially be used in future studies to further improve the knowledge of the fluid mud behavior in the area.
In Table 4, the minimum depths were compared with those obtained by the multibeam echo sounder (200 kHz), revealing variable differences that appear to be related to the positions where they were collected and the interpretation of low frequency bottom detection. Points 01 and 02 are in the center of the area occupied by ships, whose movement provides additional energy to keep the sediments in suspension, given the high turnover of ships docking and undocking. Point 03 is on the centerline, but at the extreme of the area, close to the bow of the ships. Points 19 and 20 are farther from the pier, where there is gradually less movement, as the ships are pulled by tugboats toward the channel (parallel to the pier, away from point 03).
As shown in USACE (2013), in estuarine environments with high mud concentrations, the unconsolidated sediment layer varies depending on several environmental parameters, as previously mentioned. In these cases, it is unlikely that the values collected by different sensors will be exactly the same, as one might expect in clear water hard bottom areas. Even measurements from the same instrument can differ from one another in the same location. The variability observed in Table 4 is therefore not surprising. It is important to observe the low frequency echograms carefully.
The single beam echo sounder survey lines in the area of Berth 301 are identified in Fig. 12. Lines A, B, C, and D were planned in conjunction with the collection of points 01, 02, and 03. Lines E and F were established along the previous lines C and D, prior to the collections of points 19 and 20. Finally, line 0 was planned close to the berth 301 pier to improve knowledge in this area, where the shallowest depths were identified in the Category “A” survey conducted in February 2025, using a 200 kHz multibeam.
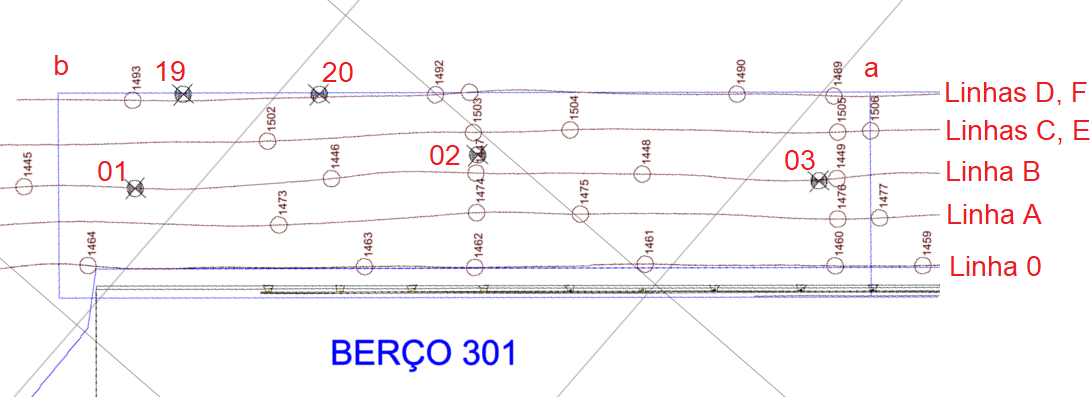
Because this line is very close to the pier, its true depth is masked because the beam width of both channels (high and low frequencies) interferes with the pier side wall (Fig. 5). However, the echo sounder recording can provide valuable clues about the thickness of the fluid mud layer. Lines “a” and “b” represent the longitudinal limits of berth 301.
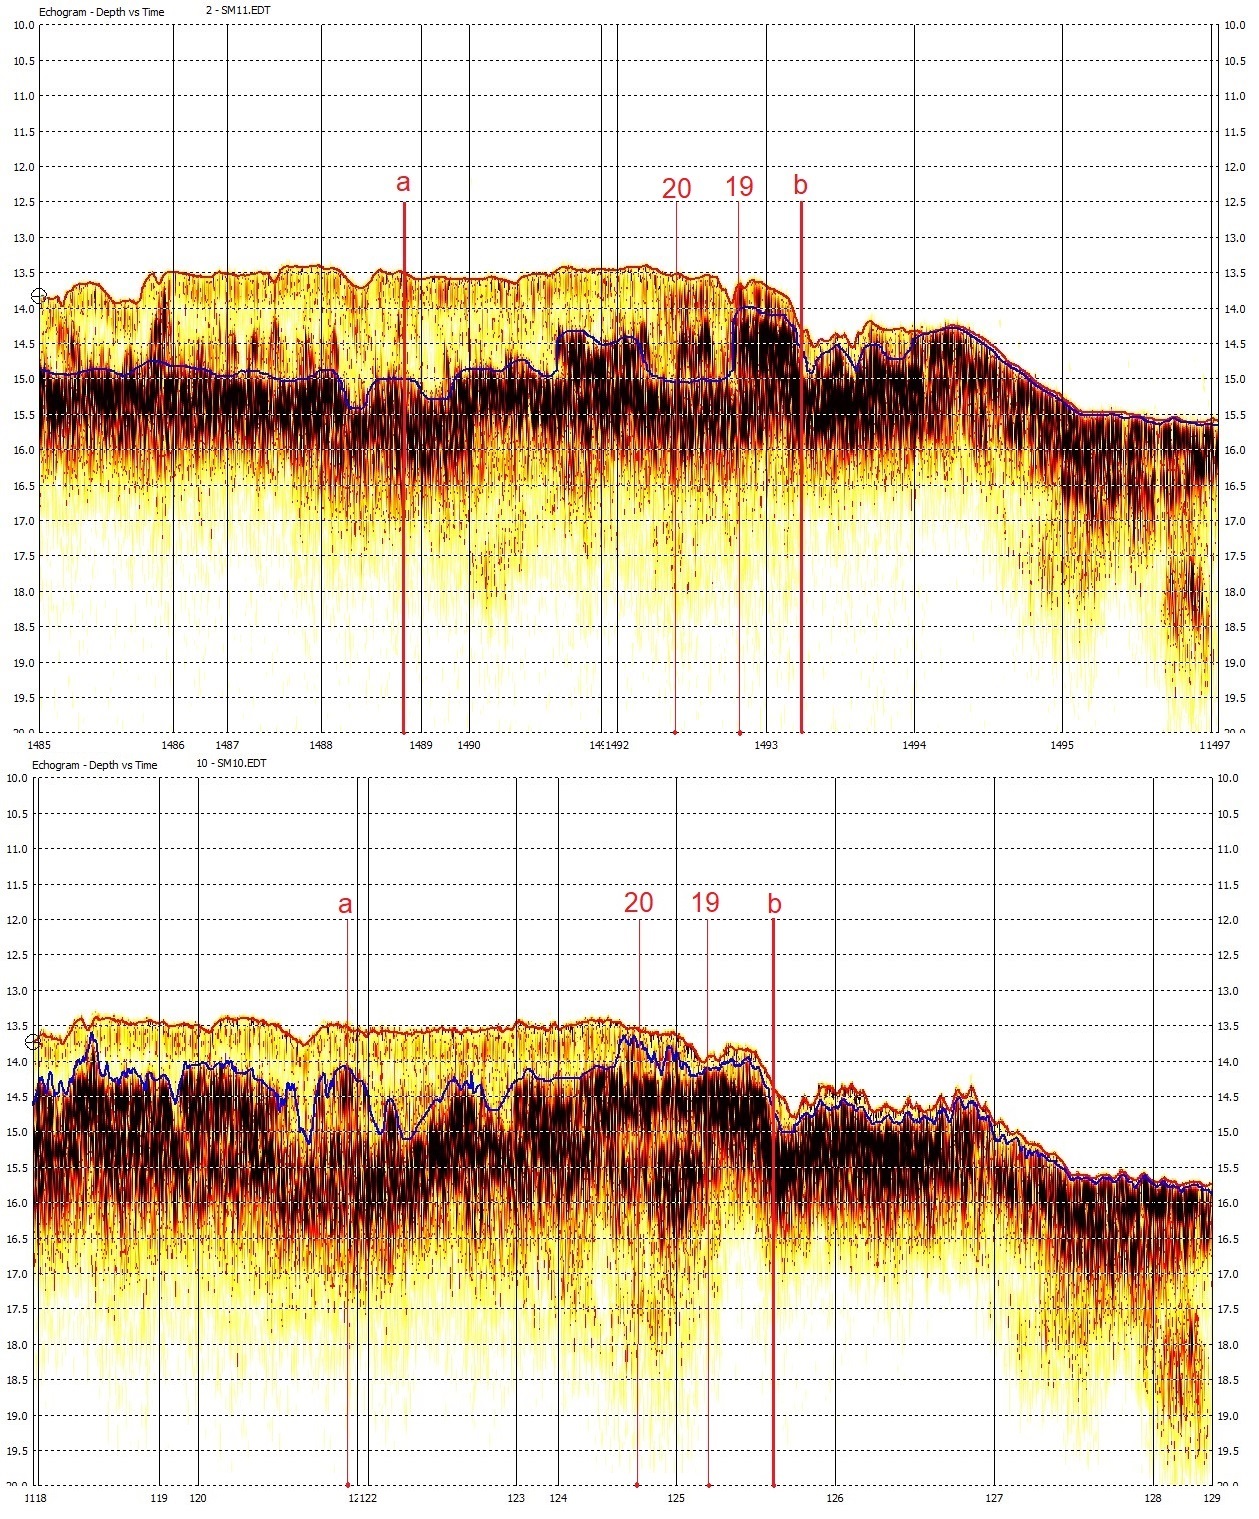
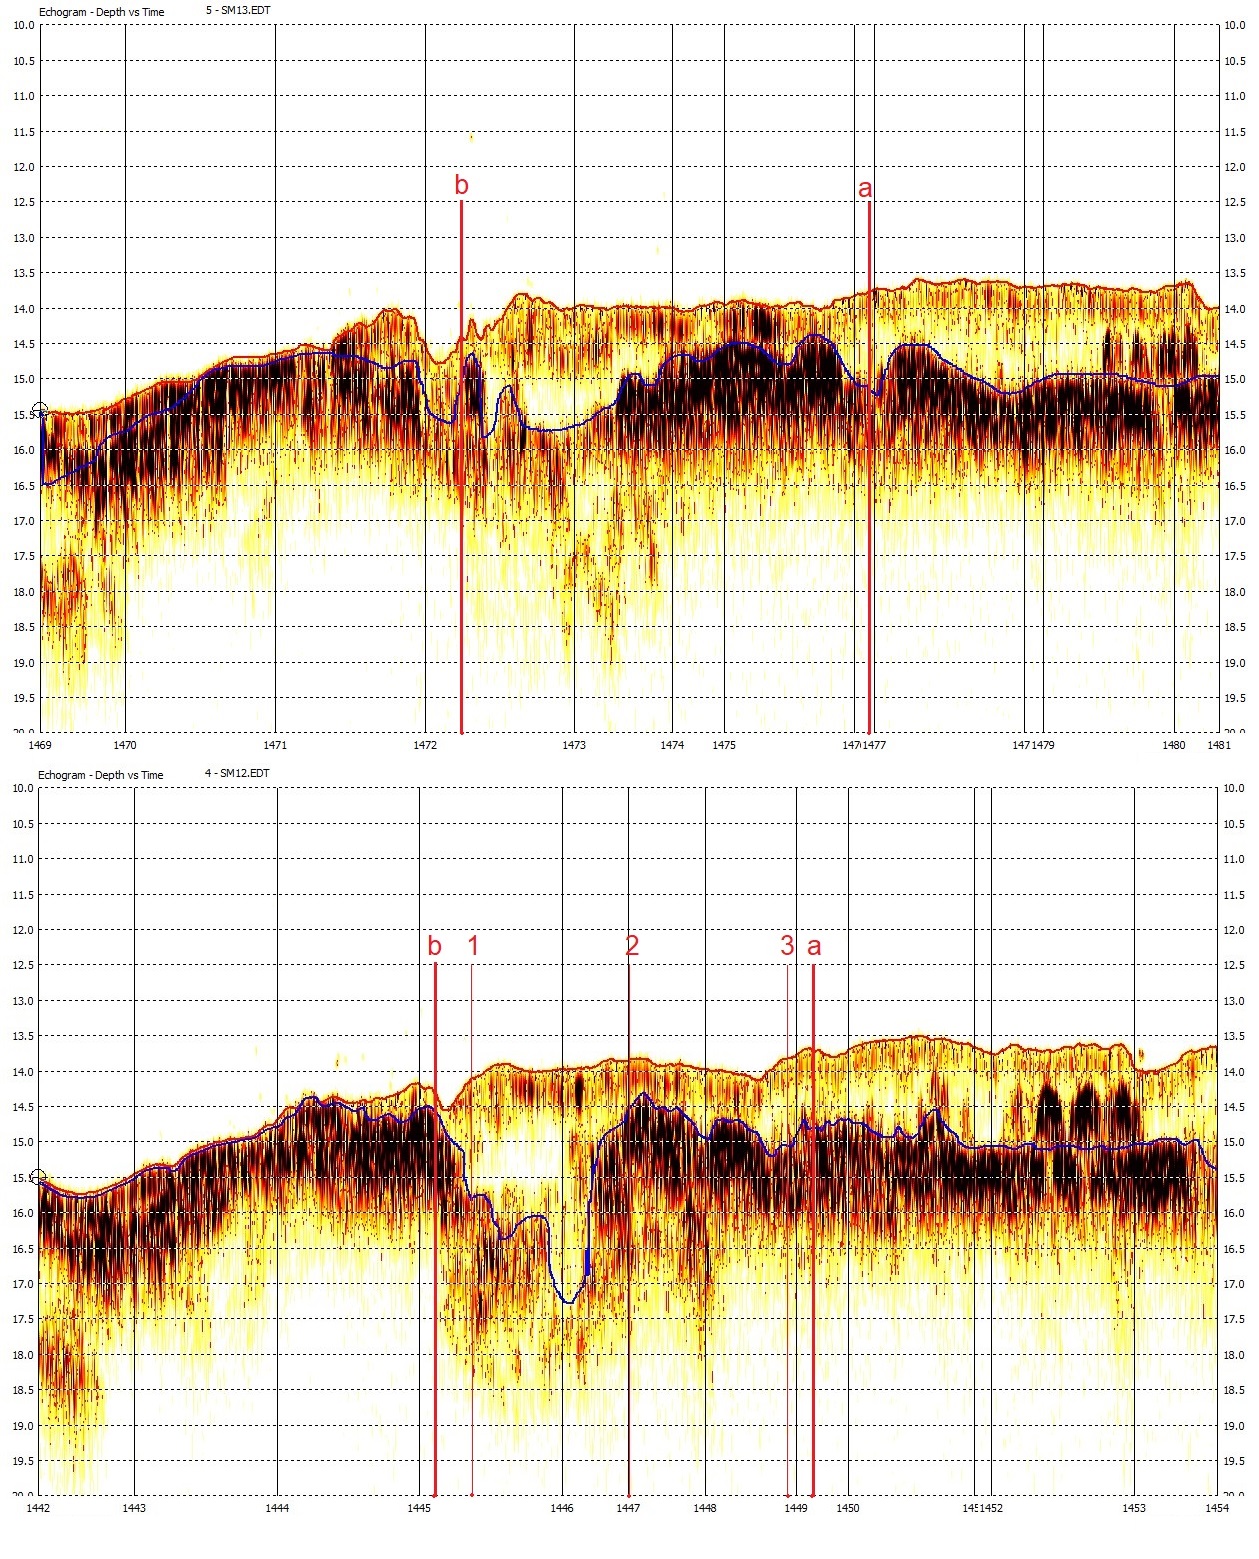
In Fig. 13, two lines coincident in space but separated in time by 34 days (lines D and F) can be seen. These lines were surveyed along the outer edge of berth 301. The echograms show significant variations in the low-frequency channel depth, while maintaining considerable consistency in the high-frequency channel depth. It can also be noted that bottom detection by the high-frequency channel in both lines is not homogeneous, due to bottom and fluid mud layer variability. In the area of interest (Berth 301, delimited by lines “a” and “b”), this variability is relevant, which shows that the nautical bottom can be further deeper than the bottom detected by the low frequency channel, which is not detecting the consolidated bottom but rather the fluid mud plume.
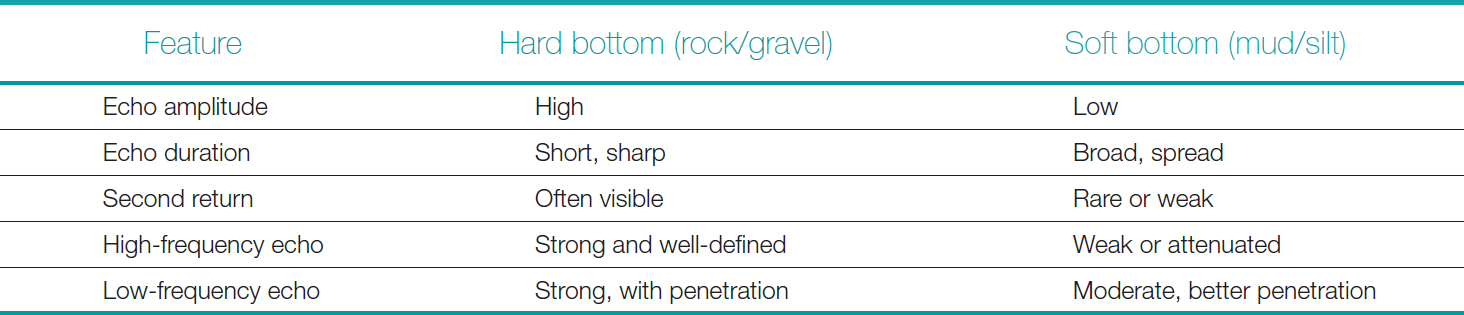
It can be seen that the high-frequency and low-frequency returns are consistent with a sediment bottom (mud and silt), as summarized in Table 5. The returns occur at two main reflectors, with low intensity and penetration. A rocky bottom would present a strong echo at both frequencies, indicating similar depths.
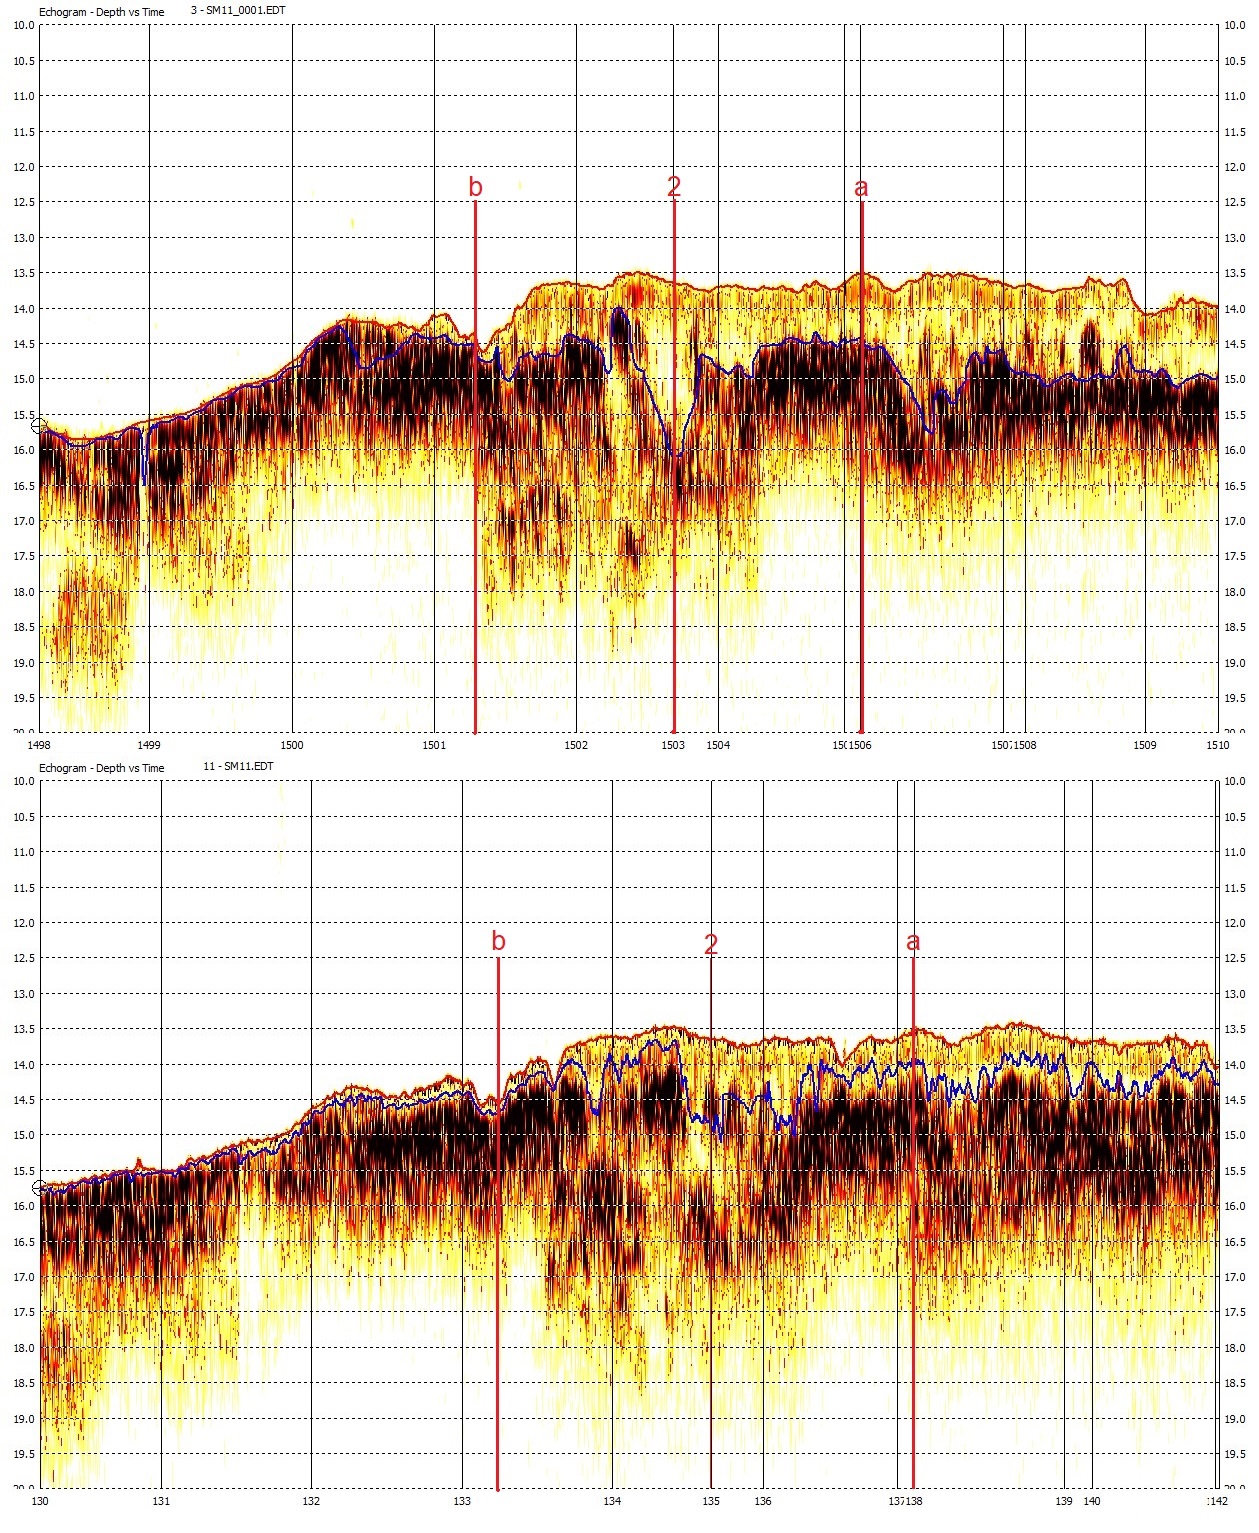
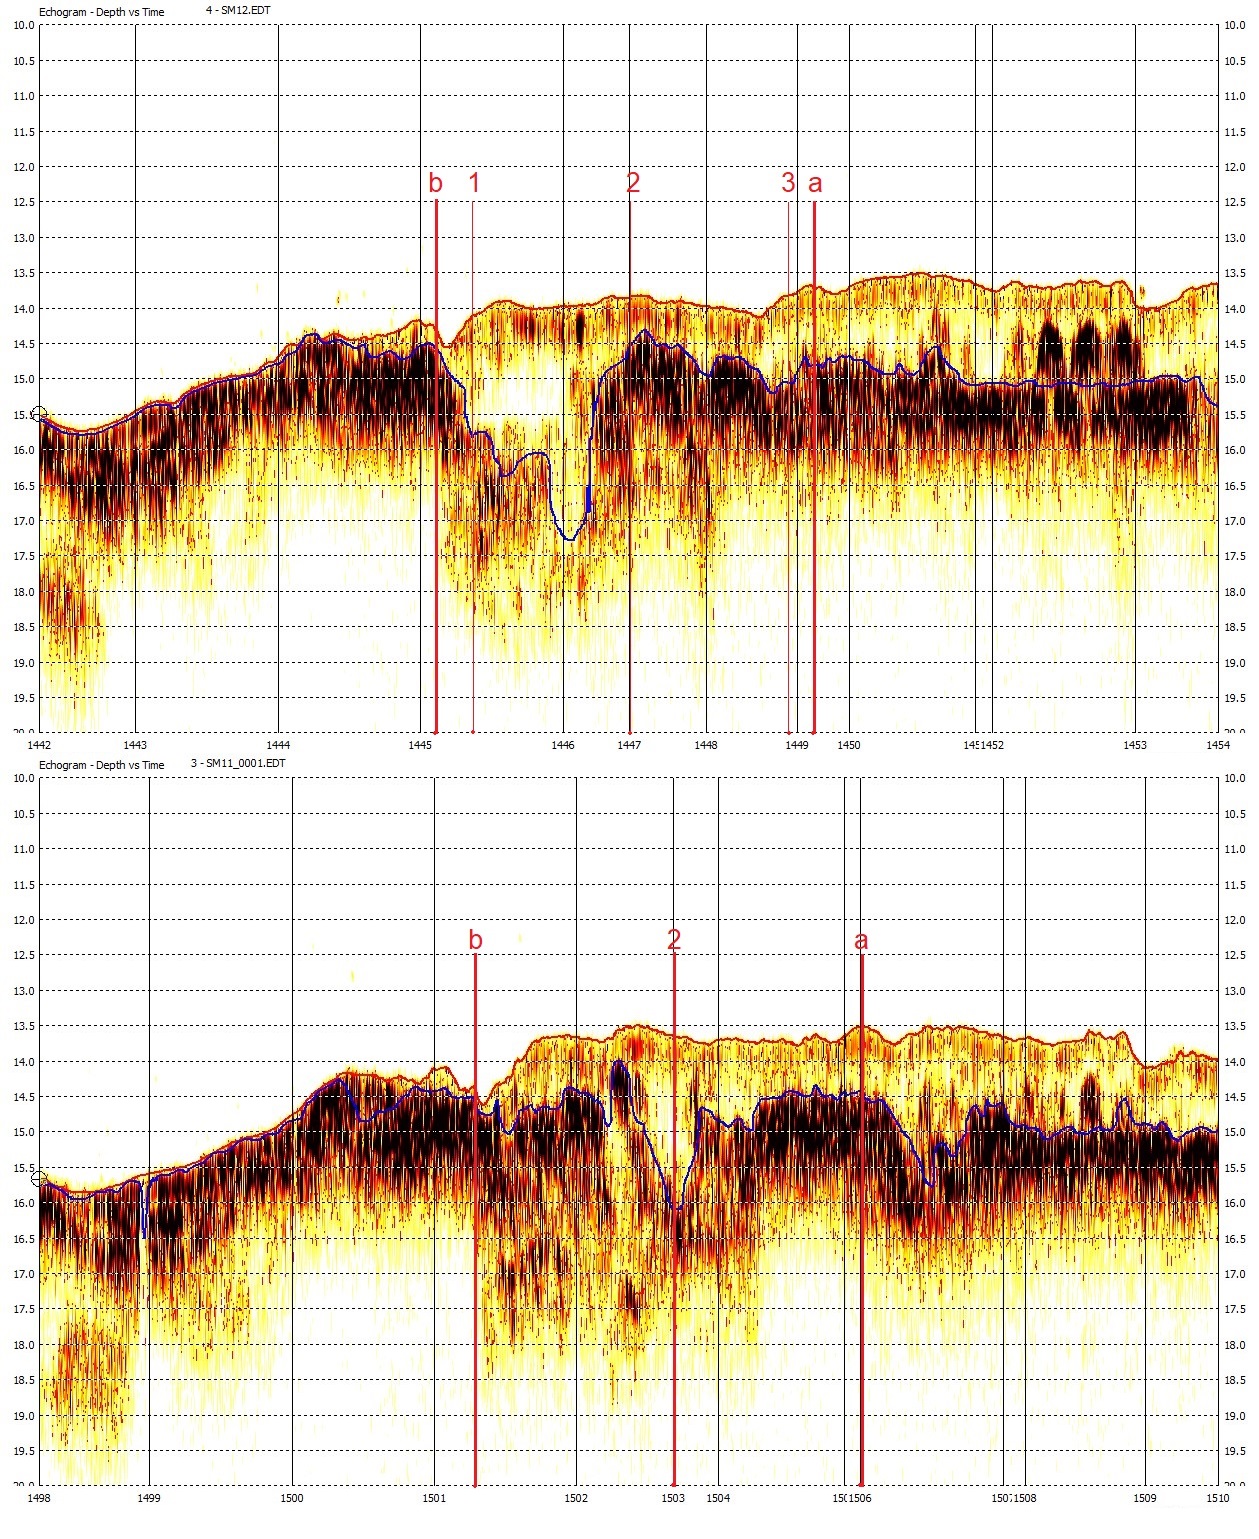
This situation also occurs in the echograms of lines C and E, shown in Fig. 14, parallel to the line in Fig. 13, approximately 10 meters into the area of Berth 301. Point 02 is midway between lines B and C (Fig. 15). The next line toward the pier, line B, is reproduced in Fig. 15, along with the echogram of line C. Line B was established over points 01 and 03. Point 02 is midway between lines B and C (approximately 5 meters from each line). The variability of the mud layer, as represented by the low-frequency sensor, can be observed. Fig. 16 shows lines A and B, both near the pier of Berth 301. Line B passes over density points 01 and 03. Line A is approximately 10 m from the pier.
The analysis of the echograms also provides important clues about the sediment distribution below the first reflector, the one typically detected by high-frequency echo sounders. For this reason, high-frequency echo sounders do not detect suspended sediment below the lutocline. In this case, low-frequency echo sounders are more suitable (USACE, 2013). In Figures 13 to 16, the sediment distribution can be observed between the first reflector, detected by high-frequency sonars, and the lower part of the record, which represents the penetration limit of the low-frequency sonar.
All echograms represent the reduced bathymetry of the tide only, excluding corrections from the sound velocity profile and the motion sensor. This is a characteristic of the processing software, and as a result, the depths are approximately 30 cm off the final depths reduced to the chart datum. In the comparison tables, the final values, after all corrections, are used. This situation is exemplified in Fig. 17, where the echogram does not contain the corrections for the sound speed profile and heave at the top. Below, the profile contains all the corrections, which are the information used in plant production and vertical data, reduced to the chart datum.
In Figures 13 to 16, the persistent fluid mud layer can be clearly observed throughout the area of Berth 301, with no indication of a bedrock. In Fig. 18, there is line 0, which ran close to the pier, to measure the mud layer at the shallowest point identified in the post-dredging survey, conducted in February 2025. It can be seen that a fluid mud is persistent in time when comparing survey lines performed at different times. These plumes of fluid mud are also consistent with the bottom samplings (clay) and density monitoring.

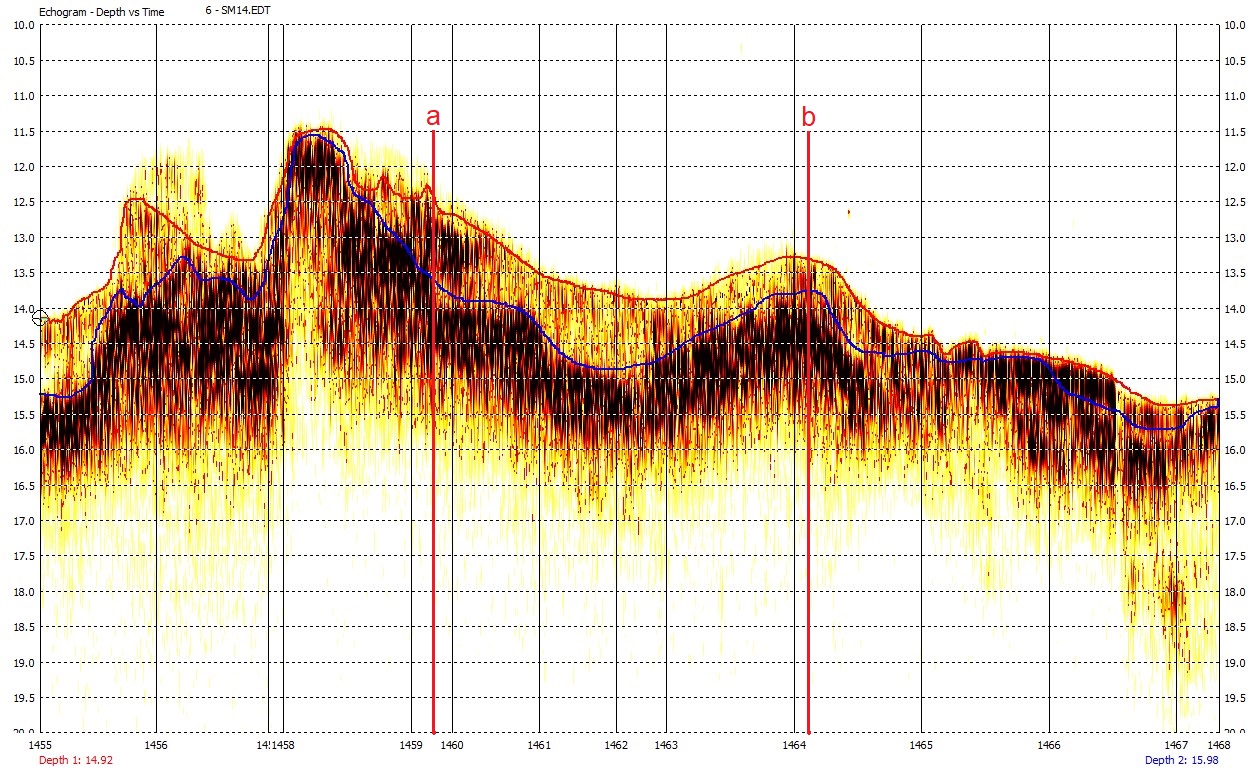
The shallower zone in Fig. 18, between points “a” and “b”, has a clear mud layer greater than 0.5 m along the pier, exceeding 1 m in some parts. The blue line indicates the low-frequency echo sounder detection, and the shaded area above it is the suspended mud layer, although fluid mud may occur below this line, as indicated by the densimeter in Table 4. This is the area where the post-dredging survey with high-frequency multibeam indicated the shallowest part (13.5 m).
This situation can be seen in Fig. 19 (viewed from the top), where there is a narrow strip next to the pier, below the fenders, where the minimum depth in the area of Berth 301 is less than 14 m, with the minimum being 13.5 m (upper image). This post-dredging bathymetry was obtained by Hidrotopo in February 2025. In the same figure, lower image, the difference in depths obtained with the high- and low-frequency channels can be observed. The differences between these frequencies are indicative of fluid mud, whose thickness varies from 0.5 m to 1.2 m.
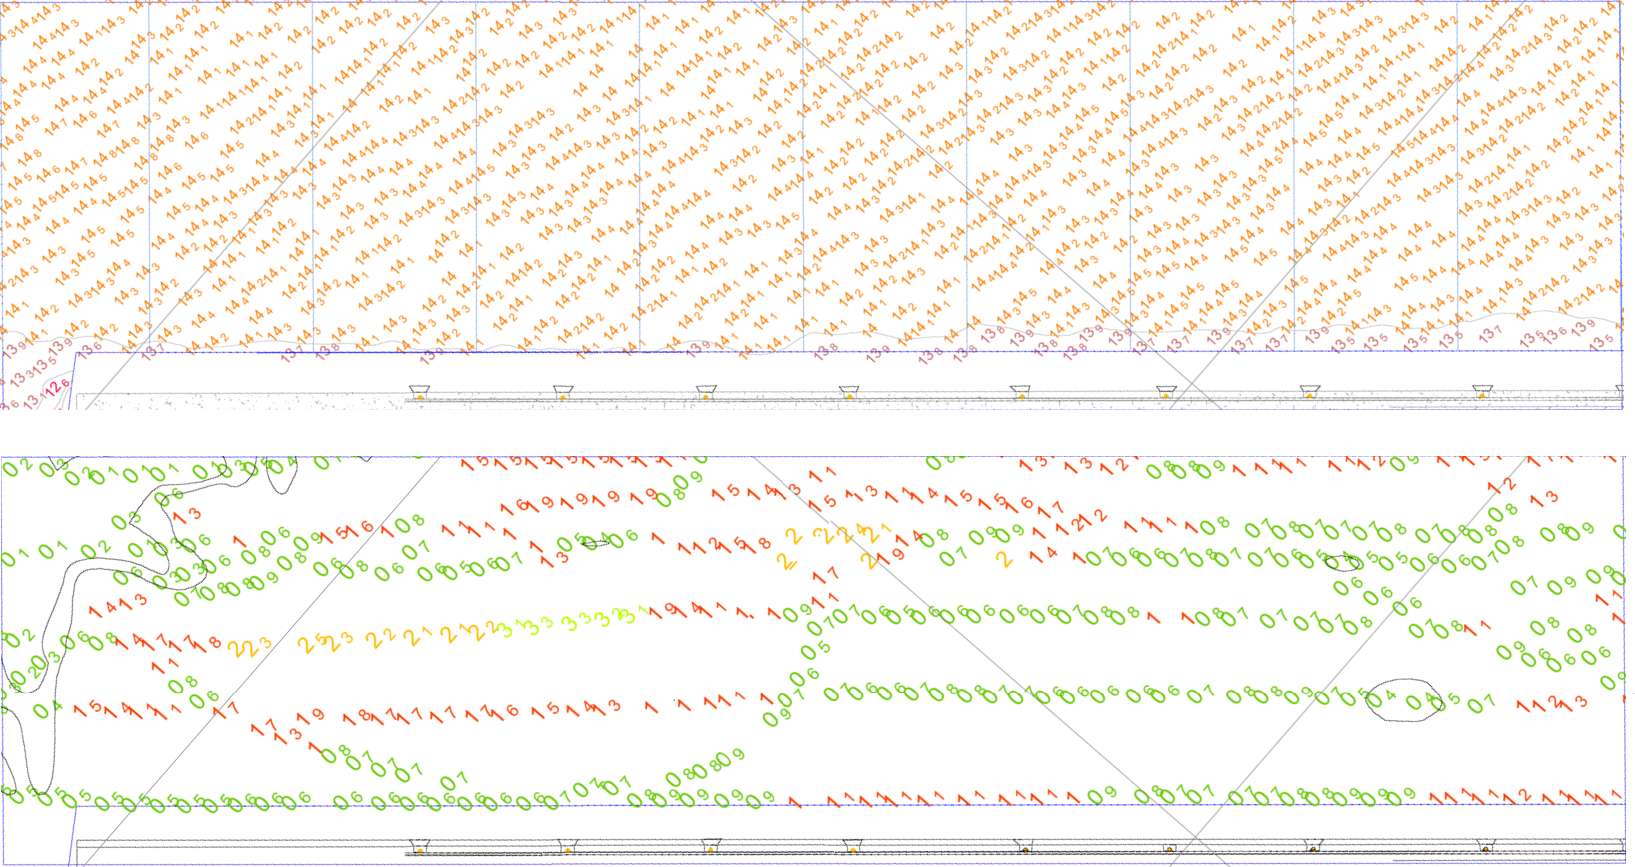
It can be identified that there is a navigable fluid mud layer with a minimum thickness of 0.5 m along the Berth 301 pier, below the minimum depth established by the post-dredging hydrographic survey of 13.5 m. This means, according to PIANC (2014), that the minimum nautical bottom in the area of Berth 301 can be defined as 14.0 m. The nautical bottom, in this situation, can be used as a reference for the UKC calculation. This is a conservative approach, as density profiles indicate that the nautical bottom is deeper.
Since the UKC ranges from 1.9 to 2.7 m (NPCP-SC, 2022), this does not imply that the ship should sail with its keel in the fluid mud, although this occurs in many ports around the world, which is conventionally referred to as a negative UKC. In this study, we propose that the UKC of 1.9 to 2.7 be calculated relative to the 14 m nautical bottom, rather than the apparent bottom measured by high-frequency sonar (13.5 m).
Some areas of berth 301 have a mud layer, as indicated by the difference between high and low frequencies, that are not significant (from a conservative perspective, without considering density measurements). However, in these areas, the depth is greater than 14 m and does not affect the definition of a minimum nautical bottom that is used throughout the entire area of Berth 301. This occurs in the northernmost part of the Berth.
7 Conclusions and recommendations
7.1 Conclusions
TESC executes a series of environmental programs in Babitonga Bay, in addition to port operations. Efficient dredging management is essential for environmental protection and port efficiency. Performing hydrographic surveys efficiently allows for the definition of the nautical bottom, a non-trivial task in environments with high concentrations of unconsolidated sediments. Knowledge of the nautical bottom allows for accurate measurement of dredging volume and locations, reducing environmental impact. It also increases the efficiency of port operations, helping to ensure products reach the average citizen at more competitive prices (NOAA, 2025a).
This report evaluates a substantial amount of data and information to enable a thorough analysis, optimizing knowledge of the fluid mud layer, its thickness, physical characteristics, and behavior. The final goal is defining the nautical bottom for the UKC calculation. The exit from Berth 301 toward the maneuvering basin and channel is deeper than 14.0 m and is therefore not the subject of investigation at this stage of the work.
The methodology used employs lead line, which, due to the small size of the area of interest and the relatively light currents, allows for this use. Lead line surveys may seem outdated, but it is a consistent tool in cases like this. One difficulty faced was that Berth 301 (the main focus of the report) had nearly 100 % occupation, posing a challenge for the survey given the constant presence of vessels. Another challenge is to demonstrate that the fluid mud thickness exists, and that the horizontal and vertical distribution allows for the definition of nautical depth for the safe navigation of a vessel throughout the entire operating area (Berth 301).
This work adopts a conservative approach, indicating a safe first step, allowing all those involved in the TESC operation (Port Authority, Maritime Authority, Pilotage) to be confident in this step before subsequent progress can be made. One step at a time. There is potential room for improving knowledge of the fluid mud layer and obtaining the nautical depth more accurately, increasing the TESC’s operational draft.
It is safe and conservative to conclude that there is a navigable layer of fluid mud with a minimum thickness of 0.5 m along the quay at Berth 301, below the minimum depth established by the post-dredging hydrographic survey of 13.5 m. This means, according to PIANC (2014), that the minimum nautical depth in the area of berth 301 can be defined as 14.0 m. In this situation, the nautical depth can be used as a reference for calculating the UKC. The nautical depth was defined based on the following findings:
- The minimum difference between the low and high frequency channels of echo sounders.
- The confirmation of the density assessments, that indicated even deeper consolidated sediments and thicker fluid mud layer.
- The confirmation of the lead line measurements, also indicating deeper hard bottom (consolidated mud).
- The confirmation of the bottom samples, indicating clay in all sampling points.
- The absence of rocks in the sub-bottom of the area of interest, reported at CPE (2024).
- The local environmental conditions that facilitate the formation and maintenance of fluid mud, similar to those reported at USACE (2013).
Since the UKC ranges from 1.9 to 2.7 m (NPCP-SC, 2022), this does not imply that the vessel must sail with its keel into the fluid mud, although this occurs in many ports around the world, which is conventionally referred to as a negative UKC. In this study, it is proposed that the UKC of 1.9 to 2.7 be calculated in relation to the 14 m nautical bottom, and not to the apparent bottom measured by high frequency sonar (13.5 m). This situation can be seen schematically in Fig. 1.
It is important to note that a central point of the PIANC manual (2014) is the concept of nautical bottom, defined as “the level where the physical characteristics of the bottom reach a critical limit beyond which contact with the keel of a ship causes damage or unacceptable effects on controllability and maneuverability.” Due to the conservative approach, the chosen value (14 m) does not precisely define a critical level that would put ships at risk. Further investigation may indicate that the seabed is deeper than 14 m, with more consistent indicators between density and echo bathymetry.
It is possible to observe, from the data provided by the hydrographic survey, that the very dynamics of ship movement contribute to keeping the sediments unconsolidated and in suspension. The movement of ships and tugboats contribute to conditioning the mud to remain fluid and navigable (Fig. 18). Exploring the yield stress can be further considered to define the nautical bottom (PIANC, 2014). It is especially relevant for cohesive sediments, such as clay-rich mud, as it helps determine when the mud resists the ship’s movement. This can allow for better characterization of the nautical bottom using the Densitune densimeter.
Vessel behavior, including maneuverability and squat in fluid mud areas, is not expected to be significantly affected, as vessels will be operating at very low speed, under tugboats and with pilots on board, and once they leave the berthing area, they will reach the main channel. According to Michimoto (2019), the impact of fluid mud on ship maneuverability is minimal when the critical density is 1,200 kg/m³ or less.
From a conservative perspective, it is also important to note that the complexity and risk in the study area are not significant for the following reasons:
- Vessels transit this berth at low speed and with the assistance of tugboats.
- Maneuvers are performed under the supervision of an experienced pilot.
- The bottom is made of fluid mud and there are no indications of bedrock.
- Maneuverability studies indicate that vessels can navigate safely even in contact with the fluid mud.
- The terminal is in a wind and wave sheltered area of Babitonga Bay.
It is worth noting that uncertainties in fluid mud surveys are not accurately estimated or easily measured; this is not a simple method, like that described in IHO (2024) for calculating total propagated uncertainty, also perceived in USACE (2013). Echo sounder measurements in areas with suspended sediments and fluid mud are affected by changes in the sound velocity profile, with absorption, attenuation, scattering, and reverberation occurring at different proportions than in Newtonian fluids.
7.2 Recommendations
- Adopt the minimum nautical depth in the Berth 301 area as 14.0 m for the purposes of defining the UKC.
- Establish this nautical depth during a testing period, in coordination with local pilotage. The pilots’ data, information, and assessments will be highly relevant to the safe implementation of the nautical depth.
- Consider using the fluid mud layer definition in the squat formula calculation, due to its potential effect on the ship’s squat. Monitor the variability of the fluid mud in the Berth 301 area, in terms of density and depth.
- Have bottom samples analyzed in laboratory, in addition to the manual analysis performed onboard the survey vessel.
- Consider in-situ conditioning to improve mud fluidization, potentially increasing the nautical depth in the berthing area. Investigate the adoption of the S-129 Under-Keel Clearance format, currently under development (IHO, 2022).
- Monitor the work of the Brazilian Hydrographic Society (SBHidro), which recently approved the establishment of a working group to improve hydrography in ports.
References
Buchanan, L. (2008). Surveying in Fluid Mud. Hydro International, 1 January. https://www.hydro-international.com/content/article/surveying-in-fluid-mud (last accessed 31 October 2025).
Carneiro, J. C. (2018). Estudo das camadas de lama fluida em portos e canais de navegação [Doctoral thesis, Universidade Federal do Rio de Janeiro, COPPE]. Pantheon Institutional Repository. http://hdl.handle.net/11422/12564
Carneiro, J. C., Fonseca, D. L., Vinzón, S. B. and Gallo, M. N. (2017). Strategies for measuring fluid mud layers and their rheological properties in ports. Journal of Waterway, Port, Coastal, and Ocean Engineering, 143(4), 04017008. https://doi.org/10.1061/(ASCE)WW.1943-5460.0000396
Chamanmotlagh, F., Kirichek, A. and Gebert, J. (2024). Effects of recirculation dredging on density, strength, settling and oxygen concentration of fluid mud in the port of Emden. Journal of Soils and Sediments, 24(12), 3887–3897. https://doi.org/10.1007/s11368-024-03891-x
Claeys, S. (2006). Evaluation and combination of techniques used to determine the nautical bottom: A call for rheology-based instruments. In Proceedings of the 15th International Congress of the International Federation of Hydrographic Societies (Vol. 55, pp. 141–144). Hydrographic Society Special Publication.
CPE (2024). Relatório de sondagem N. CPE048-RL-001, Porto de São Francisco do Sul. CoastalPort Engenharia. Belo Horizonte, MG, Brasil.
Cunha, C. N. and Abreu, A. C. (2023). Mixing process evaluation due to sea level rise in Babitonga Bay, Brazil. Journal of Integrated Coastal Zone Management (APRH), 23(2), 135–151. https://doi.org/10.5894/rgci-n521
Fonseca, D. L. (2018). Assessing rheological properties of fluid mud samples through tuning fork data. Ocean Dynamics, 68(1), 1–7. https://doi.org/10.1007/s10236-017-1113-3
Fugro (2025). Fugro Marinestar. Fugro NV. Leidschendam, Netherlands. https://www.fugro.com/expertise/satellite-positioning/marinestar (last accessed 24 July 2025).
Greer, J. (2008). Not all sediment is created equal. Chesapeake Quarterly, 7(3). https://www.chesapeakequarterly.net/V07N03/main/ (last accessed 31 October 2025).
Greiser, N., Gamnitzer, R. and Rupp, J. (2002). Pseudoplasticity of Cohesive Sediments: Causes and Innovative Techniques for Pre-Dredging Surveys. In Proceedings of the CEDA Dredging Days, Casablanca, Morocco, pp. 27-33.
IHO (2005). Manual on Hydrography (ed. 1.0). IHO Publication C-13, International Hydrographic Organization, Monaco. https://iho.int/uploads/user/pubs/cb/c-13/english/C-13_Chapter_1_and_contents.pdf (last accessed 31 October 2025).
IHO (2020a). Standards for Hydrographic Surveys (ed. 6.0). IHO Special Publication S-44, International Hydrographic Organization, Monaco.
IHO (2020b). INT 1 Symbols and Abbreviations used on Paper Charts (ed. 8). IHO Special Publication S-4. International Hydrographic Organization, Monaco.
IHO (2022). Under keel clearance management (UKCM) [Manuscript in preparation]. IHO Special Publication S-129, International Hydrographic Organization, Monaco.
IHO (2024). Standards for Hydrographic Surveys (ed. 6.2.0). IHO Special Publication S-44, International Hydrographic Organization, Monaco. https://iho.int/uploads/user/Services%20and%20Standards/HSSC/HSSC16/S-44_Edition_6.2.0_Proposed.pdf (last accessed 31 October 2025).
IHO (2025). Yearbook (Publication P-5). International Hydrographic Organization, Monaco. https://iho.int/uploads/user/pubs/periodical/P5YEARBOOK_ANNUAIRE.pdf (last accessed 31 October 2025).
Kirby, R., Parker, W. R. and van Oostrum, W. H. A. (1980). Definition of the seabed in navigation routes through mud areas. International Hydrographic Review, LVII(1), 107–117.
Kirichek, A., Rutgers, R., Nipius, K., Ohle, N., Meijer, H. and Smits, J. (2018a). Current surveying strategies in ports with fluid mud layers. In Proceedings of the Hydro18 Conference and Trade Exhibition, 1–10.
Kirichek, A., Chassagne1, C.,Winterwerp, H., Noordijk, A., Rutgers, R., Schot, C., Nipius, K. and Vellinga, T. (2018b). How navigable are fluid mud layers? In Proceedings of the PIANC World Congress, Panama City, USA.
Kirichek, A. and Rutgers, R. (2020). Monitoring of settling and consolidation of mud after water injection dredging in the Calandkanaal. Aqua et Terra, 116, 12–18.
McAnally, W. H., Friedrichs, C. T., Hamilton, D., Hayter, E. J., Shrestha, P., Sheremet, A. and Teeter, A. M. (2007). Management of fluid mud in estuaries, bays, and lakes: Present state of understanding on character and behavior. Journal of Hydraulic Engineering, 133(1), 9–22. https://doi.org/10.1061/(ASCE)0733-9429(2007)133:1(9)
Michimoto, M. (2019). Aspectos relativos à folga abaixo da quilha de navios com enfoque nos parâmetros operacionais portuários verticais [Master’s thesis, Universidade Federal Fluminense]. UFF Institutional Repository.
Nguyen, V. and Le, V.-A. (2023). Fluid mud properties and nautical depth estimation: A case study in navigation channel of Duyen Hai Port, Vietnam. Ocean Engineering, 284, 114833. https://doi.org/10.1016/j.oceaneng.2023.114833
NOAA (2025a). An inch of water. What’s it worth? National Oceanic and Atmospheric Administration. https://oceanservice.noaa.gov/economy/inch-water (last accessed 30 June 2025).
NOAA (2025b). Hydrographic surveys specifications and deliverables. NOAA Office of Coast Survey. Silver Spring, MD, USA.
NORMAM (2023a). Norma da Autoridade Marítima para Levantamentos Hidrográficos (NORMAM-501/DHN). Marinha do Brasil. Brasília, DF, Brasil.
NORMAM (2023b). Norma da Autoridade Marítima para Folga Dinâmica Abaixo da Quilha (NORMAM-224/DPC). Marinha do Brasil. Brasília, DF, Brasil.
NPCP-SC (2022). Normas e procedimentos da Capitania dos Portos de Santa Catarina (NPCP-SC). Marinha do Brasil. Brasília, DF, Brasil.
PIANC (2014). Harbour approach channels design guidelines (Report No. 121). The World Association for Waterborne Transport Infrastructure. Brussels, Belgium.
Pion, L. and Alfredini, P. (2019). Fluid mud and nautical bottom – Concept and application in Itajaí Port Complex (Brazil). TransNav: International Journal on Marine Navigation and Safety of Sea Transportation, 13(2), 445–452. https://doi.org/10.12716/1001.13.02.20
Projeto Baías do Brasil (2018). Baía de Babitonga. https://www.baiasdobrasil.coppe.ufrj.br/assets/relatorios/rel_baia_babitonga.html (last accessed 10 September 2025).
Shakeel, A., Kirichek, A. and Chassagne, C. (2019). Revising the definition of fluid mud by establishing new protocols for rheological measurements. In The XVII European Conference on Soil Mechanics and Geotechnical Engineering: Geotechnical Engineering, Foundation of the Future (pp. 1–8). International Society for Soil Mechanics and Geotechnical Engineering.
Shakeel, A., Kirichek, A. and Chassagne, C. (2021). Rheology of mud: An overview for ports and waterways applications. In Manning, A. J. (Ed.), Sediment transport – Recent advances. IntechOpen. https://doi.org/10.5772/intechopen.100123
Shakeel, A., Zander, F., de Klerk, J.‑W., Kirichek, A., Gebert, J. and Chassagne, C. (2022). Effect of organic matter degradation in cohesive sediment: A detailed rheological analysis. Journal of Soils and Sediments, 22, 2883–2892. https://doi.org/10.1007/s11368-022-03245-3
Teeter, A., Banks, G., Alexander, M. and Salkield, A. (1992). An intrusive fluid mud surveying system. U.S. Army Engineer Waterways Experiment Station. Washington, DC, USA.
TESC (2025). Terminal Portuário de Santa Catarina (TESC), Institucional, Infraestrutura. https://www.terminalsc.com.br (last accessed 6 July 2025).
USACE (2013). Hydrographic surveying engineer manual (Engineer Manual No. 1110-2-1003). United States Army Corps of Engineers. Washington, DC, USA.
Vanlede, J., Dujardin, A., Fettweis, M., Van Hoestenberghe, T. and Martens, C. (2019). Mud dynamics in the Port of Zeebrugge. Ocean Dynamics, 69, 1085–1099. https://doi.org/10.1007/s10236-019-01278-9
Verwilligen, J., Vantorre, M., Delefortrie, G., Kamphuis, J., Meinsma, R. and van der Made, K.-J. (2014). Manoeuvrability in proximity of nautical bottom in the harbour of Delfzijl. PIANC World Congress, San Francisco, USA.
Vieira, C. and Horn, N. O. (2017). Marine landscape of the Babitonga bay, northeast of Santa Catarina state. Revista Brasileira de Geografia Física, 10(5), 1677–1689.
Wurpts, R. and Torn, P. (2005). 15 Years Experience with Fluid Mud: Definition of the Nautical Bottom with Rheological Parameters. Terra et Aqua, 99, 22–32.
Authors’ biographies

Alberto P. Costa Neves, Capt (Ret), MSc, earned his Hydrography Certificate (with Distinction) from the Brazilian Navy Hydrography School and a MSc degree (with Distinction) in Meteorology and Physical Oceanography from the United States Naval Postgraduate School (NPS). He is based in Portugal and has 40 years of experience in hydrographic surveys and navigation. He is the Director of PCN Maritime, a consultancy company focused on ports, maritime operations, navigation, hydrography, ship maneuver and simulation, aids to navigation, channel design, dredging, and underkeel clearance. In the Navy, he was a survey vessel’s captain and Superintendent of Safety of Navigation. Following retirement, he held the position of IHO Assistant Director and Hydrographic Science Program Coordinator at the University of Southern Mississippi (USM).

Augusto Dantas Sampaio, Civil Engineer, is a Port and Waterway Engineer, with over 50 years of experience in the port and waterway sector, with a distinguished career at the Ministry of Transportation and, for the last 38 years, at Hidrotopo Consultoria e Projetos Ltda. He has a solid career in Brazil’s main ports and waterways, actively contributing to the development of the sector, always guided by the adoption of new technologies and the promotion of safer and more efficient navigation. Currently, he is the leading technical coordinator and consultant, responsible for developing port projects focused on the implementation, maintenance, and adaptation of infrastructures. He also participates in the supervision of dredging works, nautical support, and hydrographic and geophysical surveys.

Reginaldo Gonçalves Abreu is a civil engineer with a degree from Estácio de Sá University, with specialization in Environmental Engineering and Port Engineering. Based in Rio de Janeiro, he has worked in hydrography for 23 years, accumulating solid experience in hydrographic and geotechnical surveys, as well as in conducting applied environmental studies. Throughout his career, he has participated in projects of national relevance, including deepening and maintenance dredging, as well as high-precision bathymetric monitoring with multibeam technology. He currently leads the technical team at Hidrotopo Consultoria e Projetos Ltda, coordinating strategic activities focused on maritime infrastructure, including planning and designing navigation channels, monitoring and supervising dredging projects, and implementing technical solutions that ensure operational efficiency and environmental compliance.