

Abstract
1 Introduction
Maritime navigation drives economic and social development in Small Island Developing States (SIDS) such as Trinidad and Tobago (TT). This reliance heightens vulnerability to maritime risks, including vessel collisions, oil spills, and infrastructure damage, which can have severe consequences. Historical and recent accidents in the Caribbean illustrate the impact of such consequences. Notable examples include the 2010 sinking of the Angeln off Saint Lucia, which led to substantial salvage and fuel removal costs (IMO, 2010), and the 1979 collision between the Atlantic Empress and Aegean Captain near Tobago, resulting in fatalities and the largest recorded ship-sourced oil spill of 287,000 tonnes (ITOPF, 2025). More recent events include the 2023 foundering of the Calypso 2 off Anguilla, resulting in the loss of two lives (IMO, 2024), and the 2024 Gulfstream barge spill off Tobago, categorised as a Tier 2 accident requiring regional or national response by the Ministry of Energy and Energy Affairs (MEEA, 2013; TT Guardian, 2024).
Risk assessment combines the probability of maritime accidents with their associated consequences. The Formal Safety Assessment (FSA) guidelines published by the International Maritime Organisation (IMO) defines “risk” as the combination of the frequency/probability and the severity of the consequence (IMO, 2018). “Probability” is defined as the degree of confidence in the occurrence of an event, measured on a scale from 0 to 1, and “consequence” as the outcome of an accident including injuries and/or fatalities to passengers and crew, environmental impact, damage to the ship or port facilities, or commercial impact. Although the terms “likelihood” and “probability” are sometimes used interchangeably in the literature, they differ in application: likelihood is typically used in qualitative risk assessments to express expert judgement about the chance of an event occurring, whereas probability represents the statistical expectation or frequency of occurrence per unit of time (International Organisation of Marine Aids to Navigation (IALA), 2022a). The Safety of Life at Sea (SOLAS) Convention, Chapter V, Regulations 12 and 13 explain that Marine Aids to Navigation (AtoN) should be provided based on the volume of traffic and the degree of risk (IMO, 2020, 2024).
The FSA guidelines suggest quantifying consequences such as fatalities, environmental degradation, and commercial damage. They recommend doing so using observed Willingness-to-Pay (WTP) to avert a fatality, drawing on past decisions and their associated costs, as well as societal indicators such as the Life Quality Index (LQI). These recommended techniques form part of the Total Economic Value (TEV) framework which captures the full economic value of environmental and marine resources by summing both use and non-use components. Use values are benefits from direct or potential use of resources while non-use values reflect intrinsic worth (Bolt et al., 2005). The TEV framework has been widely adopted by institutions including the National Oceanic and Atmospheric Administration (NOAA; Arrow et al., 1993), the World Bank (2025) and the Organisation for Economic Co-operation and Development (OECD, 2012) to estimate the value of resources and therefore potential losses. These institutions have applied the TEV to inform policies concerning the protection of the marine environment.
A bibliometric review by Huang et al. (2023), covering 1,181 publications from 2000 to 2021, found that most maritime risk studies focus on accident probability rather than consequence assessment. Methods that allow consequence assessment typically express results using weighted scores or ranking systems. Moreover, only a few approaches combine probabilities with consequence values or visualise the outcomes through mapping. Expressing the consequences of potential maritime accidents for diverse goods and services in unified monetary terms allows direct integration with budget planning and cost-benefit analyses. Mapping risk spatially then enables clear visual identification of high-risk zones, supporting evidence-based resource allocation and effective communication with decision-makers.
Using the TEV framework, this study develops an adaptable method for the economic assessment of risks to maritime navigation within TT’s Exclusive Economic Zone (EEZ), with applicability to other SIDS. TT was selected as the study area because it is representative of the broader maritime landscape of SIDS within the Greater Caribbean Region (GCR), sharing maritime characteristics, governance frameworks, and environmental vulnerabilities (Seepersad & Davis, 2025). This study is guided by the following objectives:
- To estimate the value of potential consequences that may arise from maritime accidents occurring within the study area.
- To develop a monetary-based consequence scale specifically tailored for the assessment of maritime risks within the study area.
- To determine the probable economic consequences associated with maritime accidents, considering both the most likely (ML) and worst credible (WC) scenarios.
- To estimate and map risk values for the ML and WC scenarios by integrating the consequence and probability metrics.
The probability aspect of the equation “Risk = Probability × Consequence” was examined by Seepersad & Davis (2025), who modelled the drifting collision probability within TT’s EEZ. The current study focuses on the consequence component and the combination of probability with consequences. The results of the study present annual maritime navigation risks on maps and provides data that can be used to prioritise risk mitigation resources.
The remainder of this paper is structured as follows: Section 2 reviews the relevant literature on the valuation of resources that can be negatively impacted by maritime accidents. Section 3 outlines the method used to assess economic consequences of maritime accidents. Section 4 presents and discusses the results. Section 5 concludes with policy implications and recommendations for future research.
2 Literature review
2.1 Approaches for assessing the consequences of maritime accidents
Several established approaches are used to assess the negative consequences of maritime accidents. The International Association of Marine Aids to Navigation and Lighthouse (IALA) Guideline G1018 (IALA, 2022a) outlines methods that rely on historical data and expert judgement. For example, the Simplified IALA Risk Assessment (SIRA) method estimates risk using expert judgement and historical data. Scenarios are defined, and likelihood and consequence scores are assigned using assessment scales. IALA provides default assessment scales and recommends local adaptation but offers no specific guidance for doing so. The consequence scale combines monetary values, percentages, and qualitative descriptions, producing a composite risk score that guides whether control measures are needed to reduce risk to a level that is as low as reasonably practicable (ALARP; IALA, 2022c). The Ports and Waterways Safety Assessment (PAWSA) method similarly evaluates risk through weighted likelihood and consequence scores derived via the Delphi consensus technique (IALA, 2022d). The IALA Waterway Risk Assessment Programme (IWRAP) does not consider consequences.
The IMO also provides guidance for evaluating the impacts of maritime accidents (IMO, 2018). This process involves ranking available data and supplementing these rankings with expert judgement to ensure a comprehensive assessment. The FSA also recommends quantifying the potential costs associated with accident consequences through three main strategies: (i) observing the WTP to prevent adverse outcomes, (ii) analysing previous decisions and the financial implications attached to them, and (iii) considering societal indicators such as the LQI. These three strategies form part of the TEV framework.
2.2 Benefits of using the TEV to quantify consequences
Plottu & Plottu (2007) describe the TEV framework as a means of consolidating all categories of value associated with goods and services into a single monetary metric. Pearce & Özdemiroglu (2002) emphasise that assigning monetary values to non-market goods enables more informed decision-making. This aligns with the FSA (IMO, 2018), which notes that applying TEV to accident-related costs allows direct integration into cost-benefit analyses, improving comparability, transparency, and consistency in risk management. However, monetisation, while useful for analysis, may undervalue cultural, social, or intergenerational factors (Plottu & Plottu, 2007).
2.3 Institutions using the TEV framework
Institutions such as the NOAA, OECD, and World Bank apply the TEV framework in policy development, supporting numerous studies that inform cost-benefit analyses and economic decision-making. The NOAA Panel on Contingent Valuation (CV; Arrow et al., 1993), established under the Oil Pollution Act, validated the method for quantifying public WTP for environmental preservation. Carson et al. (2003) applied a dichotomous-choice CV survey following the Exxon Valdez oil spill on March 24, 1989, when the tanker ran aground in Prince William Sound, Alaska, releasing 11 million gallons of oil. The study quantified non-market damages and informed the Natural Resource Damage Assessment process. Regional studies, including (Schuhmann & Mahon, 2015), further demonstrate the framework’s relevance to SIDS. Despite recognition by the IMO and other international bodies, TEV remains underutilised in maritime risk assessment. Monetary consequences are rarely combined with accident probabilities to generate probability-weighted costs or mapped spatially to guide resource prioritization – an approach essential for meeting SOLAS Chapter V, Regulations 12 and 13.
2.4 TEV in maritime risk assessment
In this study, the TEV framework is applied to quantify the economic value of maritime goods and services that may be damaged or lost due to shipping incidents. The main valuation techniques and their global applications are summarised in Table 1. Because valuation outcomes depend on factors such as national income, demographics, and societal risk perception, results are interpreted as indicative rather than exact.

2.5 Design principles and recommended structure for CV surveys
Mitchell & Carson (1989) describe the CV method as a survey-based approach that asks respondents how much they would be WTP for the preservation or use of an environmental good or service. Implementation involves identifying the good or service being valued, defining the affected population, and selecting a representative sample to ensure the results reflect broader societal preferences.
Next, a questionnaire is developed to elicit WTP, providing respondents with a clear, neutral description of the good or service and the reasons for evaluating the proposed change. Details on changes in quantity, quality, or probability, along with current conditions and responsible agencies, should be clearly stated (Ashford, 2021). The NOAA Panel (Arrow et al., 1993) recommends the use of photos, maps, or illustrations to improve understanding, provided these remain neutral and non-persuasive. Respondents should also be reminded of budget constraints, trade-offs, and the availability of substitutes or alternative sites.
The next section of the questionnaire introduces the payment vehicle, specifying how contributions would be collected. Common CV payment vehicles include user fees, taxes, voluntary contributions, or price surcharges (Mitchell & Carson, 1989). Carson et al. (2003) selected a tax-based vehicle for the Exxon Valdez study, as volatile oil prices risked biasing responses. The NOAA Panel (Arrow et al., 1993) likewise recommended a referendum-style format with mandatory tax payments. While taxes enhance realism and credibility (Lee & Mjelde, 2007), low public trust can lead to protest responses (Stevens et al., 1991).
The final section of the questionnaire specifies the elicitation format used to measure WTP. Formats are either continuous, where respondents state or select an amount, or dichotomous, where they accept or reject a bid. Continuous formats include the open-ended approach, respondents state their maximum WTP, and the payment card, where they choose from a predefined list. Dichotomous formats include the single-bounded (one yes/no bid) and double-bounded (follow-up higher or lower bid) methods. A hybrid, the multiple-bounded format, presents a range of bid levels with graded certainty responses (e.g., “definitely yes” to “definitely no”), producing interval data (Bateman et al., 2002; Arrow et al., 1993).
Empirical comparisons of contingent valuation formats show mixed findings. The NOAA Panel recommends the dichotomous choice format because it mimics real market decisions and reduces cognitive burden, improving validity and response rates (Arrow et al., 1993). Carson et al. (2001) found that dichotomous formats typically yield higher WTP estimates than open-ended formats, which often generate zero or low bids. Smith (2000) noted that, although WTP values differ between these approaches, there is no definitive theoretical or empirical reason to prefer one exclusively. Frew et al. (2003) also reported higher WTP values from closed-ended instruments. Vaughan et al. (1999) argued that dichotomous surveys cannot directly elicit true WTP, recommending open-ended pre-tests to set bid ranges and benchmarks. The NOAA Panel’s framework remains the benchmark for CV survey design and validity assessment.
The choice of elicitation format affects both respondent behaviour and the econometric models used in analysis (Harris & Roach, 2021). Logistic and probit models are theoretically appropriate for dichotomous dependent variables, where outcomes are binary and relationships with predictors are non-linear (Cleary & Angel, 1984). In contrast, linear regression applies to continuous dependent variables, where outcomes vary across a range and relationships are assumed linear (Schneider et al., 2010).
The survey also captures socio-economic and demographic factors influencing WTP, including age, location, education, income, and marital status (Ashford, 2021). Face-to-face interviews are recommended for more reliable valuations, and surveys should clearly define the target population and sampling frame. Although non-response is common due to the cognitive effort required, well-designed instruments can still yield valid results (Arrow et al., 1993). Minimum sample size is often determined using the Krejcie & Morgan (1970) formula:
 |
(1) |
In Eq. 1, S is the required sample size, X2 is chi-square value (3.841 for 95 % confidence) for 1 degree of freedom at the 95 % confidence level (3.841), N is the population size, P is the population proportion, and d is the margin of error.
2.6 Econometric analysis of dichotomous WTP data
In binary logistic regression, the dependent variable is categorical with two outcomes (e.g. yes/no). The model is most theoretically expressed as
 |
(2) |
which models the log-odds (logit) of the event as a linear function of predictors. Equivalently, this can be transformed into the probability form:
 |
(3) |
maps this linear predictor onto a 0–1 probability scale. The logit form aids coefficient interpretation, while the probability form supports prediction. These formulations are standard in logistic regression theory (Chua, 2025; Harris, 2021). Analyses were performed in SPSS to test model validity and identify significant predictors.
According to Harris (2021), logistic regression outputs – coefficients, odds ratios (OR), and p-values – describe both the strength and significance of effects. The coefficient β shows the change in log-odds per unit change in a predictor; OR > 1 indicates increased likelihood, OR < 1 a reduced likelihood; and the p-value confirms statistical significance at p < 0.05.
2.7 Scenario analysis in maritime consequence assessment
While valuation and econometric methods quantify the monetary impacts of maritime accidents, they do not show how these impacts vary under different conditions. Scenario analysis complements these methods by evaluating outcomes across plausible situations, typically derived from historical accident data. Two common types are the ML scenario, reflecting expected outcomes under normal conditions, and the WC scenario, representing severe but realistic events while excluding extreme improbabilities (Riding & Rawson, 2015).
Building on Seepersad & Davis (2025), who modelled drifting collision probabilities in TT using Monte Carlo simulation, this study extends the analysis to the consequence dimension. Monetary consequences, estimated within the TEV framework, are combined with probability values to generate integrated, spatially mapped risk estimates. This approach provides policymakers in resource-limited SIDS with an evidence-based tool for prioritising maritime risk mitigation.
3 Method
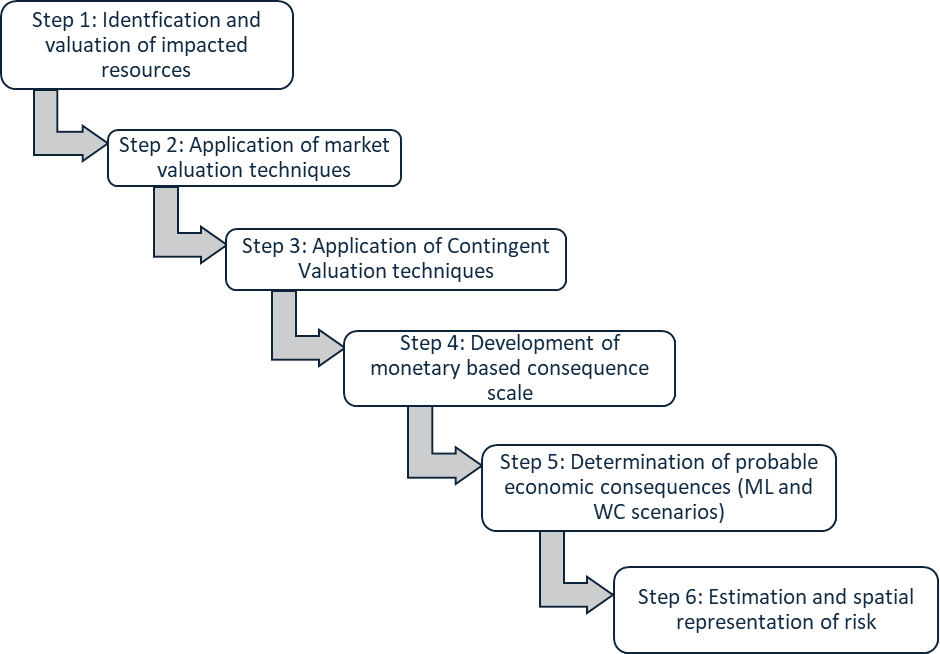
This study applies the TEV framework to monetise the potential consequences of maritime accidents within TT’s EEZ. The approach integrates market and CV techniques with probabilistic risk estimates derived from Seepersad & Davis (2025) to generate spatially explicit risk values that inform evidence-based prioritisation of mitigation measures. The monetisation process followed a structured, multi-step workflow summarised in Fig. 1 and subsequently detailed.
3.1 Step 1 – Identification and valuation of impacted resources
The assessment began with identifying resources most vulnerable to maritime accidents using open-source satellite imagery (Google Earth), literature review, and expert consultation (Step 1, Fig. 1). Key references, including A Guide to Beaches and Bays of Trinidad and Tobago (IMA, 2010), validated coastal resource boundaries and classifications. Fourteen experts from government agencies (Maritime Services Division, Environmental Management Authority, Ministries of Agriculture and Energy) and academia (University of the West Indies) contributed through structured interviews.
Vulnerability was determined by exposure to shipping activity, sensitivity to pollution or disturbance, and ecological or economic significance within TT’s coastal zone. Suitable valuation techniques were then selected to estimate annual economic contributions, covering both market and non-market values (Step 1, Fig. 1).
3.2 Step 2 – Application of market valuation techniques
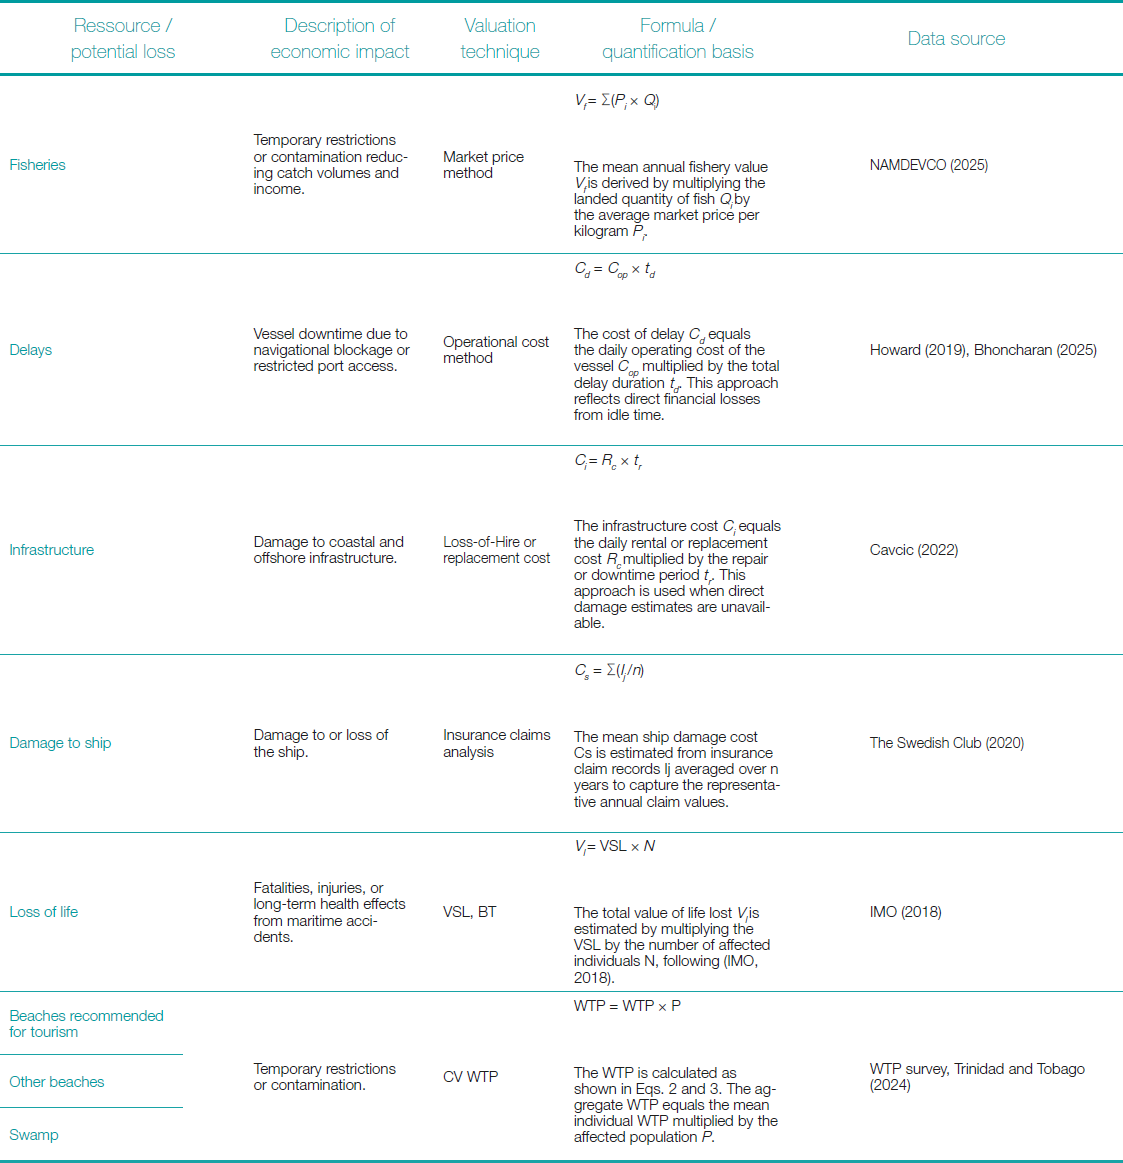
Table 2 outlines the key maritime resources, applied valuation methods (see also Table 1), relevant formulas, and data sources. Application of valuation techniques is summarised in Table 2 along with a further explanation of CV in Step 3.
3.3 Step 3 – Application of the contingent valuation technique
To estimate the economic value of environmental resources, a WTP survey was designed following best-practice guidelines from the NOAA Panel and other relevant literature. The objective was to elicit respondents’ willingness to reallocate tax payments toward protecting these resources from ship-based accidents.
A mixed-question format combined dichotomous and continuous components. The dichotomous section asked whether respondents were willing to pay (yes/no), capturing general support, while the continuous section quantified the amount, they were willing to pay for aggregation and analysis. The binary format enhanced realism and reduced cognitive effort, and the open-ended question provided finer resolution and cross-validation.
The survey minimised common CV biases, hypothetical, social desirability, anchoring, and framing through neutral wording and fact-based descriptions of resources, hazards, and mitigation actions. Data were collected in person (shopping malls, workplaces, universities) and online via social and professional networks, using snowball sampling to boost participation. The design and collection protocol was validated and approved by the University of the West Indies Ethics Committee. A pilot test refined clarity and flow. The final questionnaire included demographic (income, age, gender, education, occupation) and attitudinal (environmental awareness, prior visits) variables to identify predictors of WTP.
Binary logistic regression was used to model willingness, selected over linear regression due to the dichotomous nature of the dependent variable. Statistical significance was set at p < 0.05, and model fit was evaluated using standard diagnostics. Three parameters were interpreted: coefficient β, odds ratio (OR), and p-value.
3.4 Step 4 – Development of a Monetary-based consequence scale
The SIRA consequence scale (IALA, 2022c) formed the basis for developing the monetary-based consequence scale in this study. The original SIRA scale combines qualitative descriptions, indicative percentage losses, and occasional monetary values, recommending local adaptation but without guidance. This study addressed that gap by tailoring the scale to TT’s economic and environmental context. Retaining SIRA’s five-tier structure (insignificant to catastrophic), losses were expressed in locally derived monetary terms, providing a consistent and comparable measure of economic consequences across resources.
Where relevant, percentage losses from the SIRA guideline were multiplied by the estimated annual monetary value of each resource. For instance, a Tier 2 event representing a 10 % fisheries loss was applied to the annual fisheries value to estimate the corresponding economic loss. Because consequence models involve uncertainty, losses were expressed as monetary ranges rather than single values, following FAO/WHO (2006). The adapted scale also extends SIRA by including locally significant resources, such as beaches and swamps, ensuring relevance to the socioeconomic and environmental context of the study area.
3.5 Step 5 – Determination of probable economic consequences (ML and WC scenarios)
Building on the monetary consequence scale in Section 3.2, two scenarios were developed to represent plausible maritime accidents within TT’s EEZ. ML scenarios captured frequent, low-severity events identified from Maritime Services Division reports (Rambarran, 2021), newspaper archives (2018–2024), and expert input. Historical incidents and their distribution are detailed in (Seepersad & Davis, 2025). WC scenarios represented severe but credible accidents. Consequences for both scenarios were categorised using the five-tier monetary scale, with mean losses estimated and summed to ensure precision and consistency across resource categories.
3.6 Step 6 – Estimation and spatial representation of risk
For each scenario, the mean estimated loss from the monetary consequence scale was multiplied by the corresponding mean drifting collision probability for the area. Probabilities were derived from (Seepersad & Davis, 2025), who subdivided larger areas into operationally similar segments. The areas were defined by maritime activity, vessel type, and exposure to oceanographic conditions such as currents, winds, and waves, ensuring each zone represented a distinct operational and environmental risk unit. Using mean probability and consequence values produced representative annual risk estimates and maintained consistency across categories, following the standard formulation: Risk = Probability × Consequence.
4 Results
Sections 4.1 and 4.2 present the resources identified as vulnerable to maritime accidents, the valuation techniques applied, and the corresponding estimated economic losses.
4.1 Estimated economic losses for market-valued resources
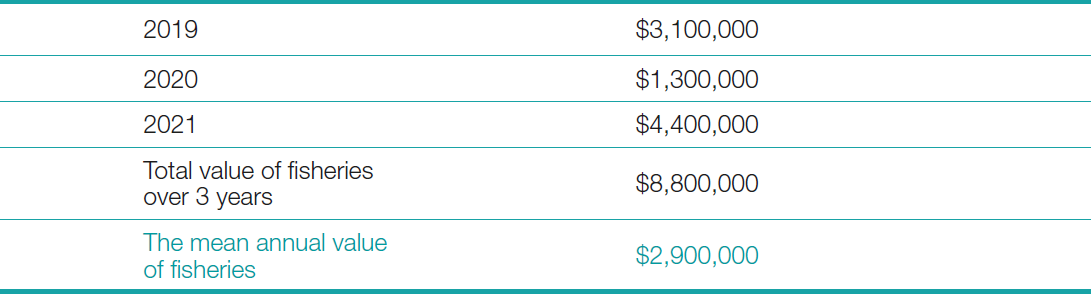
Fisheries: The annual value of fisheries was calculated by multiplying landed quantities by corresponding market prices per kilogram. Monthly landing data from NAMDEVCO (2025) were analysed for two key sites, Port of Spain and Orange Valley, covering 2019–2021. The mean of the three yearly totals (Table 3) was used as the representative annual value, indicating the potential direct economic loss to the fisheries sector. For broader application, major landing sites should be included, with supplementary data from cooperatives or government agencies when official statistics are unavailable.
Delays: Economic losses from vessel delays were estimated using the operational cost method. The daily operating cost of a Very Large Crude Carrier (VLCC) was taken as USD 25,000, representing break-even levels (Howard, 2019). In Trinidad and Tobago, vessels are typically allocated 72 hours (three days) of laytime; delays beyond this threshold were valued at USD 25,000 per additional day (Bhoncharan, 2025). In other contexts, standard laytime policies and cost structures should be obtained from port or industry sources.
Offshore infrastructure: Losses to offshore installations were estimated using the loss-of-hire or replacement cost method. Public data for the Noble Jack-up rig, operational in Trinidad and Tobago since 2013, indicate a daily cost of USD 107,000 (Cavcic, 2022). Where repair data were unavailable, durations from similar incidents were used as proxies. For other contexts, daily operational costs should be sourced from regulators or industry reports.
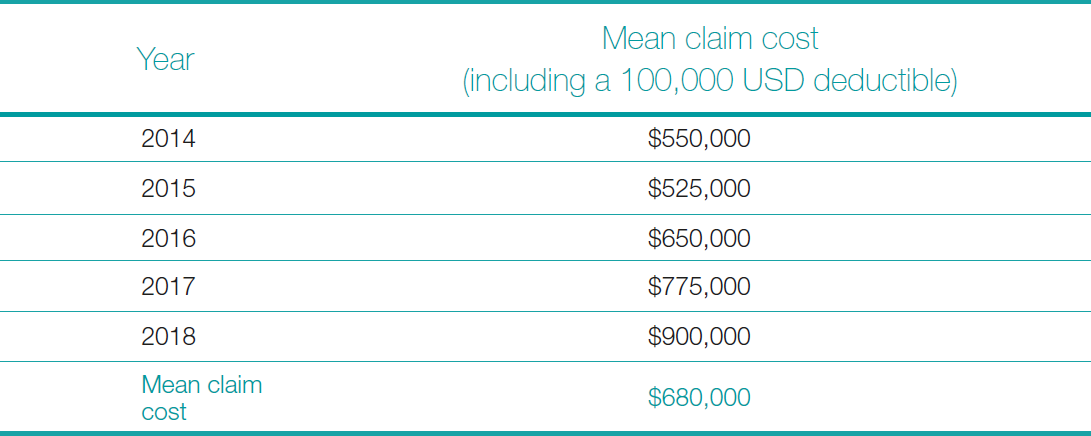
Ship damage: Costs associated with ship damage were estimated using insurance claims data provided by the Swedish Club (2020). The analysis covered over 600 navigational claims exceeding USD 10,000 between 2014 and 2018, incorporating a mean deductible of USD 100,000. The mean of the annual mean claim costs (Table 4) was adopted as a proxy for expected damage, ensuring deductibles were explicitly considered.
Human life: Valuation of fatalities and injuries followed the FSA (IMO, 2018), which assigns a total value of USD 3 million-USD 1.5 million each for fatalities and injuries or ill health. Ratios based on fatality and injury probabilities were applied to estimate total economic losses. Using the IMO-recommended VSL aligns with OECD (2012) benefit transfer principles, enabling cost-effective adaptation to national contexts.
4.2 Estimated economic values for non-market resources using CV
4.2.1 CV WTP-survey results
A total of 384 surveys were distributed, of which 188 were returned with complete responses, yielding a 49 percent completion rate. Although below the target, this aligns with typical CV studies, where the hypothetical nature of valuation tasks and the cognitive effort required can reduce response rates. The NOAA Panel notes that lower rates reflect task difficulty rather than disengagement. Dataset adequacy was confirmed using the Events-Per-Predictor (EPP) rule (Riley et al., 2019), which recommends at least 10 positive responses per predictor. With 15 predictors and 188 cases, the dataset met this threshold, ensuring sufficient power for robust binary logistic regression analysis.
4.2.2 Regression findings
The dependent variable represented respondents’ WTP (1 = willing, 0 = not willing). The random order of survey responses confirmed independence of observations, satisfying the assumption that data points were not repeated measures from the same individuals. One extreme outlier in the WTP data was replaced with the modal value to minimise distortion of the mean while maintaining the dataset’s central tendency. The overall model was statistically significant (p < 0.005), indicating that the predictors collectively improved model fit relative to a null model. These conditions confirm that the estimated coefficients and odds ratios are reliable and interpretable.
Income and occupational status emerged as the most significant predictors of WTP. Respondents reporting no income were 95 % less likely to support tax reallocation compared to higher-income groups (OR = 0.048, p = 0.008), while those earning between USD 5,000 and USD 10,000 annually were 91 % less likely (OR = 0.093, p = 0.026). Conversely, individuals employed in professional or managerial roles were 7.7 times more likely to support reallocation (OR = 7.676, p = 0.015), and those in the “other” occupational category were 9.2 times more likely (OR = 9.212, p < 0.001). An OR greater than 1 indicates that the predictor increases the likelihood of willingness to pay, while an OR less than 1 indicates a decrease in likelihood. The p-value shows the level of statistical significance, with values below 0.05 suggesting that the observed effect is unlikely to have occurred by chance.
Age, education, visit frequency, and environmental awareness did not reach significance, suggesting that willingness to reallocate tax funds is primarily shaped by economic capacity rather than demographic or attitudinal factors. Some of these results displayed numerical instability, a condition where extreme coefficients or odds ratios occur due to sparse data in certain categories (e.g., no respondents in a given age group expressing willingness). While education and environmental awareness showed weak positive trends, the effects were not sufficiently strong to draw firm conclusions. Overall, the regression analysis confirms that economic capacity, as reflected in income and occupational status, is the primary determinant of WTP in this context.
While overall WTP was consistent across marine resources, the amount respondents were prepared to contribute varied by resource type. The mean WTP for the Caroni Swamp was USD 198.89 and mode USD 45. For beaches recommended for tourism the mean was USD 121.27 and median USD 73.50. For non-tourism beaches the mean was USD 102.90 and median USD 45. In all cases, the most frequently stated value (mode) was USD 14.70. The mode is considered a more reliable basis for policy recommendations than the mean, as it reflects the typical respondent’s capacity to contribute and avoids inflation from a small number of high-income outliers.
Central Statistical Office data (CSO, 2025) indicate a mean monthly household income of about USD 1,353, so higher thresholds would likely overestimate most taxpayers’ capacity. Since the study measures the reallocation of existing taxes rather than new taxation, realistic and equitable values are essential. Using the mode WTP and the national population of 1,368,333, the estimated total contribution for each resource was calculated as:
| Total Contribution = Mode WTP x Population | (4) |
Substituting the values, 14.70 × 1,368,333 yields approximately USD 20.1 million.
4.3 Monetary-based consequence scale for the study area
The monetary-based consequence scale adapted from the SIRA Guideline (IALA, 2022c) is presented in Table 5.

4.4 Economic consequences associated with ML and WC scenarios
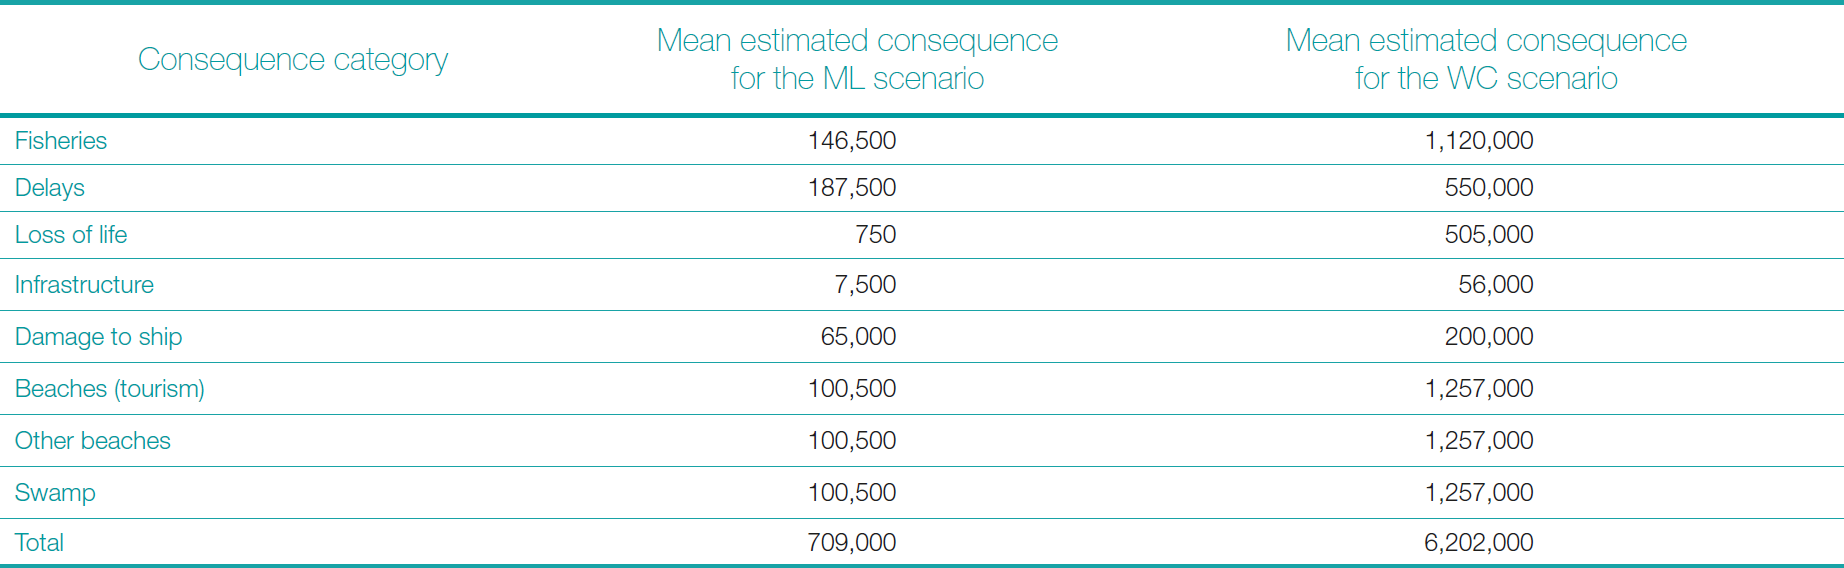
This section quantifies the economic losses for the ML and WC scenarios. The ML scenario involves a drifting collision between a medium-sized SOLAS vessel and a smaller non-SOLAS craft (e.g., fishing boat) in rough seas within TT’s EEZ, causing moderate vessel damage but no major spill or fatalities. Such events occur at an estimated rate of 0.6 per year, mainly due to human error and adverse weather (Seepersad & Davis, 2025). The WC scenario involves a SOLAS-class oil tanker (e.g., the Gulfstream tanker) colliding nearshore, resulting in a major spill, severe environmental damage, and financial and human losses. Mean total losses were approximately USD 0.7 million for ML and USD 6.2 million for WC, dominated by environmental and operational impacts (Table 6).
4.5 Estimated spatial risk values
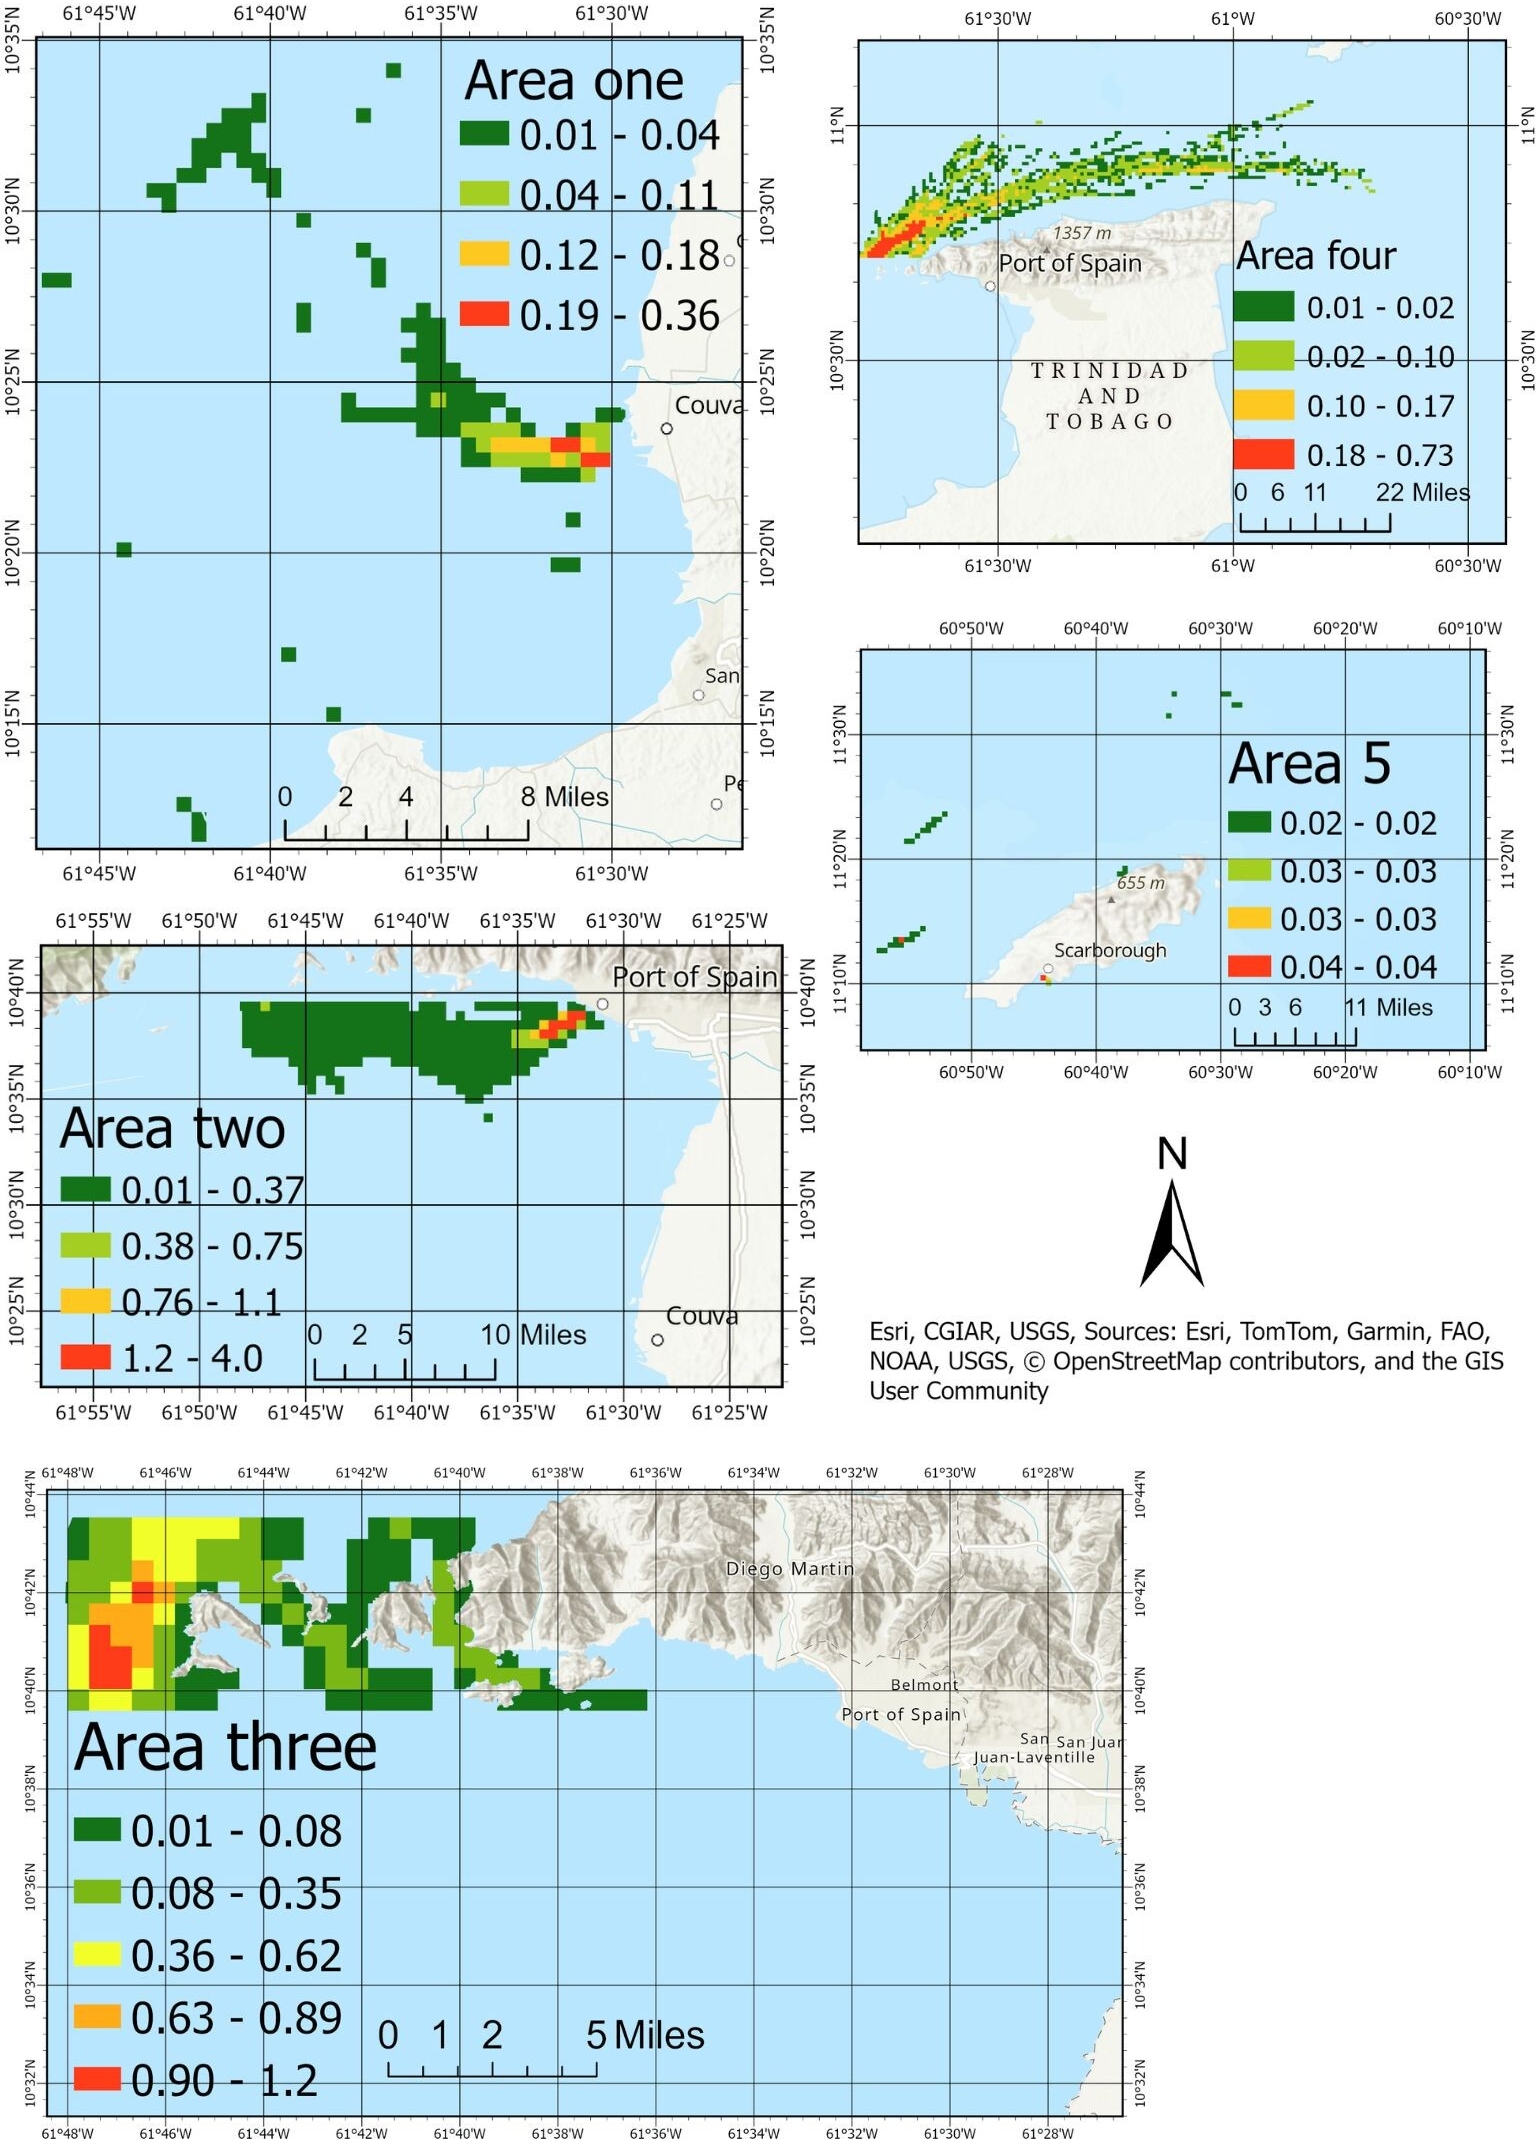
Fig. 2 presents the spatial distribution of drifting collision probabilities across five focus areas within TT’s waters. Each map (Areas one to five) shows grid cells colour-coded from green (low) to red (high) according to the probability that a drifting vessel will collide at that location. Numeric ranges beside the colour bar indicate model-derived probabilities. Area one shows generally low probabilities with isolated instances of higher risk. Area two reveals the highest variability and overall drifting probability, indicating the need for prioritised risk mitigation strategies. Area three shows stable yet slightly elevated probabilities compared to Area one. Area four shows moderate risks, with distinct pockets of higher probability, while Area five maintains a stable and consistently low-risk profile with minimal variation (Seepersad & Davis, 2025).
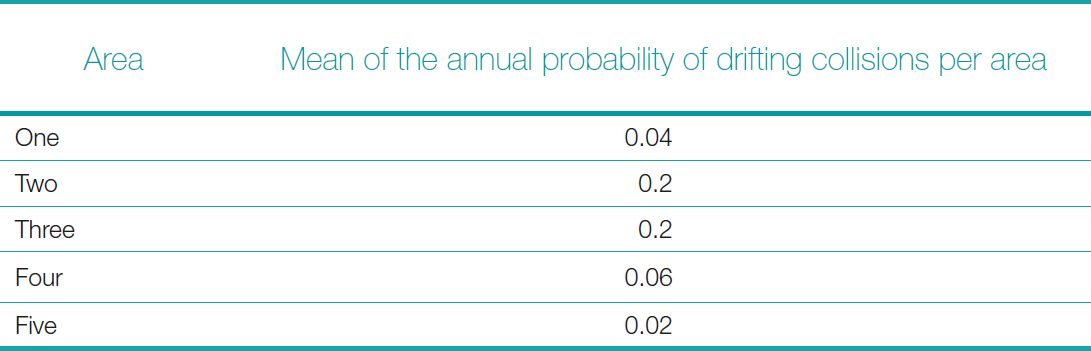
The mean of the annual probability of drifting collisions per area is presented in Table 7.
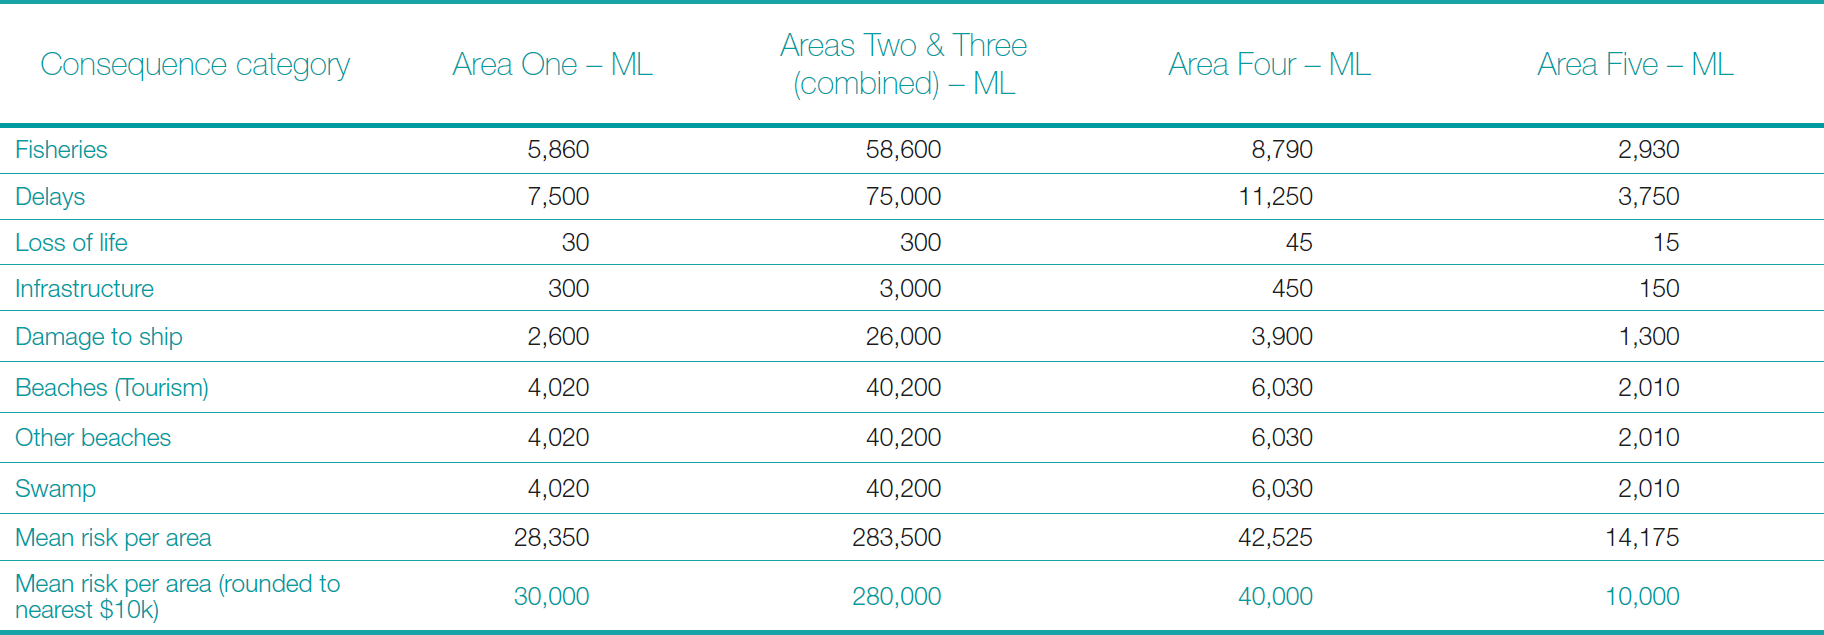
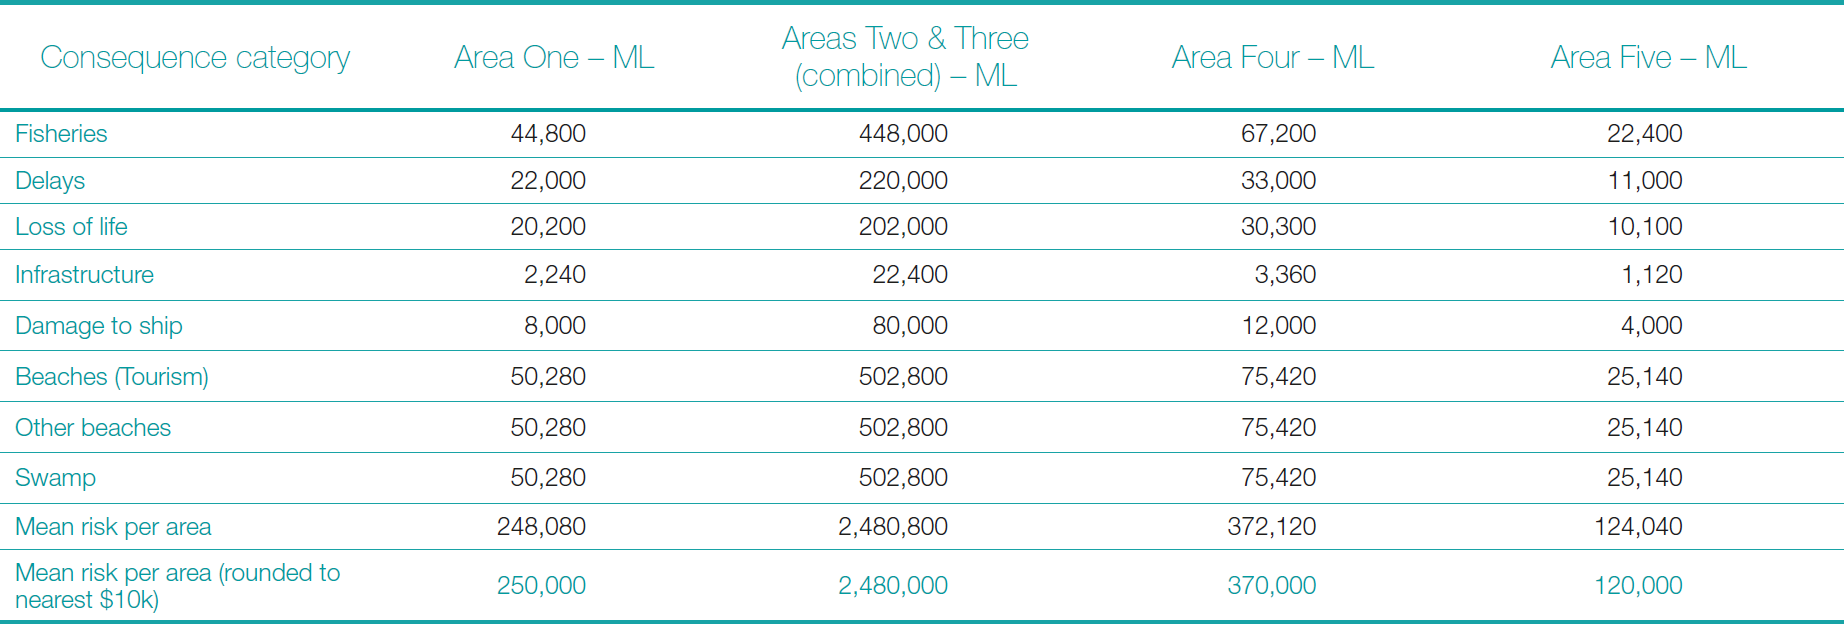
The mean probability of drifting collision per area (Table 7) was combined with the mean economic consequence estimates from Table 6 to calculate the annual risk (USD) for each area and scenario (ML and WC). The results are presented in Tables 8 and 9.
5 Discussion
5.1 Economic implications of potential losses from maritime accidents
Socio-economic status, particularly income and occupation, emerged as the most influential determinants of WTP. Respondents with lower incomes were significantly less likely to support reallocating taxes for marine conservation, reaffirming that financial constraints limit participation even among those expressing environmental concern. In contrast, individuals in higher occupational categories demonstrated greater willingness, reflecting both greater economic capacity and a stronger sense of environmental responsibility. The absence of significant effects for education and environmental awareness suggests that financial capacity exerts a stronger influence on willingness than attitudinal factors. Although stated willingness was generally high, respondents frequently raised concerns about affordability and fairness, indicating that support was conditional, anchored in principle but constrained by household budgets. Any overstatement of willingness may have occurred due to social desirability bias, whereby respondents provide answers aligned with perceived social norms of environmental responsibility.
The regression model exhibited sound performance, consistent with socio-economic theory and statistically significant at the five percent level. Given that the objective of this research was to develop a practical, transferable approach for SIDS, emphasis was placed on achieving a parsimonious model with clear, interpretable results rather than complex statistical optimisation. This reflects the study’s focus on ensuring that the analytical framework remains applicable in maritime administrations with limited technical or financial resources. Future applications of this approach could include additional diagnostics, such as pseudo-R² statistics and classification accuracy, to further demonstrate model robustness and predictive reliability.
Median WTP amounts varied across resource types, indicating that respondents distinguished between ecosystems based on perceived importance. The Caroni Swamp received the highest valuation, reflecting its ecological rarity and cultural significance, while non-tourism beaches were valued lower, suggesting a preference for resources that provide direct recreational or economic benefits. Survey design effects may also have contributed to this pattern since the swamp appeared first, respondents may have stated higher amounts before experiencing budget fatigue; a recognised response pattern in CV studies. Randomising question order in future surveys would help control for such effects.
These behavioural findings carry clear policy were significantly less likely to support reallocating taxes for marine conservation, reaffirming that financial constraints limit participation even among those expressing environmental concern. In contrast, individuals in higher occupational categories demonstrated greater willingness, reflecting both greater economic capacity and a stronger sense of environmental responsibility. The absence of significant effects for education and environmental awareness suggests that financial capacity exerts a stronger influence on willingness than attitudinal factors. Although stated willingness was generally high, respondents frequently raised concerns about affordability and fairness, indicating that support was conditional, anchored in principle but constrained by household budgets. Any overstatement of willingness may have occurred due to social desirability bias, whereby respondents provide answers aligned with perceived social norms of environmental responsibility.
The regression model exhibited sound performance, consistent with socio-economic theory and statistically significant at the five percent level. Given that the objective of this research was to develop a practical, transferable approach for SIDS, emphasis was placed on achieving a parsimonious model with clear, interpretable results rather than complex statistical optimisation. This reflects the study’s focus on ensuring that the analytical framework remains applicable in maritime administrations with limited technical or financial resources. Future applications of this approach could include additional diagnostics, such as pseudo-R² statistics and classification accuracy, to further demonstrate model robustness and predictive reliability.
Median WTP amounts varied across resource types, indicating that respondents distinguished between ecosystems based on perceived importance. The Caroni Swamp received the highest valuation, reflecting its ecological rarity and cultural significance, while non-tourism beaches were valued lower, suggesting a preference for resources that provide direct recreational or economic benefits. Survey design effects may also have contributed to this pattern since the swamp appeared first, respondents may have stated higher amounts before experiencing budget fatigue; a recognised response pattern in CV studies. Randomising question order in future surveys would help control for such effects.
These behavioural findings carry clear policy implications. Tiered contribution systems proportional to income could improve fairness and affordability, while allocating a portion of tourism revenue to marine conservation may better align funding with perceived value. Communication campaigns should highlight the long-term and intergenerational benefits of conservation, as these motivations tend to influence willingness. Longitudinal studies could assess whether WTP remains stable under changing economic or environmental conditions, while alternative statistical methods, such as generalised linear or hierarchical models, could refine segmentation and improve predictive accuracy.
Finally, the framework developed in this study integrates accident probability with economic consequence, addressing a key gap in previous maritime risk approaches that emphasised probability alone. By localising consequence categories to the economic and environmental conditions of TT’s EEZ, the framework provides a practical and transferable technique for prioritising risk mitigation and resource allocation in SIDS where maritime sectors underpin national economies.
5.2 Applicability and relevance of the consequence scale
The consequence scale classified impacts by severity across key loss categories, using monetary estimates from the valuation framework. This enabled consistent comparison of both ML and WC accidents within a single assessment system. Expressing losses in monetary terms supports cost-benefit and budget planning, strengthening policy relevance. Adaptation to local data and expert input shows that the framework is practical for SIDS, where resources are limited, ensuring methodological rigour and transferability across maritime administrations.
5.3 Estimated economic consequences of the ML and WC scenarios
The results show a pronounced difference in economic magnitude between the ML and WC scenarios. Under the ML scenario, total mean losses were approximately USD 0.7 million, with the largest impacts from delays (USD 187,500) and fisheries (USD 146,500), followed by moderate effects on beaches, swamps, and ship damage. In contrast, the WC scenario produced total losses of USD 6.2 million, dominated by damages to beaches, swamps, and fisheries, each exceeding USD 1.2 million. These findings highlight that while minor incidents cause manageable but recurrent costs, rare severe events could impose substantial, economy-wide losses.
5.4 Integrated risk estimates combining probability and consequence metrics
Risk values were estimated by multiplying mean losses for each scenario by the mean drifting collision probability for each area. Annual drifting-collision risks ranged from USD 10,000 in Area Five to USD 2.48 million along the north-western coastline (Areas Two and Three). These areas show the highest risk due to dense vessel traffic, navigational constraints, and environmental sensitivity, underscoring the need for targeted preventive and mitigation measures (Seepersad & Davis, 2025).
6 Conclusion
This study developed an adaptable economic risk assessment framework grounded in the TEV approach, addressing risks to maritime navigation within TT’s EEZ and offering applicability to other SIDS. The framework achieved all four objectives: it quantified potential economic consequences of maritime accidents; constructed a locally relevant, monetary-based consequence scale; estimated losses under both ML and WC scenarios; and integrated these with probability metrics to produce spatially explicit risk maps. The findings revealed that while frequent minor incidents impose modest but recurrent costs, rare high-severity events could generate multi-million-dollar losses. By combining economic valuation with probabilistic risk modelling, the framework provides maritime administrations with a practical, transferable decision-support tool for prioritising mitigation measures and optimising resource allocation in vulnerable maritime regions.
7 Strengths, limitations, and future directions
The strength of this study lies in integrating historical accident data, market valuation, and CV surveys, enhancing reliability through multiple evidence sources. Using locally derived data grounds estimates in real economic conditions, while standardised methods ensure comparability across resource types. The monetary consequence scale marks a major advancement but has limitations. The TEV framework depends on stated preferences, which can introduce uncertainty when respondents are unfamiliar with the resources being valued. The monetary ranges are indicative, providing realistic but generalised estimates rather than precise figures. Percentage losses were adapted from the SIRA scale, offering plausible but simplified relationships. Furthermore, the scale does not fully capture secondary or long-term ecological and socio-economic effects extending beyond the immediate incident timeframe. The scenario-based approach aligns with the FSA (2018) and offers a practical, transferable decision-support tool for maritime administrations. Future work should validate the results of this study against real incident data to refine predictive accuracy and integrate real-time environmental and vessel-traffic parameters. Applying it across other SIDS across the world would further confirm its robustness and generalisability to diverse maritime contexts.
References
Abdullah, S., Markandya, A. and Nunes, P. A. L. D. (2011). Introduction to economic valuation methods. In P. A. L. D. Nunes, P. Kumar, and A. Markandya (Eds.), Handbook on the Economics of Ecosystem Services and Biodiversity (pp. 143–187). World Scientific, Singapore. https://doi.org/10.1142/9789814289238_0005
Arrow, K., Solow, R., Portney, P. R., Leamer, E. E., Radner, R. and Schuman, H. (1993). Report of the NOAA Panel on Contingent Valuation. National Oceanic and Atmospheric Administration, U.S. Department of Commerce. https://repository.library.noaa.gov/view/noaa/60900 (last accessed 25 October 2025).
Ashford, G. (2021) Contingent valuation method [Video]. University of the Sunshine Coast, Queensland, Australia. https://www.youtube.com/watch?v=C7dLbWEmOMY (last accessed 3 October 2025).
Bateman, I. J., Carson, R. T., Day, B., Hanemann, M., Hanley, N., Hett, T., Jones-Lee, M., Loomes, G., Mourato, S., Özdemiroglu, E., Pearce, D. W., Sugden, R. and Swanson, J. (2002). Economic Valuation with Stated Preference Techniques: A Manual. Edward Elgar Publishing, Cheltenham, UK.
Bhoncharan, B. (2025). Interview with Shivani Seepersad. Phoenix Park Gas Processors Limited, Trinidad.
Bolt, K., Ruta, G. and Sarraf, M. (2005) Estimating the cost of environmental degradation. The World Bank Environment Department, Washington, DC, USA.
Carson, R. T., Flores, N. E. and Meade, N. F. (2001). Contingent valuation: Controversies and evidence. Environmental and Resource Economics, 19(2), pp. 173–210. https://doi.org/10.1023/A:1011128332243
Carson, R. T., Mitchell, R. C., Hanemann, W. M., Kopp, R. J., Presser, S. and Ruud, P. A. (2003). Contingent valuation and lost passive use: Damages from the Exxon Valdez oil spill. Environmental and Resource Economics, 25(3), pp. 257–286. https://doi.org/10.1023/A:1024486702104
Cavcic, M. (2022). Rig workers evacuated following issue on Noble jack-up. Offshore Energy, Schiedam, The Netherlands. https://www.offshore-energy.biz/rig-workers-evacuated-following-issue-on-noble-jack-up (last accessed 10 August 2025).
Chua, K. (2025) Binary Logistic Regression. In C. Hua, Y.-J. Choi and Q. Shi, Companion to BER 642: Advanced Regression Methods, bookdown – Authoring Books and Technical Documents with R Markdown. https://bookdown.org/chua/ber642_advanced_regression/binary-logistic-regression.html (last accessed 25 October 2025).
Cleary, P. D. and Angel, R. (1984). The analysis of relationships involving dichotomous dependent variables. Journal of Health and Social Behavior, 25(3), pp. 334–348.
CSO (2025). Household Budgetary Survey (HBS). Central Statistical Office, Port of Spain, Trinidad and Tobago. https://cso.gov.tt/household-budgetary-survey-hbs/ (last accessed 10 August 2025).
DOT (2021). Revised Departmental Guidance on Valuation of a Statistical Life in Economic Analysis. United States Department of Transportation, Washington, DC, USA. https://www.transportation.gov/office-policy/transportation-policy/revised-departmental-guidance-on-valuation-of-a-statistical-life-in-economic-analysis (last accessed 25 October 2025).
Du Plessis, F., Goedhals-Gerber, L., and Van Eeden, J. (2023). Trends in weather-related marine cargo insurance claims: A South African perspective. Journal of Transport and Supply Chain Management, 17, https://doi.org/10.4102/jtscm.v17i0.954
EcosystemValuation (2025) Uses of ecosystem valuation. https://www.ecosystemvaluation.org/uses.htm (last accessed 1 October 2025).
EPA (2017). Cost Estimation: Concepts and Methodology. In EPA Air Pollution Control Cost Manual (7th ed). U.S. Environmental Protection Agency, Washington, DC. https://www.epa.gov/sites/default/files/2017-12/documents/epaccmcostestimationmethodchapter_7thedition_2017.pdf (last accessed 8 October 2025).
FAO/WHO (2006). Risk characterization of microbiological hazards in food: Linking risk assessment and economic analysis. Microbiological Risk Assessment Series, 17. Food and Agriculture Organization of the United Nations/World Health Organization, Rome, Italy.
Frew, E. J., Whynes, D. K. and Wolstenholme, J. L. (2003). Eliciting willingness to pay: Comparing closed-ended with open-ended and payment scale formats. Medical Decision Making, 23(2), pp. 150–159. https://doi.org/10.1177/0272989X03251245
Gonyo, S. B., Goedeke, T. L., Wolfe, K. E., Jeffrey, C. F. G., Gorstein, M., Poti, M. and Dorfman, D. S. (2019). An economic analysis of shipping costs related to potential changes in vessel operating procedures to manage the co-occurrence of maritime vessel traffic and whales in the Channel Islands region. Marine Policy, 106, 103523. https://doi.org/10.1016/j.marpol.2019.103523
Harris, J. K. (2021). Primer on binary logistic regression. Family Medicine and Community Health, 9(Suppl 1), p. e001290. https://doi.org/ 10.1136/fmch-2021-001290
Harris, J. M. and Roach, B. (2021). Environmental and natural resource economics: A contemporary approach (5th ed.). Routledge, Abingdon, UK. https://doi.org/10.4324/9781003080640
Howard, M. (2019). BIMCO: VLCC Freight Rates from Gulf to China Doubles. MarineLink, Maritime Activity Reports, Inc., Easton, USA. https://www.marinelink.com/news/bimco-vlcc-freight-rates-gulf-china-467582 (last accessed 10 August 2025).
Huang, Y., Wang, C., Zhang, D. and Li, K. (2023) A review on risk assessment methods for maritime transport. Ocean Engineering, 279, 114577. https://doi.org/10.1016/j.oceaneng.2023.114577
IALA (2022a). Risk Management (G1018, 4 ed.). International Association of Marine Aids to Navigation and Lighthouse, Staint Germain en Laye, France. https://www.iala.int/product/g1018/ (last accessed 9 August 2025).
IALA (2022b). The Use of IALA Waterway Risk Assessment Programme (G1123, 2.1 ed.). International Association of Marine Aids to Navigation and Lighthouse, Staint Germain en Laye, France. https://www.iala.int/product/g1123/ (last accessed 20 January 2025).
IALA (2022c). The Use of the Simplified IALA Risk Assessment Method (G1138, 2.0 ed.). International Association of Marine Aids to Navigation and Lighthouse, Staint Germain en Laye, France. https://www.iala.int/product/g1138/ (last accessed 20 January 2025).
IALA (2022d). The Use of Ports and Waterways Safety Assessment (G1124, 2.1 ed.). International Association of Marine Aids to Navigation and Lighthouse, Staint Germain en Laye, France. https://www.iala.int/product/g1124/ (last accessed 20 January 2025).
IMA (2010). A Guide to Beaches and Bays of Trinidad and Tobago. Institute of Marine Affairs, Chaguaramas, Trinidad and Tobago, ISBN 978-976-8194-17-6.
IMO (2010). Global Integrated Shipping Information System (GISIS) (Incident record: C0008290). International Maritime Organization, London, United Kingdom. https://gisis.imo.org/Public/MCIR/Occurrence.aspx?Reference=C0008290 (last accessed 30 January 2025).
IMO (2018). Revised guidelines for Formal Safety Assessment (FSA) for use in the IMO rule-making process (MSC-MEPC.2/Circ.12/Rev.2). International Maritime Organization, London, United Kingdom.
IMO (2020). International Convention for the Safety of Life at Sea (SOLAS) [Consolidated Edition 2020]. International Maritime Organization, London, United Kingdom. https://www.imo.org/en/About/Conventions/Pages/International-Convention-for-the-Safety-of-Life-at-Sea-(SOLAS),-1974.aspx (last accessed 30 January 2025).
IMO (2024). Global Integrated Shipping Information System (GISIS) (Incident record: C1000310). International Maritime Organization, London, United Kingdom. https://gisis.imo.org/Public/MCIR/Occurrence.aspx?Reference=C1000310 (last accessed 30 January 2025).
IMO (2024). IALA Risk Management Toolbox for Aids to Navigation and Vessel Traffic Services. (SN.1/Circ.296/Rev.1). International Maritime Organization, London, United Kingdom.
ISO (2018). ISO 31000:2018 – Risk management – Guidelines (2nd ed.). International Organization for Standardization, Geneva, Switzerland.
ITOPF (2025). Atlantic Empress, West Indies, 1979. ITOPF Ltd, London, United Kingdom. https://www.itopf.org/in-action/case-studies/atlantic-empress-west-indies-1979/ (last accessed 30 January 2025).
Kettunen, M., and ten Brink, P. (2006). Value of biodiversity: Documenting EU examples where biodiversity loss has led to the loss of ecosystem services. Final report for the European Commission. Institute for European Environmental Policy (IEEP), Brussels.
Khanal, B. R. (2001) Economic valuation of forest resources. Institute of Forestry, Tribhuvan University, Kathmandu.
Krejcie, R. V. and Morgan, D. W. (1970). Determining sample size for research activities. Educational and Psychological Measurement, 30(3), pp. 607–610. https://doi.org/10.1177/001316447003000308
Lee, C. and Mjelde, J. W. (2007). Valuation of ecotourism resources using a contingent valuation method: The case of the Korean DMZ. Ecological Economics, 63(2–3), pp. 511–520. https://doi.org/10.1016/j.ecolecon.2007.01.005
MEEA (2013). The National Oil Spill Contingency Plan of Trinidad and Tobago. Ministry of Energy and Energy Affairs, Government of the Republic of Trinidad and Tobago, Port of Spain, Republic of Trinidad and Tobago.
Mitchell, R. C. and Carson, R. T. (1989) Using surveys to value public goods: the contingent valuation method. Resources for the Future, Washington, DC, USA.
NAMDEVCO (2025). Publication. National Agricultural Marketing and Development Corporation, Debe, Trinidad and Tobago. https://www.namdevco.com/publication (last accessed 12 August 2025).
Nwoloziri, C. N., Nze, I., Hlali, A., Nwachukwu, T. and Nwokedi, T. (2025). Estimation of cost of delays on vessel operations in container terminals of Apapa seaports. Journal of Maritime Research, 22(1), pp. 217–223.
OECD (2012). Mortality Risk Valuation in Environment, Health and Transport Policies [Report]. Organisation for Economic Co-operation and Development, OECD Publishing, Paris, France. https://doi.org/10.1787/9789264130807-en
Pearce, D. and Özdemiroglu, E. (2002). Economic Valuation with Stated Preference Techniques: Summary Guide. Department for Transport, Local Government and the Regions, London, UK. https://assets.publishing.service.gov.uk/media/5a750ff740f0b6397f35d5f5/Economic_valuation_with_stated_
preference_techniques.pdf (last accessed 25 October 2025).
Plottu, E. & Plottu, B. (2007). The concept of Total Economic Value of environment: A reconsideration within a hierarchical rationality. Ecological Economics, 61(1), pp. 52–61. https://doi.org/10.1016/j.ecolecon.2006.09.027
Počuča, M. (2006). Methodology of Day-To-Day Ship Costs Assessment. Promet — Traffic & Transportation, 18(5), pp. 337–345.
Rambarran, T. (2021). Correspondence on vessel accidents [Unpublished]. Maritime Services Division, Trinidad and Tobago.
Riding, J. and Rawson, A. (2015). LINZ Hydrography Risk Assessment Methodology Update (report number 15NZ322, issue 03). Land Information New Zealand (LINZ), Wellington, New Zealand. https://iho.int/uploads/user/Inter-Regional%20Coordination/WEND-WG/WENDWG%20Repository/SWPRHP-Hydrography-Risk-Assessment-Methodology.pdf (last accessed 7 April 2025).
Riley, R. D., Snell, K. I. E., Ensor, J., Burke, D. L., Harrell, F. E., Jr, Moons, K. G. M. and Collins, G. S. (2019). Minimum sample size for developing a multivariable prediction model: Part II – binary and time to event outcomes. Statistics in Medicine, 38(7), pp. 1276–1296.
Rozza, H. H., Elhoseny, T. A., Abbas, S. H. and Mosallam, R. A. (2025). Patients’ willingness to pay for health care quality improvement under universal healthcare coverage in Egypt. Journal of the Egyptian Public Health Association, 100(1), p. 15. https://doi.org/10.1186/s42506-025-00195-x
Schneider, A., Hommel, G. and Blettner, M. (2010). Linear regression analysis. Dtsch Arztebl Int, 107(44), pp. 776–82. https://doi.org/10.3238/arztebl.2010.0776
Schuhmann, P. W. and Mahon, R. (2015). The valuation of marine ecosystem goods and services in the Caribbean: A literature review and framework for future valuation efforts. Ecosystem Services, 11, pp. 56–66.
Seepersad, S. and Davis, D. (2025). Integrating data-limited techniques for maritime risk assessment in Small Island Developing States. The International Hydrographic Review, 31(1), pp. 102–118. https://doi.org/10.58440/ihr-31-1-a06
Smith, R. D. (2000). The discrete-choice willingness-to-pay question format in health economics: Should we adopt environmental guidelines? Medical Decision Making, 20(2), pp. 194–204. https://doi.org/10.1177/0272989X0002000209
Stevens, T. H., Echeverria, J., Glass, R. J., Hager, T. and More, T. A. (1991). Measuring the existence value of wildlife: What do CVM estimates really show? Land Economics, 67(4), pp. 390–400. https://doi.org/10.2307/3146546
The Swedish Club (2020). Navigational Claims. The Swedish Club, Gothenburg, Sweden. https://www.swedishclub.com/uploads/2023/12/TSC-Nav-Claims-2020_WEB.pdf (last accessed 10 August 2025).
TT Guardian (2024). PM weighing foreign help if oil spill worsens. https://www.guardian.co.tt/news/pm-weighing-foreign-help-if-oil-spill-worsens-6.2.1923219.50bcf5d956 (last accessed 26 March 2025).
Vaughan, W. J., Russell, C. S. and Rodriguez, D. J. (1999). Willingness to pay: Referendum contingent valuation and uncertain project benefits. Sustainable Development Department Technical Papers Series. Inter-American Development Bank, Washington, DC, USA.
Wang, H. and He, J. (2010). The Value of a Statistical Life: A Contingent Investigation in China. Policy Research Working Paper 5421. The World Bank, Washington DC, USA.
World Bank (2025) Search results for “use value” (Research). The World Bank, Washington, DC, USA. https://www.worldbank.org/en/search?q=use%20value&Type=Research (last accessed 29 September 2025).
Authors’ biographies

Shivani Seepersad is an Advisor to the International Organisation of Marine Aids to Navigation and a PhD candidate in the Department of Geomatics Engineering and Land Management at the University of the West Indies, Trinidad and Tobago. Her doctoral research, titled An Economic Evaluation of Risks due to Maritime Navigation across the Greater Caribbean Region, focuses on maritime safety and risk assessment. She has previously served as a GIS intern at York University, contributing to flood risk modelling for the Greater Toronto Area, and as a GIS technician at Land Information New Zealand on the Niue Hydrographic Risk Assessment. Shivani holds a BSc in Geomatics Engineering (Honours) and an MSc in Geoinformatics (Distinction).

Dexter Davis is Lecturer in the field of surveying, adjustments and geodetic surveying and is also Coordinator of the B.Sc. Geomatics Engineering Programme in the Department of Geomatics Engineering & Land Management, Faculty of Engineering, The University of the West Indies. He is a member of the Institute of Surveyors of Trinidad and Tobago as well as the ASPRS. His research areas include engineering surveying, digital photogrammetry and digital mapping, GNSS, geodesy and geodetic applications and hydrographic surveying. Some of his recent work includes sea level monitoring, low cost and disaster relief mapping and 3d point cloud applications for engineering and digital twins.