


In support of ocean and coastal mapping strategies, the United States has designed a method for assessing gaps in bathymetry through a visualization of sounding density. This method was first reported at the Canadian Hydrographic and National Surveyors’ Conference in Victoria, British Columbia, March 2018 (Westington et al., 2018).
This analysis evaluates openly accessible bathymetric data holdings at the International Hydrographic Organization’s Data Centre for Digital Bathymetry, which is hosted by the National Oceanic and Atmospheric Administration (NOAA) National Centers for Environmental Information (NCEI). All modern depth soundings from 1960 to present are incorporated into 100-m resolution local grids covering U.S. waters, which extend from land to the exclusive economic zone and potential juridical continental shelf.
To accommodate different definitions of “mapped,” the sounding densities are reclassified into two categories: 1 to 2 soundings per cell, which corresponds to “minimally mapped” and 3 or more soundings per cell, which corresponds to “better mapped” and is often associated with modern survey instruments that produce more measurements over a particular area. Unmapped areas have no soundings per cell and are blank.
The resulting grids are published as a geospatial web service using Esri ArcGIS Enterprise software. Figure 1 shows the NOAA GeoPlatform web page with official links to the visualization product,
http://noaa.maps.arcgis.com/home/item.html? id=4d7d925fc96d47d9ace970dd5040df0a.
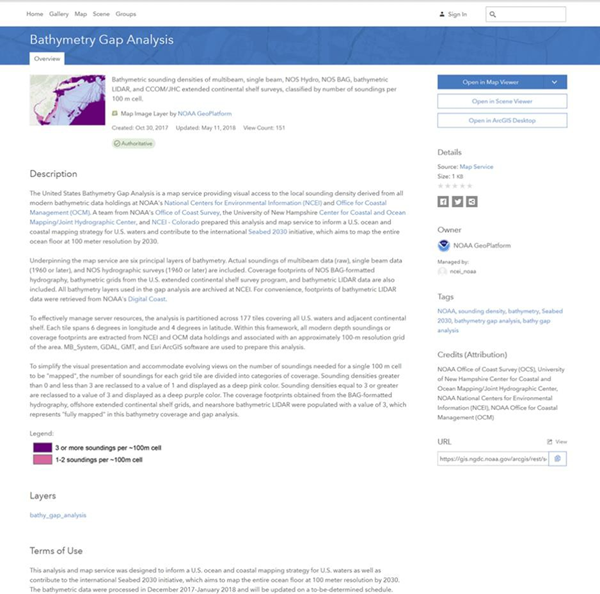
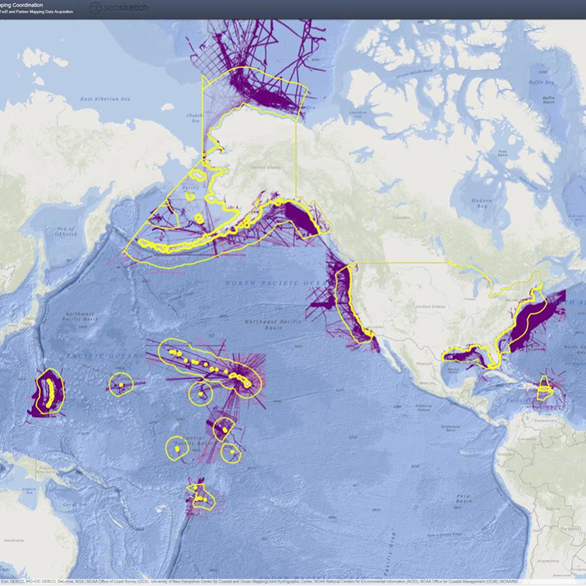
This gap analysis provides a first look at how many individual depth measurements contribute to the overall picture of “mapped.” One may argue that a single measurement in a 100-m grid cell (the pink areas show in Figure 1) is not adequate to constitute “mapped.” However, when considering that less than 10% of the global seafloor has been mapped, others may equally argue that one sounding is better than no sounding at all. The product is intended to start a conversation about what it means for an area to be “mapped” and support actions to fill the gaps. To facilitate this dialogue, the service is also available on the U.S. Federal Mapping Coordination website (www.fedmap.seasketch.org). The website is shown on Figure 2.
Instructions for how to use this visualization to identify gaps in bathymetry will be available in a new chapter of the IHO-IOC GEBCO Cook Book (2016; http://www.gebco.net) in the upcoming update.
References
International Hydrographic Organization, Intergovernmental Oceanographic Commission (IHO- IOC), (2016). The IHO-IOC GEBCO Cook Book, IHO Publication B-11, Monaco, Dec. 2016, 475 pp – IOC Manuals and Guides 63, France, Dec. 2016, 475 pp.
Westington, M., Varner, J., Johnson, P., Sutherland, M., Armstrong, A., & Jencks, J., (2018). “Assessing Sounding Density for a Seabed 2030 Initiative,” in proceedings of the 2018 Joint Canadian Hydrographic and National Surveyors’ Conference, Victoria, British Columbia, 26-29 March 2018, https://www.eiseverywhere.com/ehome/chc-nsc2018/711593/.