


Abstract
1. Introduction
User-Centered Design (UCD) can be described as the approach followed for the creation of a new object in which end users influence how the design process takes shape (McLoone et al., 2010). Regarding web interfaces design, Nielsen (1992; 1994) developed a usability engineering model based on eleven design stages, including the competitive analysis method on the third stage. A competitive analysis critically compares existing products supporting similar use cases to determine how the proposed product should look to fill unmet needs. If several products are available, an analysis of the different design approaches can provide ideas for a new design, and guidelines for good or bad approaches. Therefore, during a competitive analysis, designers and developers evaluate the interface themselves using theoretical frameworks (Roth, Ross, and MacEachren, 2015).
The analysis was completed during the early stages of the UCD methodology of the OceanWeb Mapping Application, a web mapping application to deliver ocean mapping data to ocean modellers. Previous stages included an informal interview with an ocean modeller, which allowed the identification of potential data and functionality to include within this analysis. The competitive analysis method was chosen next because it would depict the state of the art regarding ocean web mapping applications, and it would help to discover trends and gaps within these applications, opening new opportunities for development.
The theoretical framework used by this analysis is based on the one described by Roth et al. (2015) and follows Roth’s (2013a) distinction within cartography: (1) representation and (2) interaction, adding additional topics which consider the needs of ocean modellers, extracted from the previous informal interview. The methodology and results are followed by a summary of design recommendations that will be used to prepare an online survey for ocean modellers as the next stage of the UCD methodology of the Ocean Web-Mapping application. Combining the previous informal interview, the competitive study and the next online survey, a requirements document will be prepared to support the development of the Ocean Web-Mapping Application prototype. An application developed using this kind of UCD approach makes the data available to the community considering its context of use, and it will bridge the gap between ocean modellers and ocean data, providing them with the data and functionalities they need.
2. Methodology
A competitive analysis study of twenty-four existing ocean web mapping applications was conducted. The requirements for the inclusion in the analysis were:
- The application is a web-map based application, and
- The application provides potentially useful data for the ocean community, such as bathymetry, temperature, salinity, weather data or other information.
The applications evaluated are shown in Table 1, including name, a brief description of the application, and the link to the web portal. For the rest of this article, numbers shown are referenced to the first column (#) of Table 1.
Bathymetry and ocean mapping data collection are usually part of government or research organizations, as every country needs to map their territory and marine jurisdiction for political and environmental purposes. The government usually offers this data to the public, either freely (NOAA, 2013), or by limited licensing agreements (e.g. Canadian Hydrographic Service).
In the United States, ten applications were developed, supported or funded by U.S. Federal agencies [1, 2, 3, 5, 6, 7, 8, 20, 24], one by an alliance of U.S. State agencies [5], a university research project [6], an alliance between several organizations and non-profit agencies [2], and two of them are owned by private companies or industries [4, 9]. In Europe, there are four applications developed by national institutions [10, 11, 12, 14] and one common for the European Commission [13]. Within Canada, several applications were included in the analysis: the government of Canada web portal for data products and surveys [16], a federal and provincial government organization application [22], one application owned by a private company [21], a project from the University of Victoria [23], and two research projects from the University of New Brunswick [18, 19]. The government of Australia also provides a web portal for bathymetry and backscatter data [17]. Finally, one of the tools analyzed [15] is an alliance between EU, Canada and US for Atlantic Ocean Research Cooperation.
Regarding geographic coverage, seven applications have a coverage of the entire globe [1, 2, 3, 4, 7, 9, 21]; seven by a single country [8, 9, 12, 15, 16, 20, 23]; three by several US states [5, 6, 24]; three are regional [18, 19, 22]; and five include several countries and jurisdictions [10, 11, 13, 14, 17].
The methodology to perform the competitive analysis followed Roth’s (2013a) distinction within cartography: Representation, i.e. the way the information in the map is encoded, and Interaction, i.e. the ways a user can manipulate the map. The topics covered were based on those analyzed by Roth (2015) but included several additional topics that considered the potential needs of the ocean modelling community.
Related to representation, a total of four topics were analyzed:
- data offered/represented (see 3.1),
- inclusion of uncertainty as a variable of the information (see 3.2),
- inclusion of time as a variable of the information (see 3.3), and
- variation in the basemap provided (see 3.4).
Related to interaction, a total of four topics were analyzed:
- variation across supported interaction operators that will include data download functionalities and analysis tools (see 3.5);
- supported formats, distinguishing between:
- a.bathymetry formats (see 3.6);
- b.other kinds of data formats (see 3.7); and
- variation in the web mapping technology used to implement the web application and mobile support (see 3.8).
| # | Name | Description |
| 1 | NOAA Bathymetry Data Viewer | Bathymetry downloading service by the U.S. National Oceanic & Atmospheric Administration (NOAA). It includes multibeam and single beam data, Bathymetric Attributed Grid (BAG) surfaces, Digital Elevation Models (DEM), etc. Multibeam and single beam data are available for the entire globe. BAG surfaces/Lidar and DEM mostly limited to the U.S. |
| 2 | IEDA Data Browser / GMRT MAP TOOL | Allows downloading bathymetry grid files of any part of the world using the Global Multi-Resolution Topography (GMRT) dataset. |
| 3 | International Hydrographic Organization Data Centre for Digital Bathymetry Viewer | Web-application to download digital bathymetry products. Bathymetry data is available for the entire globe. BAG surfaces/Lidar mostly limited to the U.S. |
| 4 | Bathymetrics Data Portal | Simple web-mapping application that allows purchasing bathymetry datasets (2m or 90m resolution). |
| 5 | MID-ATLANTIC OCEAN DATA PORTAL | Data portal including different ocean datasets that allows building ocean stories using storytelling techniques. |
| 6 | Pacific Islands Ocean Observing System Voyager | An interactive map interface for visualizing and downloading oceanographic observations, forecasts, and other ocean related data. |
| 7 | NOAA Grid Extract | Simple NOAA downloading service for the global bathymetry models. |
| 8 | Data Access Viewer | NOAA downloading portal for elevation, imagery and land cover. It includes coastal bathymetry lidar. |
| 9 | Planet OS | Data hub from different providers. Access to weather, climate and environmental datasets. |
| 10 | CCLME ECO-GIS Viewer | Dynamic Geographic Information Systems (GIS) analytic tool aimed to create meaningful data products of the ocean. |
| 11 | Mareano | Data portal for bathymetry, sediment composition, biodiversity, habitats, biotopes and other kinds of biological and ocean data for the Norwegian offshore areas. |
| 12 | INFOMAR Data Viewer | The INtegrated Mapping FOr the Sustainable Development of Ireland’s MARine Resource integrates mapping products of the physical, chemical and biological features of the seabed. |
| 13 | EMODnet portal for Bathymetry | Web-application from the European Marine Observation and Data Network (EMODnet). It allows downloading bathymetry products for the European Union region. Gaps with no data coverage are completed by integrating the General Bathymetric Chart of the Oceans (GEBCO) digital Bathymetry. |
| 14 | Baltic Sea Bathymetry Database | The Baltic Sea Bathymetry Database (BSBD) distribute bathymetry data for the areas of all Baltic Sea countries. |
| 15 | North Atlantic Data Viewer | Bathymetry from different sources: NOAA, EMODNet, Natural Resources Canada (NRCan) and Mareano |
| 16 | Data products and surveys | Bathymetry data products from the government of Canada. |
| 17 | Bathymetry and Backscatter Data Access | Different resolution bathymetry and backscatter data for the Australian area. Maintained by Geoscience Australia. |
| 18 | Lower Saint John River Data Overview | Web portal for the bathymetric surveys performed by the OMG at the UNB. It also includes Conductivity, Temperature and Depth (CTD) data. |
| 19 | ArticNet Amundsen Multibeam Data | Bathymetry and Backscatter data web application that includes the multibeam data collected for the ArticNet Amundsen project. |
| 20 | Tide data viewer | NOAA tidal and currents sensors viewer. |
| 21 | Ocean Viewer | Data hub that links to the different providers for real time ocean and weather variables. Data is retrieved as animated grids. Note: web site is not operational. The following link is given in case it is resumed: http://oceanviewer.org/atlanticcanada/water-temperature/global-rtofs/test554 |
| 22 | Marine Conditions | The application displays a wide range of recent and near real-time data collected by various monitoring systems installed in a vast territory from the Great Lakes to the St. Lawrence Gulf. They recently included data for the Canadian west coast. |
| 23 | Ocean Networks Canada | The organization operates ocean observatories around Canada, collecting data on physical, chemical, biological, and geological aspects of the ocean to support the scientific and research community. |
| 24 | SECOORA | South East Coastal Ocean Observing Regional Association. Real-time sensors data visualization and downloading for the U.S. South Coast. |
Table 1. Web mapping applications included in the Competitive Analysis
3. Results
Analyzing the set of existing applications, there exist several patterns worth mentioning. First, some applications are only focused on bathymetry data, while others include bathymetry as well as other ocean data observations. In the first group, most of the applications are intended for data distribution and download; some for free [1, 2, 3, 7, 9, 15, 18, 19], free under request [1, 3, 15] or by purchase [1, 3, 4, 8, 9, 15, 16]. Bathymetry focused applications usually limit their functionality to show only what data is available for a given organization, providing a link for download and serving as data repositories. Planet OS [9] is a special case of a website, being a Datahub linking to ocean, weather and climate data from the main government organizations and companies. In contrast to the first group, other applications support data exploration, enabling more user interaction through querying, filtering and basic analysis or calculations, such as depth profiles, measuring tools [10, 13, 14, 17], area statistics [6], or even storytelling techniques to support marine planning [5].
3.1. Data included
The web applications were analyzed to determine if they include the different data types expected to be useful for an ocean modeller (Table 2). This information was provided from the previous informal interview and identified bathymetry, CTD profiles, weather, tidal, coastlines, water level, river discharge and currents as important data.
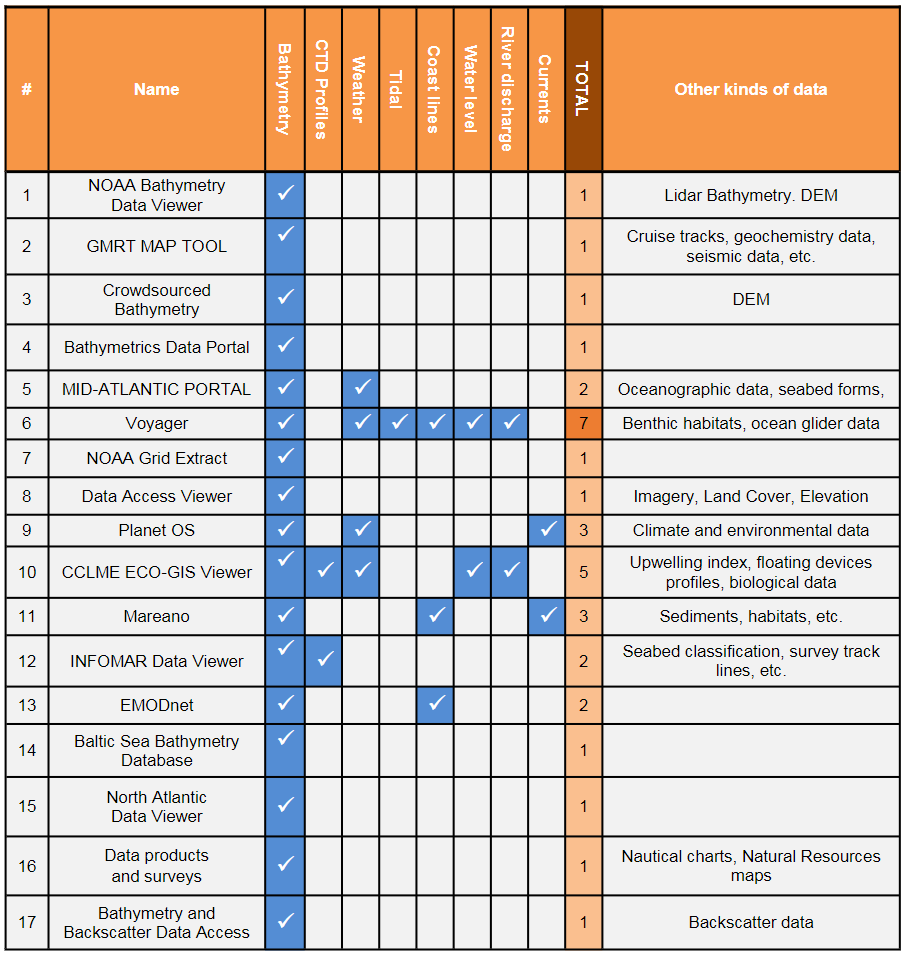
There are nineteen applications that provide bathymetry (n=19), nine applications that provides weather data (n=9), seven that provide current data (n=7), five that provide water level data (n=5), four that provide CTD data (n=4), and three that provide tidal, coastlines or river discharge data (n=3). The results from the analysis subdivide the web pages into three main categories:
- bathymetry data portals (n=14), which exclusively deliver bathymetry data and they do not include additional data [1, 2, 3, 4, 7, 8, 12, 13, 14, 15, 16, 17, 18, 19];
- sensors and observations data portals (n=5), as the opposite of bathymetry data portals, they deliver all kinds of data but bathymetry, only focusing on observations (either real time or historical) [20, 21, 22, 23, 24];
- data portals that combine both bathymetry and other kinds of data (n=5) [5, 6, 9, 10, 11].
CCLME ECO-GIS Viewer [10] and Pacific Islands Ocean Observing System Voyager [6] are the web portals which offer almost all the different datasets, being the most complete. However, none of the applications provide all the data expected to be useful by an ocean modeller. In particular, CTD profile data, although the main product of ocean mapping surveys is not usually delivered, with only four web portals offering it [10, 12, 18, 23]. Furthermore, river discharge, tidal data and coastlines are useful data for ocean modellers; however, only three web applications deliver this kind of data, and not usually in combination with bathymetry products.
3.2 Inclusion of Uncertainty
Uncertainty is a measure that describes any mismatch between reality and the user’s understanding of reality (Roth, 2009). It can appear at any part of the process of converting the reality into knowledge:
- reality,
- variable-definition,
- data-collection,
- information-assembly,
- knowledge-construction (Longley et al. 2005).
Information uncertainty in Geomatics is described using (at least) three components (MacEachren et al., 2012):
- accuracy/error, or the correctness of a measurement or estimate,
- precision/resolution, or the exactness of a measurement or estimate, and
- trustworthiness, or the confidence that the user has in the information.
The results from the analysis show that uncertainty is not represented on the map as a cartographic variable in any of the web applications. Moreover, weather data and other observations are not accompanied by the uncertainty of the measurement. As an exceptional case, INFOMAR Data Viewer [12] includes data quality as one of the attributes for the Moving Vessel Profiler (MVP) surveys. However, this information is limited to good/fair/unknown/DNP, without any explanation about the meaning of these values.
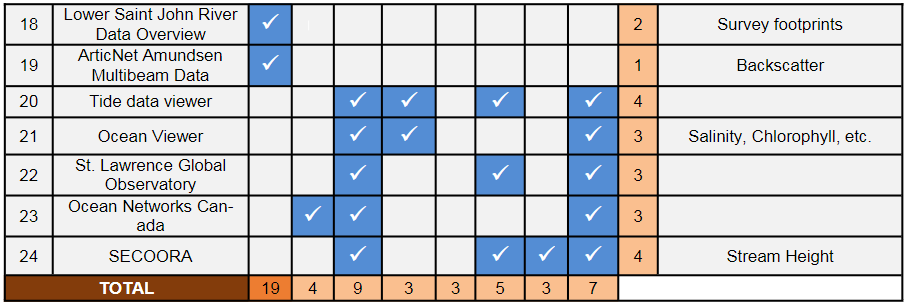
Some of the bathymetric tools however do include uncertainty information related to two themes:
- bathymetry uncertainty (the uncertainty associated to the depth measurement) and
- bathymetry resolution (the pixel size in the real world of the grid).
Table 3 provides an overview of the inclusion of these two kinds of uncertainty across the web applications. Bathymetry uncertainty is included in four tools [1, 3, 15, 18], but only as a component of the BAG bathymetry format (not represented on the map). Bathymetry resolution is included in six tools [4, 6, 8, 12, 14, 17]. There are different resolution options depending on the area in four applications [4, 6, 12, 14], usually due to different surveys that were performed at different scales. In the Baltic Sea Bathymetry Database [14], the resolution is limited to high/low, with no numerical values; and INFOMAR Data Viewer [12] provides a tool to resample every 2nd or 10th cell but does not provide numerical values of the actual resolution. In the other two tools [8, 17], information about the resolution is only included as metadata (name of the layer), and no different options are given. Blue squares in Table 3 indicate that the tool considers uncertainty data.
3.3. Inclusion of Time
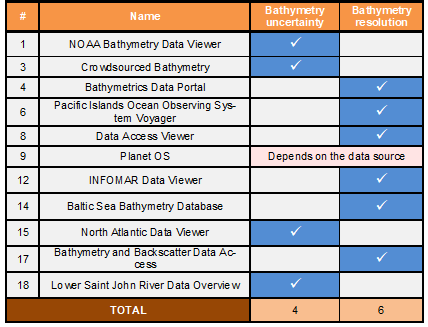
Table 4 summarizes the inclusion of time across the web mapping applications. The results show that time is not represented or usually considered in bathymetric focused applications. The only way to know the date and time a survey was performed is by querying the layer or searching through the metadata. Both UNB tools [19, 20] include the year of the survey as the name of the layer; therefore, a user would be able to select the bathymetry depending on the year. NOAA applications provide a time search (by year) for the surveys.
As opposed to bathymetry tools, time is considered in all the web applications that contain sensor observations, either as a search tool that applies a filter or as a time slider that allows the user to change the date/time of the visible measurements. Ocean viewer [21] includes a sophisticated animation tool that allows the user to visualize on the map the different gridded data provided as a time series.
Other interesting inclusions of time in ocean web mapping applications include the ones related to ocean gliders and CTD data. Pacific Islands Ocean Observing System Voyager [6] provides an animation tool for visualizing the movement of ocean gliders; however, it does not provide a search or query tool to retrieve data based on date or time (the only filter is by vessel). CCLME ECO-GIS Viewer [10] provides a spatiotemporal data viewer that allows the user to find CTD data for a specific month or year. Blue squares in Table 4 indicate that the tool includes time as a variable.
3.4. Basemap context information
Web mapping applications are usually organized into basemaps and overlays. Basemap layers are usually rasterized, serving as a set of tiles to provide context information to the user, who will retrieve information about overlay layers. Table 5 provides an overview of the most important basemap options available across the web mapping applications. Some of the applications offer other kinds of basemaps not included in Table 5. Blue squares in Table 5 indicate the kind of basemap that is included in the application. A darker blue shaded square, indicate the default basemap when the application is loaded.
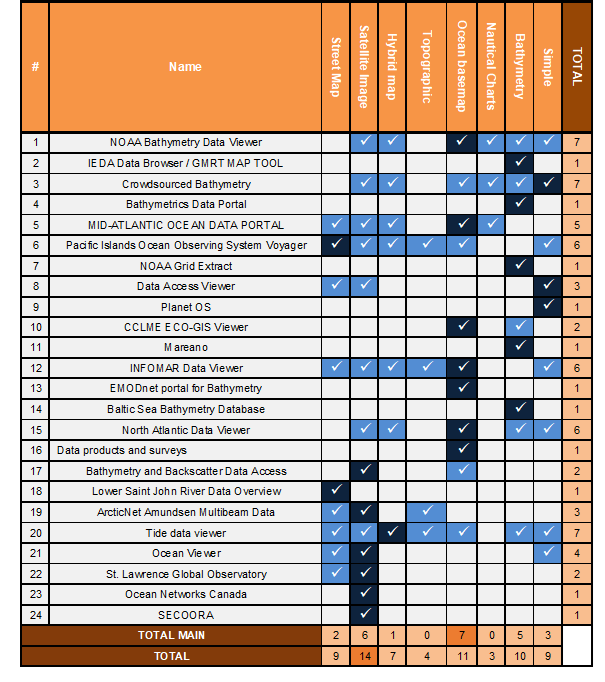
The analysis identified eight different basemap types: satellite image (n=14), simple basemap (as a grey/black/white map) (n=13), ocean basemap (ocean basemap from Esri) (n=11), global bathymetry (as any layer portraying the global bathymetry of the oceans) (n=10), street map (n=9), hybrid map (n=7), topographic/terrain (n=4) and nautical charts (n=3). None of the applications provides all the basemaps options, and there are many tools that only provide one basemap (n=10). This fact might be explained because they only support downloading operations and the user interaction is limited (and not necessary). There are a large number of tools providing simple basemaps (n=9), and it is the starting basemap in three tools (n=3). This could show a tendency of ocean web mapping applications to be simplistic, either because the main purpose is just downloading data or because of design purposes.
Also, there is a trend for some of the web mapping applications to simply use the basemap tool from Esri, which provides a set of standard basemaps options. This might be the reason why the number of web applications that provides street maps as a basemap is high (n=9). A street map might be viewed as of little use for ocean web mapping applications. On the other hand, a nautical chart basemap might seem like one of the best regarding ocean web mapping applications; however, there are only three tools which provide it (n=3). This information is usually owned by government organizations and not openly available to the public. Therefore, it may be hard to access.
As an exceptional case, Pacific Islands Ocean Observing System Voyager [6] provides more than 20 additional different options for basemaps, apart from the one mentioned on Table 5. The provision of more number of basemap options might seem useful as it could support a wider range of user tasks, allowing the map to be personalized (Roth, 2015). However, a huge number of options might overwhelm the user and be unnecessary for the purpose of the map.
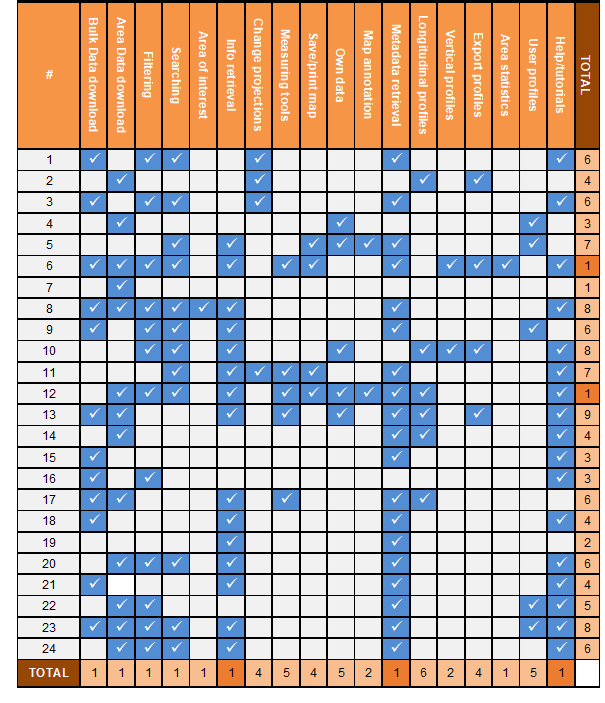
3.5. Supported interaction functionalities
Interaction functionalities describe any functionality which allows the user to interact with the map or the application (Roth 2012; Roth 2013b). Table 6 provides an overview of the supported interaction functionalities across the web mapping applications. The most commonly implemented functionality is metadata retrieval (n=19). This allows users to retrieve metadata of a set of data, either as a link or as information shown in the same map view. The second most implemented functionality is requesting help or tutorials about the tools (n=17). The applications provide a page or help button explaining how the application must be used. The third most common functionality implemented was information retrieval (n=15), or the ability to request specific details about a feature on the map, which is a common functionality in web mapping applications.
Data download, which is one of the main purposes in ocean web mapping applications, was subdivided into two functionalities: bulk download (n=12), downloading whole datasets; and data download by area (n=13), allowing the user to draw an area on the map to download only a specific set of data. Most of the applications include one or both options [6, 8, 13, 17, 23]; and there are only four applications [5, 10, 11, 19] which do not provide any options.
The filter and the search functionality are implemented in twelve applications (n=12), and somewhat related to each other. Filtering is the ability to adjust the map to only show map features that match one or more userdefined conditions. Searching is the ability to identify map features of interest. Most of the applications provide a search tool that applies a filter on the map when a specific kind of feature is selected. Blue squares in Table 6 indicate that the functionality is implemented in the application.
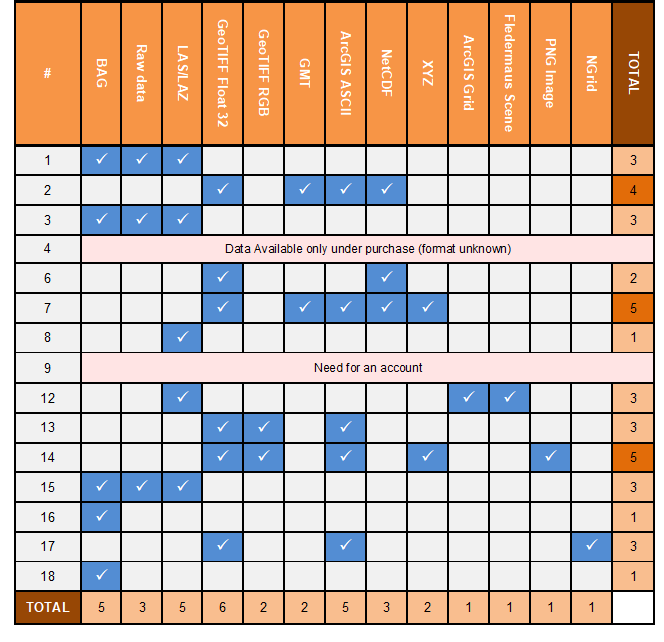
3.6. Bathymetry Supported formats
Table 7 provides the results from the analysis of bathymetry supported formats. The most supported formats are GeoTIFF (n=6) and BAG, LAS/LAZ and ArcGIS ASCII formats (n=5). Most of the tools make available more than one format for downloading bathymetry data. There are only three applications [8, 16, 18] which only provide one format. Blue squares in Table 7 indicate that the application provides that data format.
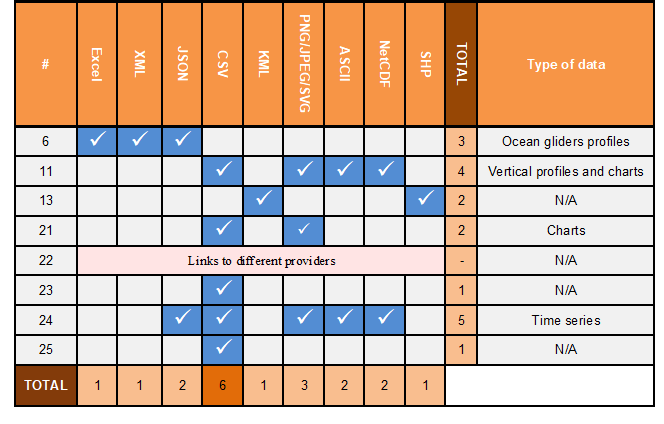
3.7. Other Data Supported formats
Table 8 lists other kinds of data supported by the web applications include alphanumerical data (time series observations or profiles) and vector data. The most common format for delivering this kind of data is CSV format, a simple standardized format to provide tabular data (numbers and text) in plain text. Blue squares in Table 8 indicate that the application provides that kind of format.
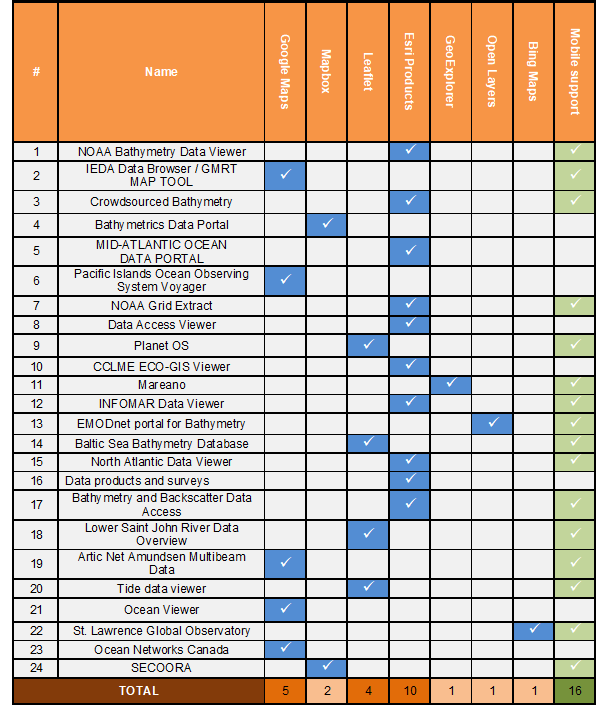
3.8. Web Mapping Technologies and Mobile Support
Web mapping technologies support the implementation of maps and specific functionalities in web mapping applications. Table 9 provides an overview of the clientside web mapping technologies used to implement the set of web mapping applications analyzed. Esri products take the lead on web mapping technologies used to develop ocean web mapping applications (n=10), followed by Google Maps (n=5) and leaflet (n=4).
The widespread use of Esri products might be explained as it provides a wide range of services (for example, ArcGIS Server, ArcGIS Online, and ArcGIS API for JavaScript) to develop and support web mapping applications. Bathymetry datasets are usually large and need a powerful server development which is already built into the ArcGIS suite. However, ArcGIS is commercial software and is not open source, which means high pricing for licensing, storage and development, and less possibilities for plugins and personalization. For this reason, many of the applications have the same look, as they are developed using basic Esri templates. Google Maps is also widely used; however, it shares the same problem as Esri Products, plus does not provide builtin web map servers. Regarding open source web mapping technologies, leaflet is the most used technology, followed by Mapbox. The rest of the web mapping technologies (Open Layers, GeoExplorer) have decreased in popularity during recent years, and their APIs are not wellmaintained, resulting in maps which are inferior in appearance.
Concerning mobile support, sixteen of the twentyfour applications provide support for mobile devices, adapting the interface for smaller screens and maintaining all the functionalities available.
A blue square in Table 9 indicates that the application is built using that technology. A green square indicates mobile support.
4. Conclusions
This paper presents a competitive analysis study of current Ocean Web Mapping Applications that deliver Ocean related data to the scientific community. A total of twentyfour existing applications were critically analyzed and compared, across the following topics:
- data offered/represented,
- inclusion of uncertainty as a variable of the information, inclusion of time as a variable of the information, and
- variation in the basemap provided;
- variation across supported interaction operators; supported formats, distinguishing between (2b) bathymetry and
- other kinds of data; and
- variation in the web mapping technology used to implement the web application and mobile support.
The study shows that ocean web mapping applications could be classified in three main categories: those focused mainly on bathymetry data, those focused on ocean data observations (sensor data) and those which combine both. Due to the particularity of the ocean modelling field and the ocean science community in general, an ocean web mapping application should include both, combining data distribution and download with more data exploration and visualization tools to know what data is available.
None of the applications provide all of the data expected to be useful by an ocean modeller, and CTD profiles data, river discharge, tidal data and coastlines are not usually delivered or combined with bathymetry products. An application particularly designed for ocean modellers should include all the data necessary to develop an ocean model, gathering heterogeneous data from different sources in the same application.
Concerning the inclusion of uncertainty in ocean web mapping applications, uncertainty is not represented on the map as a cartographic variable, and it is an unusual value to include along with an observation or measurement. As an important part of any measurement, and being a crucial point for decision making, more attention should be given to the inclusion of uncertainty in ocean web mapping applications.
Regarding bathymetry resolution, the ideal scenario for an ocean modeller would be to provide different resolutions under request (i.e. even if the survey was performed in another resolution, resampling the data per user request). Also, the inclusion of time in ocean web mapping applications is unusual, especially the applications focused on bathymetry. The only way to know the date and time a survey was performed is by querying the layer or searching through the metadata. Special attention should be given to time, as it is important to know when a survey was performed to be able to compare between years and select the most convenient data. Regarding contextual information, there is a wide range of basemaps included in the applications analyzed. Many of the tools use the Esri predefined set of basemaps, and nautical charts are not a common basemap to include while streets maps are common (although being potentially useless regarding ocean mapping applications). It should be studied what would be the context information required by the user to provide them with the most appropriate basemap, instead of providing all the options. Moreover, there are alternatives to Esri basemaps that could better enrich an ocean web mapping application (i.e. bathymetry and nautical charts).
In considering functionalities, the results from the analysis reveal several opportunities for improvement. Several functionalities are under-represented in existing applications: Area of interest (n=1), area statistics (n=1), map annotation (n=2), and vertical profiles (n=2). These functionalities are more analytical and task specific, rather than general purpose functionalities, such as data download. The ideal scenario would be to combine all these tools to improve analytical workflow and support ocean modelling tasks.
The study also identifies what formats are used by ocean web mapping applications. However, these formats may not align with the formats used by other scientific fields (like ocean modelling). Therefore, further analysis and considerations should be taken to decide what formats to deliver depending on what users require.
Considering web mapping technologies, the results align with those found by Roth, Donohue, and Wallace (2014), indicating a broad transition in web mapping technologies from proprietary plugins to modern web standards, and an increase in popularity of open source solutions. Open source options are free to use and include several possibilities for plugins and personalization. However, proprietary solutions are known as having better performance. Depending on the requirements of the application, further analysis is necessary to determine whether an open source solution meets the performance, storage or computing requirements. If these requirements are not a high priority, open source solutions provide an easier way to produce visually appealing web maps of comparable functionality to those of Esri or Google Maps and can result in a more satisfying development experience given the openness and extensibility of the code repository. Moreover, most of the current applications already provide mobile support, being a common trend in ocean web mapping applications. Whether or not to include this support depends on whether the application is intended to be used in a mobile device or is only intended for desktop use.
Overall, this analysis served as the second stage of the UCD methodology of the Ocean WebMapping Application of the OMG at UNB and helped to establish trends and gaps concerning ocean web mapping applications and to discover new opportunities for ocean web mapping development. The insights generated from the analysis will be combined with the previous informal interview to prepare an online survey to be conducted by ocean modellers. This method allows user input from the target user group and organizations and serves to generate a requirements document to support the development of the first application prototype. After the first prototype, an evaluation of the tool will be performed to close the UCD cycle and to continue the improvement of the Ocean Web-Mapping Application.
5. References
- Longley, P.A., Goodchild, M.F., Maguire, D.J., Rhind, D.W. (2005). Geographic Information Systems and Science. Wiley, West Sussex, England.
- MacEachren A.M., Roth R.E., O’Brien J., Li B., Swingley D., Gahegan M. (2012). “Visual semiotics & uncertainty visualization: An empirical study”. IEEE Transactions on Visualization and Computer Graphics, 18 (12), pp. 2496-2505.
- McLoone, H. E., Jacobson, M., Hegg, C., and Johnson, P. W. (2010). “User-centered design and evaluation of a next generation fixed-split ergonomic keyboard”. Work, 37(4), pp. 445–456.
- Nielsen, J. (1992). “The Usability Engineering Life Cycle”. Computer, 25(3), pp. 12–22.
- Nielsen, J. (1994). Usability engineering. Elsevier.
- NOAA, (2013). NOAA Plan for Increasing Public Access to Research Results, The NOAA Research Council, ad hoc Public Access to Research Results Committee, viewed 30 July 2018, https://repository.library.noaa.gov/view/noaa/10169
- Roth, R. E. (2009). “A qualitative approach to understanding the role of geographic information uncertainty during decision making”. Cartography and Geographic Information Science, 36 (4), pp. 315-330.
- Roth, R.E. (2012). “Cartographic interaction primitives: Framework and synthesis”. The
- Cartographic Journal, 49 (4), pp. 376-395.
- Roth, R. E. (2013a). “Interactive maps: What we know and what we need to know”. The Journal of Spatial Information Science, 6, pp. 59-115.
- Roth, R.E. (2013b). “An empirically-derived taxonomy of interaction primitives for Interactive Cartography and Geovisualization”. Transactions on Visualization & Computer Graphics, 19 (12), pp. 2356-2365.
- Roth, R. E., Donohue, R. G., and Wallace, T. R. (2014). “A Process for Keeping Pace with Evolving Web Mapping Technologies”. Cartographic Perspectives, 78, pp. 25-52.
- Roth, R. E., Ross, K. S., and MacEachren, A. M. (2015). “User-Centered Design for Interactive Maps: A Case Study in Crime Analysis”. ISPRS International Journal of Geo-Information, pp. 262–301.
6. Authors Biographies
Marta Padilla Ruiz is a Research Assistant in the Department of Geodesy and Geomatics Engineering at the University of New Brunswick, where she is a member of the Ocean Mapping Group. She obtained her MScEng in Geodesy and Geomatics Engineering at UNB in 2018, and she developed an Ocean Web Mapping application for ocean modellers as her MScEng thesis. Prior to coming to Canada, she completed a bachelor’s degree in Geomatics Engineering at the University of Jaen, and a MScEng in Topography and Geodesic Engineering at the Polytechnic University of Madrid. Her research interests are focused on User-Centered Design and development of Geomatics applications, understanding user needs and including their feedback in the design process.
Dr. Ian Church is an Assistant Professor in the Department of Geodesy and Geomatics Engineering at the University of New Brunswick, where he leads the Ocean Mapping Group. Prior to starting at UNB in 2016, he was an Assistant Professor with the Hydrographic Science Research Center at the University of Southern Mississippi. His current research interests include hydrodynamic numerical ocean modelling, marine habitat mapping, acoustic water column interpretation, and processing crowdsourced bathymetry data.
Emmanuel Stefanakis is a professor and the head of Geomatics Engineering department at the University of Calgary. His academic career spans for twenty years and it includes multiple academic institutions in Canada and Europe as well as various programs in Engineering and Science. He has been involved in multiple research projects mostly funded by the European Union, Canadian Agencies, and the Greek Government. He has supervised a significant number of students and researchers of various disciplines, while his teaching portfolio includes various programs in Engineering and Science, and a variety of teaching modes (classroom-based, online & distance-learning). He has an active involvement with the Canadian Board of Examiners for Professional Surveyors (CBEPS), the Canadian Institute of Geomatics (CIG), and the International Society for Photogrammetry and Remote Sensing (ISPRS). Since January 2014 he has been the Editor-in-Chief of Cartographica Journal.