
Abstract
1. Introduction
Hydrography – from the International Hydrographic Organization (IHO) S-32 Hydrographic Dictionary (IHO, 2019a) – is defined as follows: “Hydrography is the branch of applied sciences which deals with the measurement and description of the physical features of oceans, seas, coastal areas, lakes and rivers, as well as with the prediction of their change over time, for the primary purpose of safety of navigation and in support of all other marine activities, including economic development, security and defense, scientific research, and environmental protection”.
From this definition, it is clear that there are several opportunities for hydrographic offices (HOs) to grow without diminishing their fundamental responsibility for safety of navigation. All those areas of influence mentioned in the definition, arranged and organized together (but not mixed), where time and space are fundamental, constitute what we can call a hydrospatial information system (HIS), the “water” version of what would be a geospatial information system on land. It is a system of systems in which a nautical information system, a bathymetric information system, and an oceanographic information system (and any other type of required system) coexist and complement each other, acting as multiple and integrated systems of record and enabling a system of engagement with a large community to collaborate, analyze, and understand the hydrospatial environment and make evidence-based decisions.
This paper addresses how a hydrographic office, or HO (a generic term to refer to the authoritative agency of a country in charge of hydrographic data and related activities), similarly to its counterpart mapping agency on land, can evolve into a (geospatial) hydrospatial agency by organizing and exploiting its data assets in many different ways, taking advantage of multidimensional analysis technology by creating a hydrospatial information system. In doing so, this paper is divided into three main areas of influence in which the use of hydrographic data is fundamental for HOs success:
– The marine environment, complementing the ocean sciences, to understand the physical, chemical, and biological properties of our ocean and its relationship with the rest of the planet
– The blue economy, contributing to the sustainable development of countries and regions through safe, secure, and efficient maritime activities such as e‑navigation, offshore energy, port construction and operations, and aquaculture
– Safety and security, defining sovereign rights of nations to protect their waters and activities taking place within, enabling armed forces and law enforcement agencies to plan and deploy their forces with the appropriate information for contingency management, search and rescue, environmental protection, and naval operations.
For that, we will discuss some examples of how hydrographic data organized in an HIS (Figure 1) contributes to activities within the three main areas mentioned above and their impact – in other words, how hydrographic data helps in understanding the marine environment, supports operations such as shipping and law enforcement, and contributes to determine maritime limits and boundaries that are subject to different jurisdictional rights.

2. A Hydrospatial Information System and the Marine Environment
Realizing information from underwater acoustic signals
Perhaps the most important data asset that a hydrographic office possesses is bathymetry. This capricious measurement takes a lot of effort and dedication to collect – in the old days, with mechanical methods such as rods and lead lines, and later, indirectly with sound, laser, and imagery. At the end of the day, the final result is a number in a location at a time. In the beginning, there were a few of those numbers; today, there can be billions. But regardless of how many, the main purpose of these numbers was to populate a navigational chart product. Collecting bathymetry for chart production can thus be considered the traditional use of this data. These same sound signals (echoes) are also used for seafloor characterization of sub-bottom sediment layers, looking into the acoustic interaction with the seafloor sediment and the changes produced to the echo signal coming back to the sonar.
Sonars used as sediment profilers, also called sub-bottom profilers (SBP), look into the first layers of sediment below the seafloor, normally several tens of meters. Using very high-level and low frequencies (1 to 10 KHz) through frequency-modulated and compression techniques, hydrographers came to have a better penetration into the seafloor and thus greater understanding of the nuances of the sonar signal. The echo comes from reflection, not from the backscatter, on the boundaries between layers, which correspond to changes in impedance contrast. The echoes gathered by the system are “piled up” graphically, reconstituting a vertical cross-section of sediment layers. Using echo amplitude processing techniques and calibrated SBPs, it is possible to retrieve the reflection coefficients and absorption coefficients associated with sediment layers crossed by the signal and then use them to classify these layers and identify sub-bottom areas of interest (AOI).
2.1 When noise became information
With better understanding and postprocessing of underwater acoustics and the advancement of computer systems and software packages, analyzing this data became easier and faster. And what once was considered noise is now used to determine important information such as the seabed type from which these measurements were taken; that noise is known as backscatter, or dispersion, from the incident acoustic wave hitting a target now acting as a source back to the sensor. The backscatter field will depend on the roughness or incident angle to the surface; close to the normal to the surface it will reflect a maximum backscatter energy. At oblique incidences, the backscattered wave comes from sources distributed as a function of surface roughness. The physical process and how it is interpreted and modeled will vary significantly with the frequencies used. At high frequencies, there is little penetration of the surface; at low frequencies, the model must include the signal interaction with the sediment layer, which lets hydrographers realize the composition of sub-bottom layers.
As technology progresses, hydrographers now analyze a more challenging signal – the volume backscattering – that is to be defined as the sum of the backscattering contributions from each target contained in a specific volume of water. This volumetric measurement contains valuable information of the AOI between the sea surface and seafloor, from which biomass and physical phenomena and gas bubbles can be measured. Water column mapping is (or can be) now part of a hydrospatial information system, extending the usability of acoustic signals collected to ecological habitats, natural resource identification, and other oceanographic areas of study.
Now, just from properly collecting and analyzing the acoustic signals generated by echo sounder systems, the HIS can start to be built with sounding measurements (bathymetry), sub-bottom profiles, sediment classification, and water column information.
2.2 More than acoustic signals
Bathymetric data acquisition and its postprocessing has traditionally been obtained from underwater acoustic signals and through different techniques, as explained above, to produce bathymetric products that are exploited in different ways.
But there are other important sources of bathymetric data, such as marine Lidar (Light detection and ranging) and satellite-derived bathymetry (SDB), that complement and can be integrated into the acoustic ones in a seamless bathymetric information system as part of the HIS. Although constrained by the physical characteristics of the water and atmospheric conditions, these other sources are collected at a much faster pace than sonar systems and in quantities not seen before, making the volume of bathymetric data several orders of magnitude bigger than what it used to be. Bathymetric lidar and SDB allow its use for coastal zone applications at the “speed of trust” (when coming from authoritative sources through the HIS).
2.3 Evolving from chart production to location Intelligence
In the late 1990s and early 2000s, the challenge was to build central database systems from which paper/raster and Electronic Navigational Charts (ENC) could be created simultaneously. Some HOs have reached that level; others are in the process of doing it. In general, nearly all HOs, just like their land office equivalents, understand the advantages of having a central database approach for production, and the technology to build an enterprise production system is readily available. Of course, we acknowledge the challenge of migrating to a new S‑101 (IHO, 2018b) production system; but that is moving in slow motion compared to the marine world needs of today, and automation will support a smooth transition when it happens. Now that we are approaching the third decade of the 21st century, the challenge is to evolve that existing chart production system into a location intelligence system, from which production continues to transform through automation and expands the use of hydrographic and oceanographic data in response to new demands from the marine world. This expansion requires building a spatial data infrastructure (technology, standards, governance, and organizations) to address those new demands – in this case, a Marine Spatial Data Infrastructure (MSDI) – as the framework to develop an HIS and distribute new products and services and to keep existing ones available to a much larger user group. It is also increasingly requiring results as fast as possible given the bandwidth of information transfer. Where this once required hand carrying paper surveys from the ship, now it is throttled by the satellite throughput; though that is rapidly improving through market innovation driven by such applications as video transfer – per ocean exploration requirements for collaboration in real time – hence the speed of trust built by bringing the experts to the ship virtually rather than waiting for the next voyage or year.
2.4 Nautical charts: From artisanal to artificial intelligence production
There is no question that nautical (or navigational) charts are extremely important products in maritime traffic. They can be compared to highway maps at sea, allowing ships to safely go from one place to another and enabling commerce and economic growth. Centuries ago, these products were made by hand by cartographers that were great artists too. Later, in the last quarter of the 20th century, computers became a common tool used in making these charts more standardized. Although the process was no longer completely manual, it was still very labor intensive. Even in the first few years of the 21st century, making a paper chart product was still a very human-driven process, with hundreds of clicks involved and the potential for human error to overcome the quality assurance processes of the HO. That’s not the case anymore; software technology now allows the use of automated processes that reduce the manual work to a minimum, even to zero if the organization’s workflows and policies allow the standardization of output. Now, with the impending use of artificial intelligence (AI) and deep learning, even those decisions that a human used to make for producing charts will be done by an AI that focuses on standardizing production output. Machine learning will enable new production systems to make decisions based on approved best practices for presentation of information such as labels and text positioning, masking of features, sounding selection, and establishment of surrounding elements. All the source data necessary to make nautical charts will be arranged in a nautical information system, another component of an HIS, and delivered in a timely fashion to meet the needs of tomorrow’s robotic- assisted navigators.
And this is just for production. Machine learning connected to location data (the geospatial component) will improve processes and predictive modeling and help organizations gain business advantages that would allow them to grow and evolve to the next level. Through location intelligence – the use of spatial information and analytics to reveal patterns and trends – an organization can observe the environment, predict the future state, and then plan and execute its modification by understanding the problems that lie ahead. Cartographers will evolve to become hydrospatial analysts.
2.5 Oceanography, the sister science of hydrography
We can say that oceanography is indispensable for hydrography to be successful. Physical oceanography parameters (such as pressure, temperature, and density) combined with chemical parameters (such as salinity) are used for determining sound velocity profiles, and together with tidal data, help in determining bathymetric measurements; these datasets collected by HOs are very important for other studies. There are biological factors in spreading the sound as well and understanding the variability with tide and wind action often leads to more questions than answers. These are fundamental to what we might now call ocean weather (Hughes Clarke, 2017), and they contribute to the creation of an oceanographic information system (OIS). This OIS is also part of the HIS and the next step of a hydrographic office toward achieving a digital transformation. This oceanographic information is part of the location intelligence used in the HIS to identify, understand, and predict the occurrence of phenomena.
2.6 A hydrospatial information system role in multidimensional marine data analysis
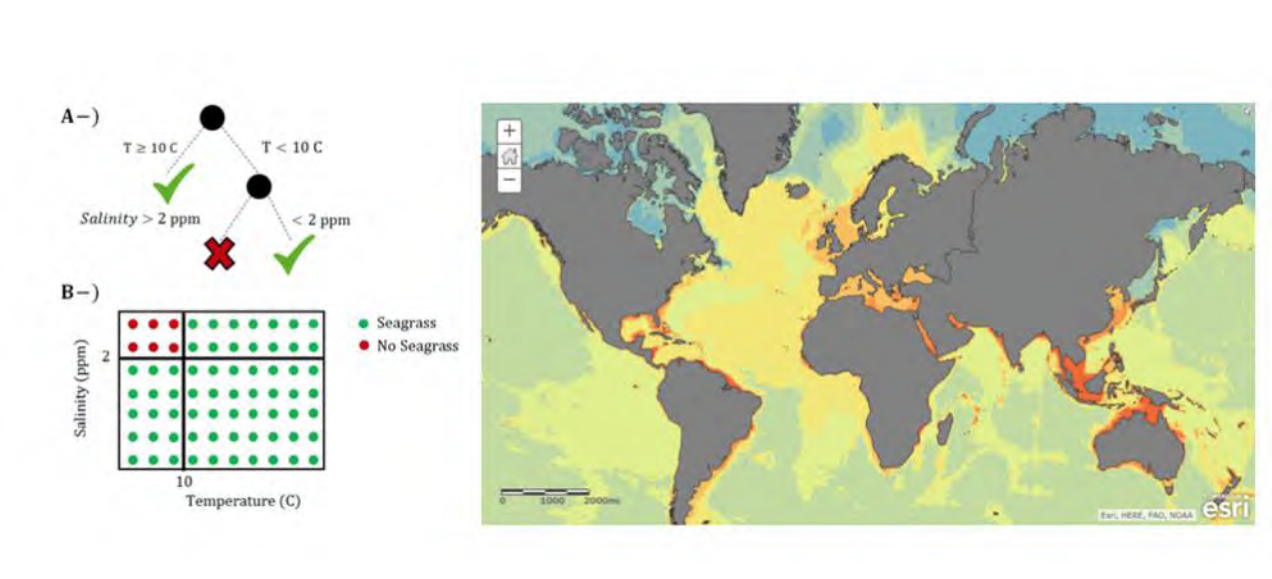
Bathymetry, sediment types, tides, currents, water mass physical characteristics, and more can be used for marine data analysis. Here, hydrographic offices, through an HIS, play an important role. Evidence of that relevance can be found in a recent study that shows how the rising of ocean temperatures is affecting sea grass, which together with mangroves and salt marshes, stores up to 100 times more carbon than tropical forests at 12 times the speed (Aydin, 2017). In identifying these environmental conditions, sea surface and water column temperatures, along with depth measurements and their trends – combined with other oceanographic parameters – are very important (Figure 2)
The use of bathymetry is fundamental to determining depth zonation for classifying different types of ecosystems. Marine mapping by use of echo sounding technology detects not only the seabed morphology but also the presence of fauna and other materials in the water column, as mentioned before (volume backscattering). Based on the deep scattering layer (DSL) and higher – density sound-scattering layer (SSL), scientists can detect animals moving vertically at different times of the day for feeding and protection. These acoustic signals help in defining the epipelagic and mesopelagic depth zones that can be correlated to climate change phenomena and, with the use of GIS models and algorithms in an MSDI, can predict biomass accumulation due to temperature-driven metabolism, growth, and trophic efficiency in the food chain (Costello and Breyer, 2017).
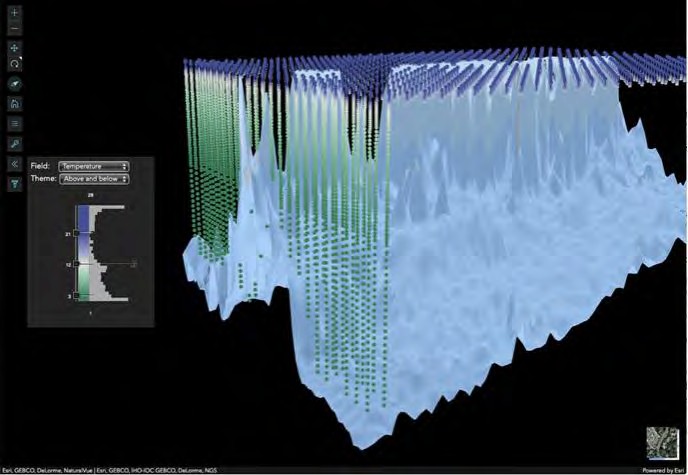
In classifying different pelagic regions, depth for stratifying the ocean is the first required parameter, which becomes really valuable and more difficult to assess accurately as we go deeper and farther away from the coast. Then, temperature and salinity (parameters that, depending on the instrument type, sometimes are collected during hydrographic surveys) are necessary. A statistically based classification of seabed habitats can be influenced by data contained in an HIS, such as bathymetry, slope, sediment thickness, and geomorphology. Surface primary production, bottom temperature, and oxygen complement the HIS data to identify different seascape types and then define a Marine Protected Area (MPA) network that can be used for analyzing environmental variability in the water column and for comparing the surface and the seabed. This analysis allows scientists to classify blocks of ocean water mass as Ecological Marine Units (EMU) (Esri, 2019c) and identify pelagic zones around the world. EMUs provide a 3D framework up to a depth of 5,500 meters to stratify ocean sampling (Costello et al., 2018) where bathymetry is the literal geospatial foundation on which to plot everything else (Figure 3).
These EMUs can be built at any area coverage level, from the worldwide network through the public-private partnership led by the US Geological Survey (USGS) and Esri, using the National Oceanic and Atmospheric Administration’s (NOAA’s) oceanographic data and commissioned by the Group on Earth Observations (GEO), to regional and local networks that can be built through an MSDI. Combined with the fundamental contribution from an HIS of HOs in partnership with other agencies, these organizations support the wise use of the ocean for development and environmental resilience. For example, in improving the regional ocean observation within the Marine Biodiversity Observation Network (MBON) (Esri, 2018), determining seascapes, a work funded under a National Aeronautics and Space Administration (NASA) Research Opportunities in Earth and Space Science (ROSES-16) A.50 GEO Work Programme exists. The proposed work will evaluate dynamic seascapes on a global scale with a case study focused in the Arctic. These include comparisons of boundaries of surface seascapes to surface EMUs, particularly on seasonal scales, and comparisons of species distributions across classification schemes. This joint effort will also facilitate the delineation of a useful MBON framework from pole to pole (Wright et al., 2018).
All these examples highlight the relevance that a hydrospatial information system, as a component of an MSDI, has in multidimensional marine data analysis and in the creation of new products and services that can be used for a wide variety of applications involving the monitoring and evolution of our planet, from micro to macro levels and from environmental protection to economic and social development.
3. A Hydrospatial Information System and the Blue Economy
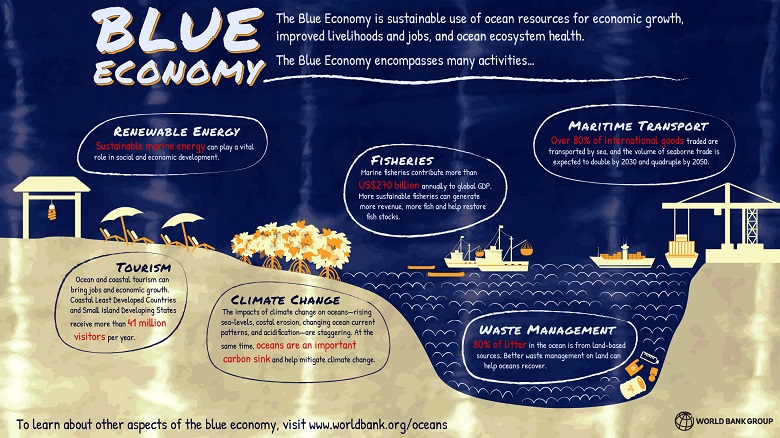
Many things have been written about this subject in the past few years. The World Bank defines the blue economy (World Bank, 2019) as the “sustainable use of ocean resources for economic growth, improved livelihoods, and jobs while preserving the health of ocean ecosystem.”
Basically, the concept suggests better stewardship of ocean resources while allowing sustainable development, and curbing the exploitation of marine and maritime resources – such as offshore energy, shipping, commercial fishing, and mining – to preserve ocean health and maintain the productivity of those resources.
Following are some important blue economy facts (The Commonwealth, 2019):
– The total global ocean economy is valued at around US$1.5 trillion per year.
– Eighty percent of global trade by volume is carried by sea.
– Fisheries provide 350 million jobs worldwide.
– By 2025, it is estimated that 34 percent of crude oil production will come from offshore drilling.
– Aquaculture provides 50 percent of fish for human consumption and is the fastest-growing food sector.
3.1 Shipping industry
Shipping is a fundamental activity that contributes to the blue economy. However, to make it safe, efficient, and sustainable, several measures have to be taken, from greenhouse gas (GHG) emissions control to the International Convention for the Prevention of Pollution from Ships (MARPOL) discharge regulations and from the International Maritime Organization (IMO) Safety of Life at Sea (SOLAS) to e-navigation and port operations.
The shipping industry and naval forces are the main customers of HOs, consuming ENCs and paper and raster charts as main products; here there is no question about the contribution of hydrography to the blue economy. Up-to-date charts distributed in a timely manner would reduce the risk of accidents at sea and improve efficiency with better navigational routes. These products are also used ashore, where monitoring ship traffic and port operations is important not only for safety and efficiency but also for regulating shipping emissions by including AIS data (location and speed) in a GIS, with parameters such as engine power and fuel consumption rates to estimate emissions in time and space. This has been an important application in the Green Ports movement. An HIS would provide the necessary resources to efficiently plan for navigation routes, ship speeds, bilge water management, and port services.
3.2 IMO E-navigation and IHO S-100
The International Maritime Organization e-navigation initiative is a way to systematically ensure “safe berth-to-berth navigation,” with the additional benefits of improving efficiency when approaching and leaving a port. The letter e does not necessarily mean electronic; it could also mean enhanced, or if someone takes some liberty with the IMO definition, it could also mean enterprise or efficient or effective. The goal is to address and provide key solutions to five main challenges:
– An improved bridge design, harmonized and user-friendly
– Standardized and automated reporting to authorities of ship system status
– Integrated presentation of information in graphic displays received through communication equipment
– Improved reliability, resiliency, and integrity of bridge equipment and navigation information
– Improved communication of VTS Service Portfolio
It is important to note that IMO expects to complete its required list of tasks for the above areas in 2019 so that industry can use this information and start designing e‑navigation products and services. These products and services can be created and provided through an HIS and should be made available through the Maritime Services Portfolio (MSP) as in IMO, 2019, defined as “a set of operational and/or technical services” that could be added for specific purposes.
To enable these MSPs, it is necessary to create a Common Maritime Data Structure (CMDS) that could be considered a subset of an MSDI, through which those products and services can be provided to both the ship and the port state authority as well as the individual port administration ashore. Services such as Under Keel Clearance Management (UKCM) through accurate and up- to-date information on bathymetry, water levels, salinity, and currents, with ENCs as their reference frame, would be key hydrographic products out of an HIS for this type of service.
While many of these new products and services are required to be provided in the form of MSPs, some will need to be IHO S-100 (IHO, 2018a) compliant; the new Universal Hydrographic Data Model will enable several of these products to evolve dynamically with technology and be GIS compliant for analysis and decision-making. For example, ENC in S-101 (IHO, 2018b), bathymetry in S-102 (IHO, 2019c), tides in S-104 (IHO, 2017), and currents in S-111 (IHO, 2018c) are all combined to provide the proper information for the UKCM in the S-129 (IHO, 2019b) MSP. The UKCM package will be used in shipboard systems for e-navigation and ashore for harbor master planning and operations.
The IHO working groups have already defined several MSPs that directly relate to HOs’ products and services. These can include (but are not limited to) MSP 5 maritime safety information service, MSP 6 pilotage service, MSP 12 nautical chart service, MSP 13 nautical publications service, and MSP 16 real-time hydrographic and environmental information services. All these MSPs can be derived from a hydrospatial information system and augmented with other GIS information.
In essence, this has been the core business of HOs; the main difference now is that, with geospatial information technology and new standards, it is possible to extend their capabilities and provide more products and services much faster and of better quality than before. These new products and services are not only static but dynamic, too, ready to be consumed by GIS systems. GIS leverages artificial intelligence, complex algorithms, and deep learning to significantly improve the way e-navigation was originally conceived. Geospatial intelligence provides the analysis to the maritime community for better decision-making and preparation for more automation in the future.
Special attention has to be given to maritime autonomous surface ships (MASS), which are a new type of customer for HOs. These ships are considered independent of human interaction, capable of making decisions and determining actions by themselves. So far, IMO’s regulations, COLREGs, SOLAS, and STCW only consider manned ships, so it has a challenge ahead. However, the IMO Maritime Safety Committee (MSC) has endorsed a framework for a regulatory scope that includes definitions for MASS and degrees of autonomy, so we can see that some steps are already being taken to prepare for the future. Underwriters are noticing this new type of vessel, and the insurance company Gard has insured the autonomous container ship, Yara Birkeland, from the company Yara International of Norway. HOs also have a challenge to meet the requirements of this new kind of user – one that could acquire and update its navigational information at the speed of light – meaning that HOs would need to provide and update their products faster than before; and for this, an HIS would be a key technological resource. An even bigger challenge, currently trapped in discussions of human-reviewed crowdsource bathymetry, is the process by which the navigation information that these ships will need to create and share, like autonomous vehicles are developing on highways.
3.3 Ports
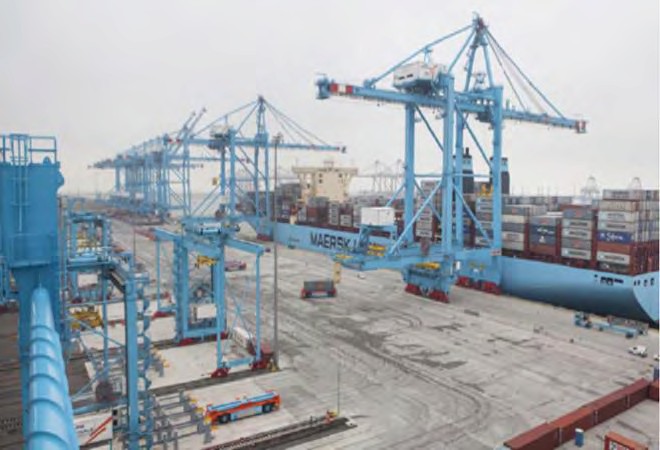
The shipping industry is a large ecosystem that includes multiple participants that impact ports, and they also will need to adapt to the new opportunities being brought by technology. While shippers focus on the supply chain efficiencies, reducing friction of transport from production to delivery through several modalities, ports must compete through optimized decision-making about their asset usage for improved services. Several ports around the world are taking action and have started their complete spatially enabled digitalization, creating their “digital twins,” thus taking advantage of geospatial intelligence and automating processes and services. The Port of Rotterdam is a prime example of this transformation, where it has created the concept of PortMaps, bringing together the companies working in the port and providing reliable information about their interconnected activities (PortMaps, 2014). APM Terminals (Figure 4) has even developed a port terminal at Rotterdam where no human being needs to be physically present – where 80 percent of the cranes are automated and the rest are remotely operated (APM, 2019).
As the world’s forward-looking ports are becoming greener, safer, and more efficient through automation – taking advantage of GIS technology and AI – they are not only growing physically but also digitally and becoming more competitive, receiving larger ships and servicing them faster. Through a geospatial technology and strategy, the necessary products and services are provided, several of them coming from HOs and the ports’ own hydrographic departments. Whether large or small, from a national HO or a port’s hydrographic department, an HIS at the proper scale will provide these products and services more effectively and efficiently.
3.4 UN Sustainable Development Goals
At a global scale, nothing is more relevant than the United Nations (UN) Sustainable Development Goals (SDGs), an ambitious call for action to help countries achieve 17 social and economic development objectives by the year 2030. In doing this, location information plays a very important role; and for the maritime community, this is particularly true in achieving SDG‑14, Life below Water. Hydrographic information (bathymetry) is the foundation in the “Elevation and Depth” theme. Comprehensive and authoritative bathymetric data complemented by geological and soils datasets from the seabed in an HIS are an essential feature to be provided by national HOs. The nautical chart is fundamental for the “Transport Networks” theme, providing marine and inland waterways that impact SDGs 2 (Zero Hunger), 3 (Good Health and Well-Being), 8 (Decent Work and Economic Growth), 9 (Industry, Innovation and Infrastructure), and 11 (Sustainable Cities and Communities) (UN, 2019a). While an HIS can provide new products and services to support SDG-14, traditional products such as nautical charts have a very significant (and sometimes overlooked) impact on several other Sustainable Development Goals.
An important effort is being made by the UN Statistics Division in maintaining an open SDG Data Hub, where there are over one million observations. An SDG indicators API was created to give programmatic access to the global indicators database using the OpenAPI specification (UN, 2019b) and to thus enable live information services to be provided.
The UN Economic and Social Commission for Asia and the Pacific (ESCAP) has created a gateway to data portals, allowing people to access and download statistical information and filter it by specific SDG (ESCAP, 2019). From here, the Resource Watch, which provides hundreds of datasets on the state of the planet and human well-being, can be found at (ResourceWatch, 2019). Filtering the data by the word oceans will render dozens of layers containing relevant hydrographic, oceanographic, biological, and shipping information, among other types, that users can combine for their own analysis. This is an example of how an HIS can support this important global endeavor.
4. A Hydrospatial Information System and Maritime Safety and Security
4.1 Naval and law enforcement agencies
Like HOs belonging to their national navies have the mission to support naval operations, many civilian HOs also complement their catalogs with S-57 (IHO, 2000) Additional Military Layers (AMLs) and other tactical products. These support a wide variety of missions, from antisubmarine warfare, littoral operations, and surface and mine warfare to law enforcement activities, fisheries regulation, pollution control, and search and rescue, among others. The use of geospatial data in an HIS – historical, near real-time, and real time – in combination with rich nautical content, as a reference framework such as the ENC, supports all these activities. HOs provide not only the finished ENC product but also high-resolution bathymetry, tides, currents, sediment types, and several oceanographic parameters to help in understanding the water mass and its behavior.
An MSDI is the backbone of any environmental emergency management and an HIS its technological axis, from planning for a disaster to the immediate response in the aftermath and the recovery phase. After a hurricane or tsunami affects coastal areas, having clear shipping routes to ports to support those affected areas, as well as delivering essentials for community resilience, is key, and critical in remote areas. Rapid response hydrographic survey teams play a very important role in collecting data and providing information for future recovery phases. This data must be organized and managed efficiently in the HIS to make it accessible for all involved parties. The survey teams are the key resources to assess the damages by providing real-time or near real-time reports via mobile devices along the coast to a central location for planning the recovery phase. An example of the importance of this geospatial information, including hydrographic information, can be seen in the Hurricane Florence event that affected the US states of North and South Carolina in mid-September 2018. A story map summarizes the relevance of not only the immediate aid of water, food, medicines, and temporary shelters that was provided but also of the long-term recovery of people rebuilding their lives, homes, jobs, and businesses (Esri, 2018b).
4.2 Maritime boundaries delimitation
One area that has always been critical for a maritime nation’s development is the realization of its maritime limits and boundaries, which will be defined in the new IHO S-121 (IHO, 2019d) Maritime Limits and Boundaries product specification. Based on the UN Convention on the Law of the Sea (UNCLOS), these maritime limits define what level of jurisdiction and what resources a maritime nation has rights to beyond the shoreline. Part of the responsibility of determining these limits lies with the national HO, which intervenes in delimiting the baselines. These baselines determine the establishment of the territorial sea, contiguous zone, and exclusive economic zone. This information, along with the foot of the continental slope derived from bathymetric analysis, is combined with other criteria to determine the extended continental shelf zone. The proper and accurate justification for claiming these areas to the UN is backed up by hydrographic, oceanographic, geological, and geodetic data and will have a very significant effect on the nation’s economy and well-being.
Nautical charts are the legal documents portraying the above-mentioned maritime boundaries. These lines are used by mariners to know where they are and what legal jurisdiction they are sailing in and thus what activities are allowed within those waters. The law enforcement agencies also use this geospatial information to ensure that the regulations are not violated and for resources surveillance in the water column, seabed, and subsoil.
4.3 Port security
Besides port operations, asset management, and all the logistics aspects, a very important safety consideration is security in ports – not only above water but also below water, where the human eye or electromagnetic-based sensors can’t penetrate from above. The International Ship and Port Facility Security (ISPS) Code is a set of measures that enhance security of ships and ports and was developed as a response to perceived threats to ships and port facilities. This ISPS Code outlines the responsibilities of governments, shipping companies, crews, and port administrations to “detect security threats and take preventive measures against security incidents affecting ships or port facilities used in international trade.” Besides diving operations and underwater video cameras that require manual intervention, there are several ways of providing port security where underwater acoustics play an important role in detecting suspicious objects on the seabed and even on the hull of ships below the waterline. For this, a variety of equipment is being used, mounted on platforms such as remotely operated vehicles (ROVs) and small launches. Different types of echo sounder systems can be used for object detection, and a GIS with AI can aid human analysts to identify artifacts. This is not yet a common area for exploiting hydrographic data for most ports, but it’s becoming a relevant issue for some, and we can anticipate that it will be relevant for many more in the near future.
4.4 Submarine cables
They appeared almost immediately after the invention of the telegraph by the mid-19th century. Today, submarine cables are strategic assets of national and international security. Contrary to what some may think, satellite communications are of very little importance compared to submarine cables. Just in the US, based on statistics from the US Federal Communications Commission, satellites account for just 0.37 percent of all US international capacity. Cables can carry far more data at a far lower cost than satellites. Today’s cables can carry 208 Tbps (terabytes per second, or 208,000 gigabytes per second). According to the International Cable Protection Committee (ICPC) (IPC, 2019), there are approximately 378 submarine cables in service around the world, with 1.2 million kilometers lying on the sea bottom.
With just the above-mentioned numbers in mind, the relevance of location – understanding where these cables are in order to avoid any accidental damage, and the dangers of not knowing exactly where they are in order to avoid any attempt of sabotage – is evident. These considerations are even more important in shallow waters and near ports, shipping traffic, and anchorage areas. Submarine cables must be accurately portrayed in nautical charts so that mariners, dredgers, and any other person with interests on the seabed know if they can safely drop an anchor, dredge sediment, or drill an oil well.
The ICPC engages and coordinates with the International Seabed Authority to ensure that deep sea mining contractors will not damage submarine cables during their operations, and with the IHO to adapt chart specifications for submarine cables, ensuring they are represented clearly.
A submarine cables layer is another very important piece of information that complements a hydrospatial information system, as it can be appreciated in Esri (2019b).
5. Conclusion
A hydrospatial information system organizes hydrographic, oceanographic, and other maritime data to focus on the business value of three main areas: marine environment, the blue economy, and maritime safety and security. A variety of use cases for an HIS and the role HOs can play beyond their traditional safety of navigation responsibility has been illustrated through examples where, in some cases, the multidimensional analysis requirement is evident. These examples also provide a horizon of where hydrographic authorities or their proxies could bring additional value to market and grow in their responsibilities. Making a centralized nautical database and cartographic production system is no longer a difficult technological challenge. Soon there will be the task of migrating from an S-57 to an S-101 production system, and through automation, there is opportunity to make the production processes more efficient and standardized. Yet, of course, the challenge still is to acquire good data and to populate the additional features and attributes of the new standard to feed the system; and there is a need to capture the best practices of the current generation of senior cartographers and adapt them to new information services. The advent of these new, GIS-enabled S-100 products and services, combined with constantly evolving, cutting-edge geospatial technology, allows HOs to build their HIS and grow their capabilities. Soon they, too, will perform multidimensional analysis, providing new products and live services so that others can do the same under the MSDI concept in a multiplying effect.
Recognizing that the demands for hydrographic data are growing and in order for the technology to address those demands are the first steps to go beyond charting. It will require a clear vision to establish the strategy for setting the destination of the hydrographic offices and determining the voyage route to successfully reach the next geospatial frontier.
REFERENCES
- APM (2019), viewed 6 September 2019, https://www.apmterminals.com/en/maasvlakte/about/our-terminal
- Aydin, Orhun. “The Science of Where Seagrasses Grow: ArcGIS and Machine Learning.” ArcGIS Blog, 18 September 2017. https://www.esri.com/arcgis-blog/products/arcgis-enterprise/analytics/the-science-of-where-seagrasses-grow-arcgis-and-machine-learning/?rmedium=redirect&rsource=blogs.esri.com/esri/arcgis/2017/09/18/the-science-of-where-seagrasses-grow-arcgis-and-machine-learning.
- Costello, M. J., and Breyer, S. 2017. “Ocean Depths: The Mesopelagic and Implications for Global Warming.” Current Biology 27, no. 1: R36–R38. http://dx.doi.org/10.1016/j.cub.2016.11.042 or http://esriurl.com/depths.
- Costello, M. J., Basher, Z., Sayre, R., Breyer, S., and Wright, D. J. 2018. “Stratifying ocean sampling globally and with depth to account for environmental variability.” Nature: Scientific Reports 8: 11259, doi: 10.1038/s41598-018-29419-1.
- ESCAP (2019). Viewed 6 September 2019, http://sdghelpdesk.unescap.org/data-portals.
- Esri (2018). “B41L-2897: Use Cases of Ecological Marine Units for Improved Regional Ocean Observation Data Integration within the Marine Biodiversity Observation Network (MBON).” Poster presented at the American Geophysical Union Fall Meeting, Washington, DC, December 2018. https://agu.confex.com/agu/fm18/mediafile/Handout/Paper372053/EMU-MBON-Poster-2018AGU-final-G260140.pdf.
- Esri (2019a). Viewed 6 September 2019, https://arcg.is/OGyy5.
- Esri (2019b). Global Submarine Cables, viewed 6 September 2019, http://arcg.is/uuTif.
- Esri (2019c). “Ecological Marine Units.” Accessed September 6th 2019. https://www.esri.com/en-us/about/science/ecological-marine-units/overview.
- Hughes Clarke, J. E., 2017. “Coherent refraction ‘noise’ in multibeam data due to oceanographic turbulence.” Proceedings of the US Hydrographic Conference, Galveston, TX, 2017, 18pp.
- IHO, 2000. S-57 – Transfer Standard for Digital Hydrographic Data, Edition 3.1 (Novemberv2000).
- IHO, 2017. S-104 Water Level Information for Surface Navigation, draft Edition 0.0.5 (November 2017).
- IHO, 2018a. S-100 – Universal Hydrographic Data Model, Edition 4.0.0 (December 2018).
- IHO, 2018b. S-101 – ENC Product Specification, Edition 1.0.0 (December 2018).
- IHO, 2018c. S-111 – Surface Currents, Edition 1.0.0 (December 2018).
- IHO, 2019a. S-32 – Hydrographic Dictionary (Continuously updated), viewed 31 July 2019, http://hd.iho.int.
- IHO, 2019b. S-129 – Under Keel Clearance Management, Edition 1.0.0 (June 2019).
- IHO, 2019c. S-102 – Bathymetric Surface, Edition 2.0.0 (October 2019).
- IHO, 2019d. S-121 – Maritime Limits and Boundaries, Edition 1.0.0 (October 2019).
- IMO (2019). Viewed 6 September 2019, http://www.imo.org/en/OurWork/Safety/Navigation/Documents/enavigation/SIP.pdf
- IPC (2019). International Cable Protection (IPC), viewed 6 September 2019. www.iscpc.org.
- PortMaps (2014). Viewed 6 September 2019, https://www.youtube.com/watch?v=tNLGZWRkrJs
- ResourceWatch (2019). Viewed 6 September 2019, http://resourcewatch.org.
- The Commonwealth (2019). “Blue economy”, viewed 6 September 2019, http://thecommonwealth.org/blue-economy.
- UN (2019a). UN SDGs, “Global Fundamental Geospatial Data Themes”, Story Map, viewed 6 September 2019, https://arcg.is/q9z8W.
- UN (2019b). UN SDGs, viewed 6 September 2019, http://www.sdg.org.
- World Bank (2019), viewed 6 September 2019 https://www.worldbank.org/content/dam/infographics/780xany/2017/jun/environment-blue-economy-infographic-780.jpg
- Wright, D.J., Kavanaugh, M.T., Henry, L.-A., Brandt, A., Saeedi, H., Bednarsek, N., Van Graafeiland, K., Butler, K.A., Breyer, S., and Sayre, R.G. (2018). Use cases of Ecological Marine Units for improved regional ocean observation data integration within the Marine Biodiversity Observation Network (MBON), Eos, Trans. AGU, 99, Fall Meet. Suppl., PaperB41L-2897, 2018.
AUTHOR BIOGRAPHY
Rafael Ponce graduated from the Mexican Naval Academy, served 25 years in the Mexican Navy, serving in different posts onboard destroyers, oceanic patrol ships and dredging ships, and was CO of the Hydrographic ship ARM Rio Tuxpan. Ponce retired as a Captain. He holds a Master of Science degree from the University of Southern Mississippi and is a category A hydrographer. Mr. Ponce was the deputy director of the Mexican Hydrographic Office, during that time represented Mexico at several IHO committees and working groups and was a candidate to the IHO Director position in 2017. He has worked for Esri since 2007 and is currently the company’s global maritime executive consultant.