


Abstract
1. Introduction
Marine topographic data is an important component in any model (or similar abstraction) being developed for the marine environment. The majority of this information is obtained by ship-borne measurements using single beam echo sounding (SBES) and multibeam echo sounding (MBES) technologies. Due to the improved seafloor coverage, efficiency and precision of MBES, this technology is now widely employed in the surveying of important port and channel routes and for detecting underwater obstructions (LI JB et al., 1999; ZHAO JH et al., 2008). The nominal precision and resolution can be in the order of centimetres for new generation MBES technologies and errors caused by the sounding system, in comparison to other factors, can have little influence on the quality of the sounding data. Therefore, these other factors need to be considered to evaluate the impact on products generated from MBES data collection. These factors include field organization and the standardization of data processing activities including comprehensive product inspection.
An analysis of multibeam sounding data collected in recent years by different survey units indicates that the quality of products are mainly affected by the following factors:
- dynamic environment factors (wind, air pressure, temperature, salinity, density, wave, tide and current);
- diligence of field work practices; and
- data processing.
A number of gross and systematic errors were found to exist in the products and these affect the value of the MBES data collection and the application of the products. In addition, quality problems can be due to system hardware configuration and the improper maintenance of the equipment. These can be difficult to understand but must be given the appropriate attention by the hydrographic system engineers responsible for maintaining the equipment.
Therefore, rigorous quality control and assurance processes must be applied during the data acquisition, data processing and product generation steps to eliminate each type of gross and/or systematic error. Furthermore, the quality control schemes must be described with enough detail and rigor to assure a third party of the data quality. These schemes must address the operation of the equipment to ensure system characteristics and capabilities are comprehensive, have wide applicability and meet the expected level of operation.
1. Analysis of MBES Error Sources
1.1 Gross Errors
A MBES survey operation typically combines a number of systems including a transducer, positioning system, surface sound velocity probe, Position and Orientation System (POS), sound velocity profiler, tide gauge and other auxiliary systems. Abnormal data will inevitably exist in the collected sounding data e.g. position, attitude, sound velocity, tide, depth. These data abnormalities are caused by equipment noise, the complex and dynamic environment and the sonar parameter complexities. During processing operations, if these abnormal data are not correctly identified and dealt with to correct the issue, isolated depth and position abnormalities will exist in the sounding data. This kind of gross error is also named a pseudo signal. Hence, a false picture of the marine topography will be presented by the gross errors and these must be determined and eliminated.
When analyzing MBES data, the common processing methods include artificial translation, trend surface filters, robust estimation and the Combined Uncertainty Bathymetry Estimator (CUBE) algorithm (YANG FL et al., 2004; LI MS et al., 2007; HUANG CH et al., 2010; HUANG XY et al., 2010; HUANG MT et al.,2011). An example of bathymetric data being analyzed and cleaned using the CUBE algorithm method is shown in Figure.1. The gross errors that exist in Figure 1(a) have been eliminated by the application of the CUBE algorithm in Figure 1(b). A more faithful and accurate representation of the marine topography can be depicted after eliminating the errors.
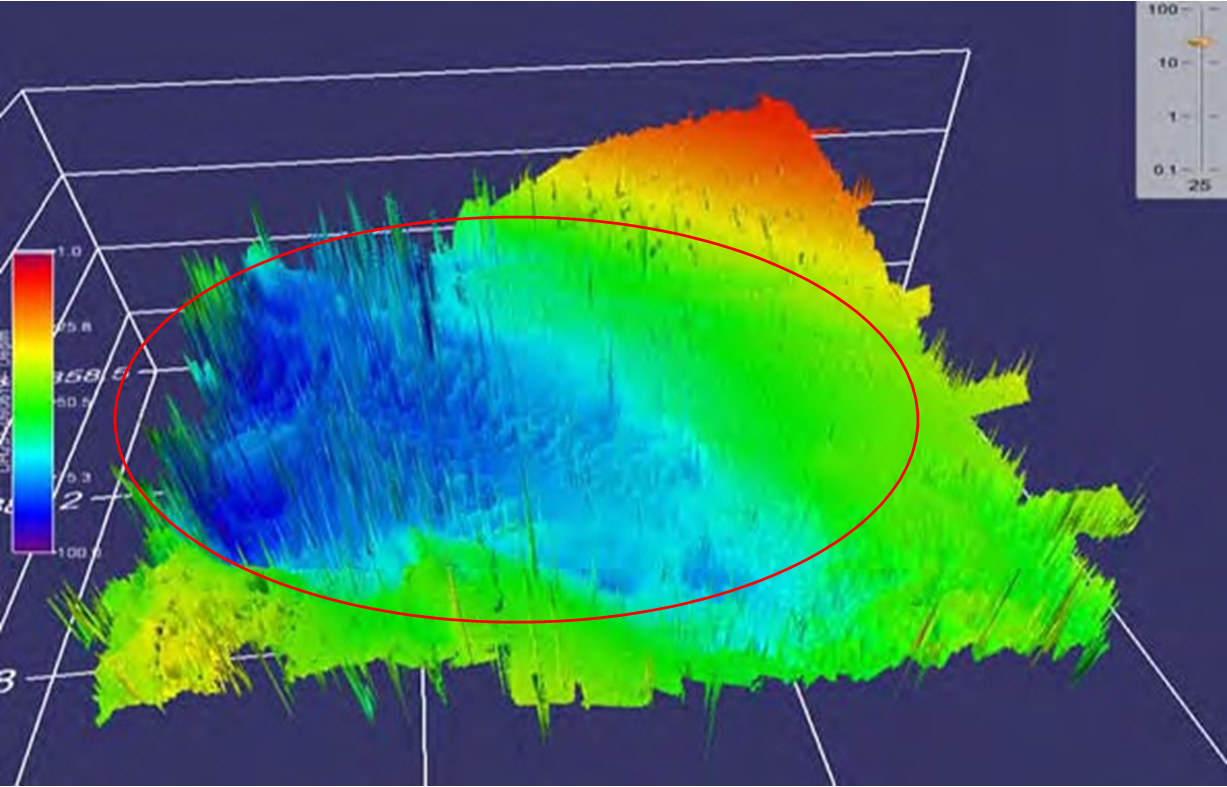
Figure 1(a): Before filtering 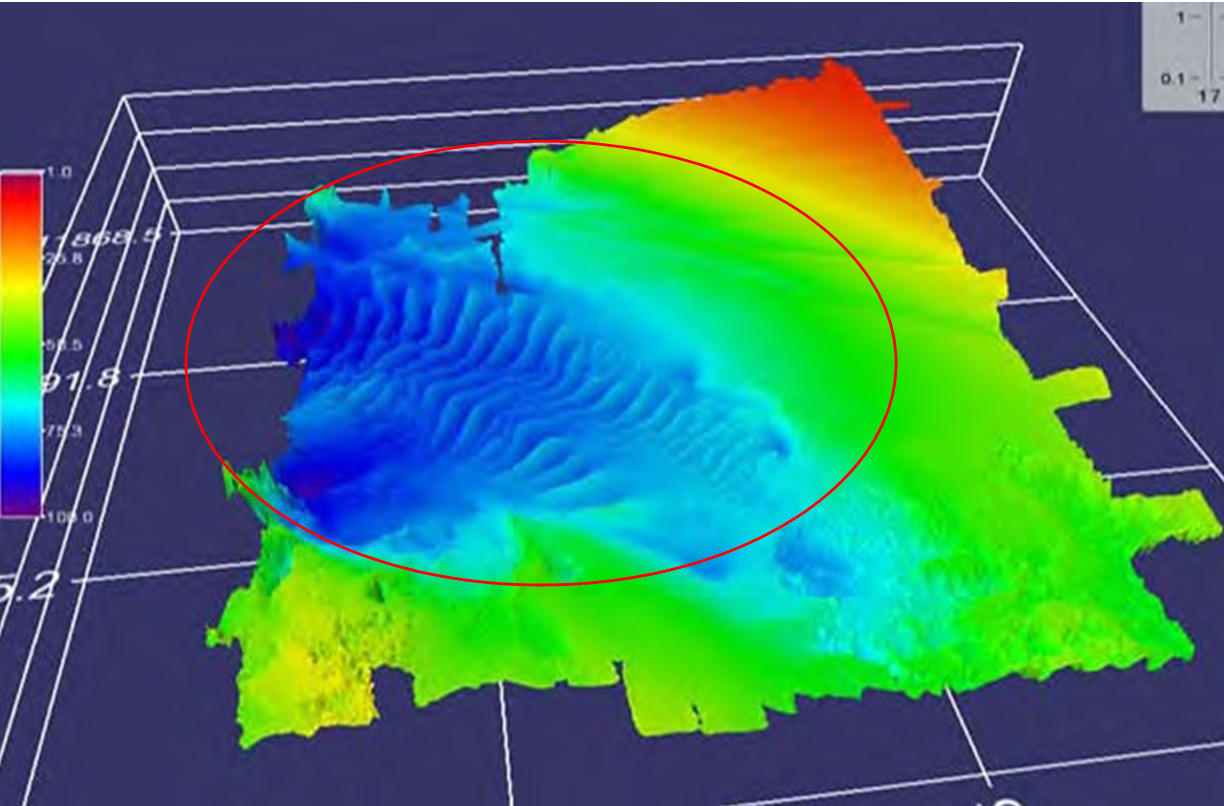
Figure 1(b): After Filtering
Figure 1: A typical gross error and filtering effect – (a) Before Filter (b) After Filter
2.2 Systematic Errors
Based on the MBES equipment configuration, systematic errors can occur in position, attitude, sound velocity, tide and sounding system measurements. Furthermore, these errors affect position and depth data. Systematic errors need to be qualitatively and quantitatively analyzed.
The systematic errors in position data can be detected and calibrated by the fixed deviation in the plane position. This is obtained by the stability test of the positioning system. Furthermore, where the positioning signal is lost by an equipment malfunction and poor environment, the sampling interval of the position information can be considered to be reasonable and accurate by using interpolation and extrapolation measures.
The systematic errors caused by poor calibration of the transducer installation results in the undulation of “V” phenomena of the marine topography. This will be visible along the track showing pitch, roll and heave errors as shown in Figure 2. Although the transducer installation errors can be corrected, systematic errors can also be caused by environment conditions such as wind, wave and current. Meanwhile the systematic errors will result in a slow linear change during the capture process. Hence, these errors must be corrected in post processing.
Systematic errors from an incorrect attitude correction occur for two primary reasons:
- The instability of the transducer installation – the real attitude will not be in accordance with the observed attitude of the POS. There will be a high frequency resonance of the transducer and survey platform, which is also influenced by the environment factors such as wind, wave and current (YANG FL et al., 2009). If this influence can not be reduced, regular undulations will be found in the sounding data.
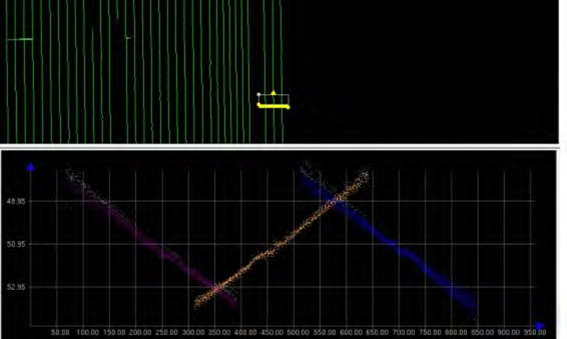
- Due to possible un-synchronized GPS 1PPS signals, inconsistent time lags can exist between the POS and transducer, so the attitude data and sounding data will not be synchronized and a “butterfly” phenomena will be observed in the swath as shown in Figure 3.
The accuracy of the marine topography will also be affected by any inaccuracy in the sound velocity profiler. The “smiling face” or “weeping face” phenomena will be visible, especially for the fringe beams, shown in Figure 4. Research on the influence of the sound velocity error and the sound ray tracing theory indicates these systematic errors can be removed by adjusting the sound ray value step by step. In addition, the surface sound velocity probe must be deployed during the actual time of sounding capture to ensure the accuracy and reliability of the sounding data (LIU SX et al., 2009, 2011; DONG QL et al., 2011).
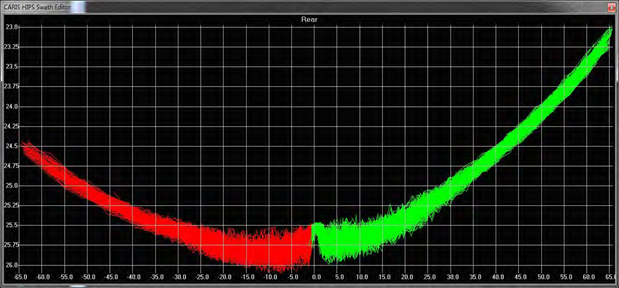
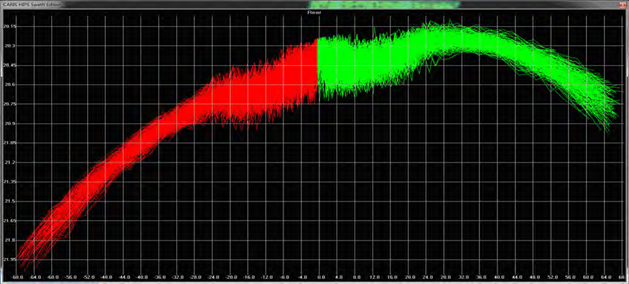
Figure 4: The systematic error of (a) “ smiling face” or (b) “ weeping face” phenomena in a sounding swath due to the inaccuracy in the sound speed profiler.
The effect of systematic errors due to incomplete tide adjustments are shown in Figure 5. These errors can be removed by improving the tide gauge station distribution, use of tidal predictions, non-tide GPS mode and tide calculation based on the residual water level collocation (OUYANG YYZ et al., 2005; BAO JY et al., 2006; LU XP et al., 2008; HUANG CH et al., 2011, 2013).
During multibeam sounding processing, tide corrections, sound velocity corrections and attitude corrections are applied to the sounding swathes. During this process, a “concave- convex” phenomenon can appear. These are more than “smiling” and “weeping” phenome- non and these errors are considered residual systematic errors relating to the instruments. (ZHAO JH et al., 2013).
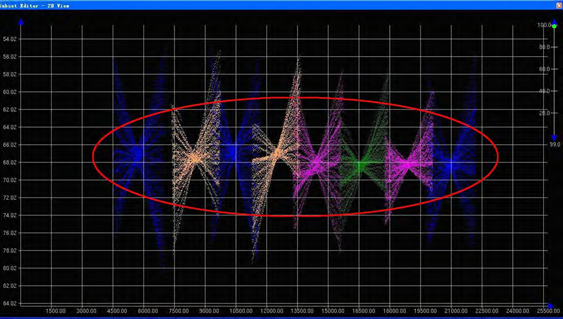
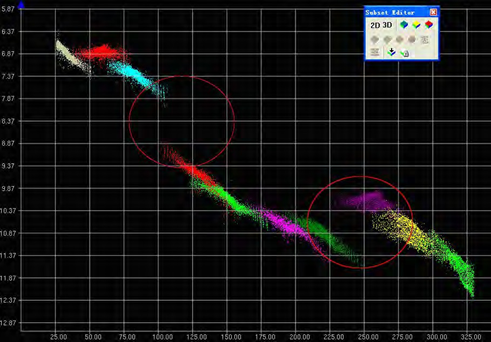
Any malfunction or improper maintenance of the transducer will manifest themselves as other data quality problems. In Figures 6 and 7, a systematic error is observed that illustrates the “W” phenomena and can be found in the center beam of certain swaths. Once identified, such a transducer hardware malfunction must be rectified as soon as possible.
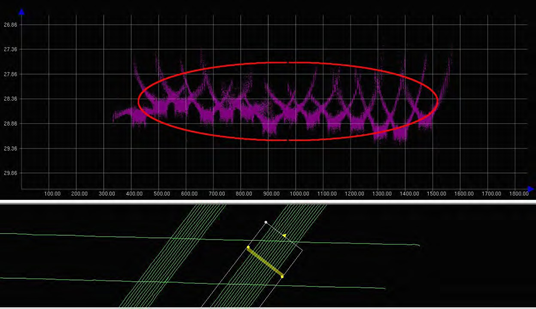
Figure 6: The residual systematic errors in sounding swath 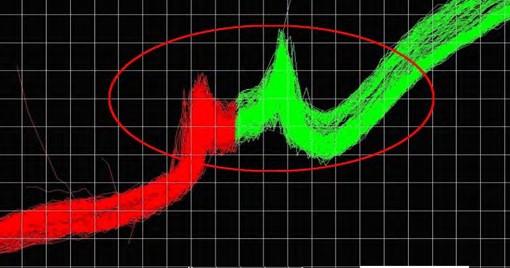
7(a)Swath edition mode 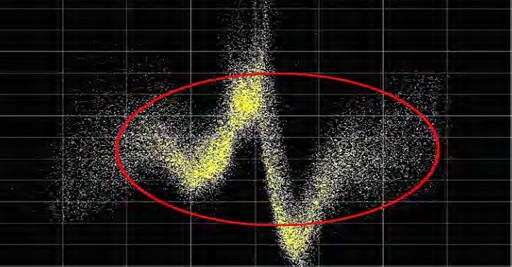
Figure 7(b): Subset edition mode
Figure 7: The “ W” phenomena caused by the hardware problem in sounding swath (a) Swath edition mode and (b) Subset edition mode
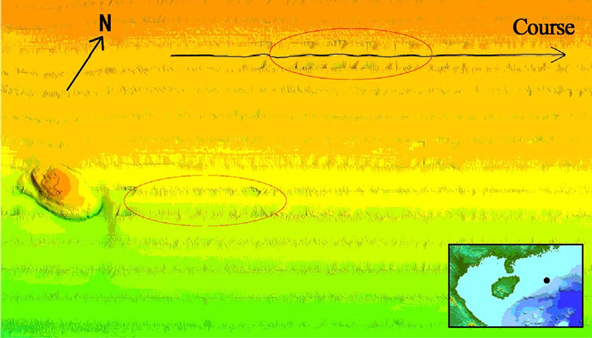
Internal ocean waves can affect sounding quality as shown in Figure 8. The sound velocity is expected to be steady through stratified distributions in the water column. The presence of internal ocean waves results in the supposed horizontal layer containing peaks
and troughs. The sea bottom will be distorted and the accuracy of the multibeam sounding will be affected (LIU SX et al., 2012). Furthermore, this kind of systematic error cannot be effectively reduced.
3. Quality Assessment of MBES Products
3.1 Quality Assessment Indexes
Similar to single beam sounding products, there are two quality assessment indexes for multibeam sounding products (GB, 1998 and CHB, 2011):
- the sounding limit error in different depths; and
- the differences in depths between the main lines and cross-over check lines.
The precision of the sounding system is reflected by the sounding limit error shown in Table 1. The accuracy of the survey data are reflected by the allowable depth differences of the cross points as shown in Table 2. The survey specifications require the comparison between cross point depths to be less than the 15% of total calculation point depths.
| Depths ( z ) (m) | The sounding limit error(2σ)(m) |
| 0< z ≤20 | ±0.3 |
| 20< z ≤30 | ±0.4 |
| 30< z ≤50 | ±0.5 |
| 50< z ≤100 | ±1.0 |
| z >100 | ± z ×2% |
| Depths( z ) (m) | Allowable difference in the cross point comparison (m) |
| 0< z ≤20 | 0.5 |
| 20< z ≤30 | 0.6 |
| 30< z ≤50 | 0.7 |
| 50< z ≤100 | 1.5 |
| z >100 | ± z ×3% |
For single beam soundings and according to the distribution characteristics of the sounding lines and sounding points, the surveying precision can be mainly evaluated by the correlative indices in Table 2. Therefore, the integrated dynamic effects of the marine environment are concealed in the indexes, as well as the effects of draft, ground swell, sounding velocity and the tide. In other words, the accuracy of each correction can not be reflected by the differences of the cross points.
For multibeam sounding collection, the sounding data provides full coverage of the seafloor. Apart from using the above two indexes, the
surveying precision can also be evaluated through each step of the surveying operation including data acquisition, processing and product making. The refraction of the sound ray can be checked during the swath editing of the single survey lines. Likewise, other data can be independently evaluated using the neighboring swaths, observing stitching faults and the “concave-convex” phenomenon caused by the integrated dynamic effects of the marine environment (such as the draft, sound velocity, ground swell and the tide) as well as the calibration and the installation errors in the system as shown in Figures 1 to 8. These gross and systematic errors can be detected during the acceptance inspections of the multibeam sounding data. Therefore the single ping, single swath and neighboring swaths and sounding surface have been included in the acceptance inspection and quality assessment of multibeam sounding.
3.2 Acceptance Inspection and Assessment
Based on the analysis of the sources and impacts of gross and systematic errors in multibeam sounding products, a quality inspection scheme has been developed for data acquisition, processing, product making, inspection and assessment processes. During the inspection of the multibeam sounding products, gross and systematic errors (seen in Figures 1 to 8) are identified. A full seafloor coverage inspection of the multibeam sounding capture and the variation in the marine topography is also undertaken.
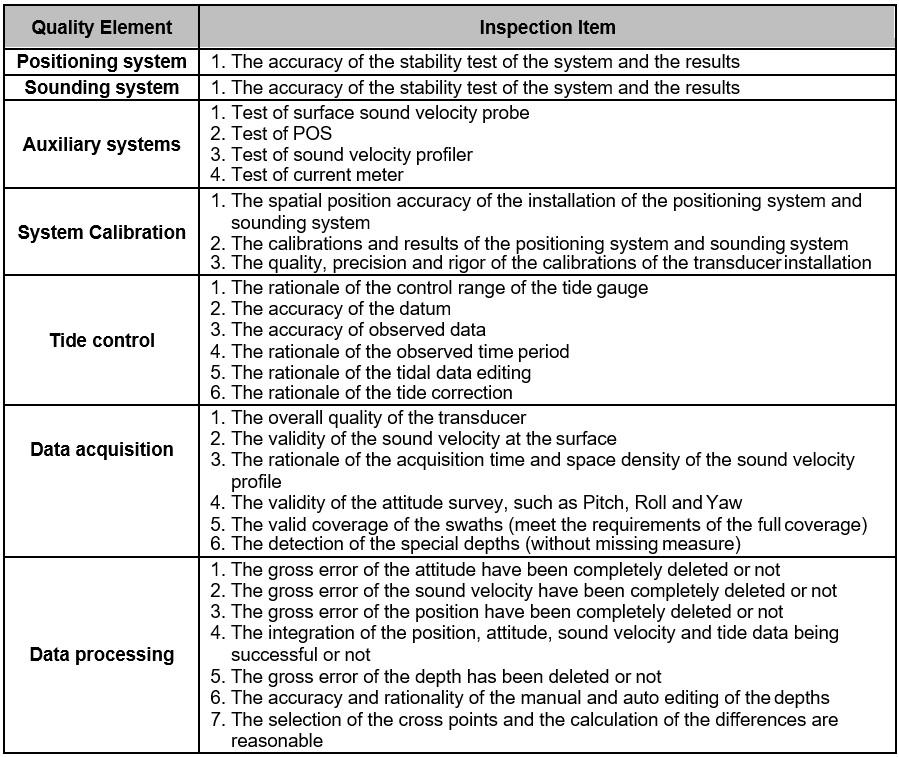
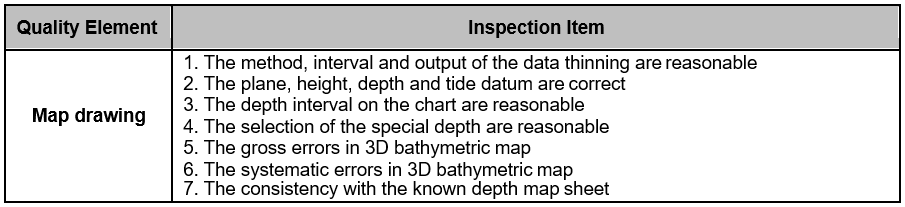
When the “map sheet” area is selected as the basic unit for inspection, eleven primary Quality Elements are tested. Each Element has several Inspection Items leading to 120 items being checked in total. The Quality Elements and the more important Inspection Items are listed in Table 3.
After completion of checks on all of the Quality Elements and Inspection Items, faults are sorted by quality element and graded by inspection element into:
- Serious Fault (Sort A): represents a fault which can result in the disqualification and rejection of the product for further use;
- Heavier Fault (Sort B): represents a fault which can influence the normal use of the products in a certain situation; or
- General Fault (Sort C): represents a fault which only has a slight influence on the normal use of the products.
The outcome of the assessment of the Quality Elements and Inspection Items are categorized into corresponding Fault Sorts (Table 4). According to the standards listed in Table 4, the quality value S of the multibeam sounding system can be calculated by the following formula (1).
S = 100 – 41a1 – k(6a2+a3) (1)
Where:
a1, a2, a3 is the number of the Sort A, Sort B, and Sort C faults
k is the adjust parameter: k=2 for class I, k=1 for class II, k=0.5 for class III.
| Quality Elements to be tested | Sort A | Sort B | Sort C |
| Positioning system | The positioning system has not been tested, the products are invalid, which can not be remedied.The test results are unqualified, the products are invalid, which can not be remedied. | The test items are incompleteThe time of the test does not conform to the ordinary demands | 1. The test precision is near to the tolerance |
| Sounding system | The sounding system has not been tested, the products are invalid, which can not be remedied. The test results are unqualified, the products are invalid, which can not be remedied. | The test items are incompleteThe time of the test does not conform to the ordinary demands | 1. The test precision is near to the tolerance |
| Auxiliary systems | 1. Test of surface sounding veloci- ty meter, POS system, sounding velocity profiler and automatic tide gauge have not been tested, the products are invalid, which can not be remedied. | 1. More than 2 types of auxiliary system have not been tested, but has little influence to the products | 1. Only one type of auxiliary system has not been tested, and has little influence to the products |
| System Calibration | Calibration of transducer instal- lation errors have not been tested, the products are invalid, and can not be remedied. Calibration of position installa- tion errors of the systems have not been tested, the products are invalid, which can not be remedied. | Errors are found due to the irreg- ular vibration in the instability of the transducer installation. The transducer installation errors have not been calibratedCalibration of transducer installa- tion errors is incomplete, the sys- tematic errors are introduced and observed between the swaths | Calibration of transducer installa- tion errors is incorrect, the systemat- ic errors are introduced and ob- served between the swaths, but the sounding precision has not exceed- ed the tolerance Errors due to the irregular vibra- tion has been observed due to the instability in the transducer installa- tion, but the sounding precision has not exceeded the tolerance |
| Tide control | 1. The vertical datum relation is faulty and the products are invalid, which can not be remedied. | 1. The tidal correction is incomplete, and stitching faults exist between the swaths, and the sounding preci- sion have exceed to the tolerance | 1. The tidal correction is incomplete, and stitching faults exist between the swaths |
| Quality Elements to be tested | Sort A | Sort B | Sort C |
| Data acquisition | The datum is faulty and the products are invalid, which can not be remedied. The surface sound velocity meter has been damaged | The stitching faults exceed the toler- ance in more than 10% of the swaths, and the products are invalid, which can not be remedied The sea bottom has not been fully covered by the effective beam points, which can result in missing an important navigation obstruction. | 1. The other faults are within toler- ance. |
| Data processing | The profile of the sound velocity does not meet requirements, which can reduce the inconsistent with the real marine topography in more than 20% of the swaths, which can not be reme- died The stitching faults have exceed the tolerance, which can not be remediedThe systematic errors exist in more than 20% of the swaths, which can not be remediedThe artificial sound ray correction must be applied, but has not been performed.The internal accuracy of the cross points exceed the tolerance | The attitude correction is incomplete, which can reduce the consistency with the real marine topography in more than 10% of the swaths, which can not be remedied The profile of the sound velocity does not accord with the requirements, which can reduce the consistency with the real marine topography in more than 10% of the swaths, which can not be remediedThe artificial sound ray correction must be effectively applied, which can reduce the consistency with the real marine topography in more than 20% of the swaths, which can not be remediedThe stitching faults or systematic errors exist in more than 10% of the swaths, which can not be remedied | The edit of the positioning data is incomplete The sound velocity correction is incomplete, which impacts the systematic errors in specific swathsThe attitude correction is incom- plete, which impacts the systemat- ic errors in specific swathsThe edit of the sounding depth is incomplete, which reduce the spurious signal |
| Map drawing | The systematic errors exist in neigh- boring map sheets, which can not be remediedThe systematic errors exist in 3D marine topography in large area, which have exceed the toleranceThe spurious signal exist in 3D ma- rine topography in large areas, which exceed the tolerance | The error impact on the special depth have exceed more than 10%The systematic errors exist in 3D marine topography in some areas, which exceed the toleranceThe spurious signal exist in 3D ma- rine topography in some areas, which exceed the tolerance | The error impact on the special depth are under 10%The systematic errors exist in 3D marine topography which exceed the toleranceThe spurious signal exist in 3D marine topography in some areas, which exceed the tolerance |
4. Conclusion and Recommendations
Differences exist between multibeam and single beam sounding systems during the data acquisition, processing and product generation processes. The nature and extent of gross and systematic errors also differ between these systems. For single beam sounding, resolving gross and systematic errors are more difficult. However, if each kind of quality issue can be resolved for multibeam sounding systems and processes, the quality problems in single beam sounding will be resolved accordingly. Meanwhile, where gross and systematic errors can been adequately recognized in the multibeam systems and processing, systema- tic problems can be resolved in multibeam sounding output data. The results of this paper provide reference to the system and environ- mental phenomena and the required ins- pection of the multibeam sounding products.
Multibeam sounding technology and methodo- logies will continue to be the mainstay of bathymetric surveying capability in the future, so the software and hardware technologies and processing capabilities for these sounding systems must continually improve. Meanwhile the correlative work processes and data inspections must be rigorously performed during surveying to identify and resolve data quality problems. By following a rigorous approach towards system installation, calibra- tion, processing and inspection, it has been found to achieve twice the product output with half the effort.
5. Acknowledgements
The authors would like to thank the senior engineer HUANG Motao, ZHAI Guojun, WEI Guobing and LV Liang. This paper is support- ed by the National Natural Science Fund Project, project number: 41374108, 41476087, 41576105, 41174062, and National Project863.
6. References
BAO Jingyang and LIU Yanchun. (2006). “A Study of Water Level Control for Hydrographic Survey”, Science of Surveying and Mapping, 31(6):49-51.
CHB. (2011). “Specifications for Quality Assessment of Hydrographic Sounding Products”, The Bureau of Mapping and Navi- gation of General Staff Headquarters, 2.22- 2011.
DONG Qingliang, CUI Minxun, ZHOU Junhua. (2011). “Analysis and Processing of Transform Geography of Multibeam Survey Convex and Concave”, Hydrographic Surveying and Chart- ing, 31(1):32-35.
GB. (1998). The Specifications For Hydro- graphic Survey, 12327-1998, China Criteria Press.
HUANG Chenhu, LU Xiuping, HOU Shixi. (2010). “Study on Detecting Outlier of Multibeam Sounding Based on CUBE Algo- rithm”, Hydrographic Surveying and Charting, 30(3):1-5.
HUANG Chenhu, LU Xiuping, SHEN Jiashuang. (2011). “Research of Common Mode About Hydrographic Water Level Correc- tion”, Hydrographic Surveying and Charting, 31 (4):13-16.
HUANG Chenhu, LU Xiuping, OUYANG Yongzhong. (2013). “Waterlevel Correction in Bathymetric Survey Along the Open-sea Route”, Hydrographic Surveying and Charting, 33(5):10-14.
HUANG Chenhu, WEI Guobing, ZHAI Guojun. (2013). “Method for Separation of Residual Water Levels in Hydrographic Survey”, Hydro- graphic Surveying and Charting, 33(6):5-10.
HUANG Motao, ZHAI Guojun, CHAI Hongzhou. (2011). “Analysis on the Mathemat- ical Models of CUBE Algorithm for the Detec- tion of Abnormal Data in Multibeam Echo- sounding”, Hydrographic Surveying and Charting, 31(4):1-4.
HUANG Xianyuan, ZHAI Guojun, HUANG Motao. (2010). “The Study of Constructing Trend Surface by Least Square Support Vector Machine”, Hydrographic Surveying and Chart- ing, 30(3):9-12.
LI Jiaobiao, WANG Xiaobo, HUA Zugen. (1999). Multibeam Sounding Principles Survey Technologies and Data Processing Methods, China Ocean Press, China.
LI Mingsan, Zhang Jie, Yan Huaizhi. (2007). “Order Statistics Filtering for Detecting Outliers in Depth Data Along a Sounding Line”, Hydro- graphic Surveying and Charting, 27(1):7-11.
LIU Shengxuan. (2009). “The Correction and Effect of Surface Sound Velocity on the Multibeam Echosounding”, Hydrographic Sur- veying and Charting, 29(6):26-29.
LIU Shengxuan and QU Xiaojuan. (2011). “Comparison of Processing Technique for Multibeam Echosoundings Residual Refrac- tion”, Hydrographic Surveying and Charting, 30 (2):49-51.
LIU Shengxuan and CUI Xiuyun. (2012). “The Effect of Oceanic Internal Waves on Multibeam Echosounding”, Hydrographic Surveying and Charting, 32(6):27-29.
LU Xiuping, HUANG Chenhu, HUANG Motao. (2008). “Research on Tidal Correction in the Coastal Survey Using Multibeam Bathymetric Sounding System”, Geomatics and Information Science of Wuhan University, 33(9):922-925.
OUYANG Yongzhong, LU Xiuping, HUANG Motao (2005). “The Application of GPS Altime- try in Hydrographic Surveying Without Tidal Observation”, Hydrographic Surveying and Charting, 25(1):6-13.
YANG Fanlin, LIU Jingnan, ZHAO Jianhu. (2004). “Detecting Outliers and Filtering Noises in Multibeam Data”, Geomatics and Infor- mation Science of Wuhan University, 29 (1):80-83.
YANG Fanlin and LI Jiaobiao, WU Ziyin. (2009). “The Methods of Removing Instantane- ous Attitude Errors for Multibeam Bathymetry Data”, Acta Geodaetica et Cartographica Sinica, 38(5):450-456.
ZHAO Jianhu and LIU Jingnan. (2008). Pro- cessing of Depth and Image of Multibeam Echo Sounder, Wuhan University Press. China.
ZHAO Jianhu, ZHANG Hongmei, YAN Jun. (2013). “Weakening Influence of Residual Er- ror for MBES Sounding”, Geomatics and Infor- mation Science of Wuhan University, 38 (10):1184-1187.
7. Author Biographies
Senior Engineer HUANG Chenhu
HUANG Chenhu has been a surveying engi- neer in the Naval Institute of Hydrographic Sur- veying and Charting since 2009. He previously worked in the Naval Survey Troop from 2004 to 2009 and was appointed as the substitute captain of the survey unit. He is engaged in hydrographic surveying theory and data processing and has extensive experience in multibeam sounding data processing and tide analysis.
Email: hchhch-1997@163.com
Dr BIAN Gang
BIAN Gang has been a lecturer in the Depart- ment of Hydrography & Cartography of Dalian Naval Academy since 2011. He received his Doctor’s degree in Geodesy and Surveying Engineering Subject in 2008. He worked in the naval training ship fleet from 2009 to 2011 and he was appointed as the navigation officer of training ship SHI Chang. He is engaged in hy- drographic surveying theory and data pro- cessing. He has extensive experience in hy- drographic survey practice and data pro- cessing.
Email: trighosts@163.com.
Master WANG Meina
WANG Meina has been a lecturer in the De- partment of Hydrography & Cartography of Da- lian Naval Academy since 2008. She received her Master’s degree in Underwater Acoustics Engineering in 2007 from Harbin Engineering University. She was engaged in hydrographic surveying theory and data processing. She has extensive experience in multibeam sounding practice and data processing.
Email: 757223829@qq.com
Dr LU Xiuping
LU Xiuping is currently an engineer in the Na- val Institute of Hydrographic Surveying and Charting. He was appointed as the Director of the Survey Department. He was engaged in the new technology of hydrographic stereo- scopic survey. He received his Doctor’s degree in Navigation Guidance and Control in 2011 from the Naval University of Engineering.
Dr HUANG Xianyuan
HUANG Xianyuan is currently an engineer in the Naval Institute of Hydrographic Surveying and Charting. He is engaged in hydrographic surveying and data processing. He received his Doctor’s degree in Geodesy and Surveying Engineering in 2011 from the Surveying and Mapping Institute of Information Engineering University of PLA.
Email: huangxianyuan007@163.com
Editor WANG Keping
WANG Keping is currently a senior engineer in the Naval Institute of Hydrographic Surveying and Charting. He was appointed as the senior editor of Hydrographic Surveying and Charting. He was engaged in the marine survey technol- ogy applications, edition and publication.
Email: wkpxy007@sina.com