

Abstract
1 Introduction
Maritime navigation forms the backbone of economic stability, social development, and disaster resilience for Small Island Developing States (SIDS). These nations, often characterised by geographic isolation and limited terrestrial resources, rely critically on maritime transport to sustain vital industries, facilitate international trade, and ensure the timely delivery of essential goods and services, particularly in natural disasters. While crucial, this dependence on maritime activity inherently introduces navigational risks, underscoring the need for robust risk assessment and mitigation strategies. International maritime conventions, including the United Nations Convention on the Law of the Sea (UNCLOS; UN, 1982), the International Convention for the Safety of Life at Sea (SOLAS; IMO, 1974), and the International Convention for the Prevention of Pollution from Ships (IMO, 1973, 2025), advocate for coastal States to conduct comprehensive risk assessments to minimise the occurrence of maritime incidents and safeguard both human life and the marine environment.
Maritime incidents, however, persist within SIDS despite these obligations, often resulting in significant negative consequences, including economic losses, environmental damage, and loss of life. For instance, on 21 February 2010, the container ship Angeln capsized and sank 2.5 miles south-west of Vieux Port, Saint Lucia, after taking on water and developing a starboard list. While all 12 crew members were rescued, losing the vessel led to significant economic consequences, including salvage costs and the removal of 230 tons of bunker fuel (IMO, 2010). On 19 July 1979, the oil tankers Atlantic Empress and Aegean Captain collided approximately 10 miles off the coast of Tobago during a tropical rainstorm. Both vessels caught fire and began leaking oil immediately after the collision, resulting in the tragic loss of several crew members. The Atlantic Empress ultimately spilt an estimated 287,000 tonnes of oil, marking it the largest ship-source spill ever recorded (ITOPF, 2025). On 11 March 2023, the Calypso 2, a charter vessel, foundered in the coastal waters of Anguilla, resulting in the loss of two lives and being listed as a very serious marine casualty (IMO, 2024). More recently, on 7 February 2024, the tank barge Gulfstream spilt heavy fuel oil off the coast of Tobago, resulting in a Tier 2 oil spill (Trinidad and Tobago Guardian, 2024). The National Oil Spill Contingency Plan of Trinidad and Tobago categorises a Tier 2 oil spill as a medium-sized spill that can significantly impact the surrounding area. It requires regional or national support to ensure an adequate spill response (MEEA, 2013).
The Greater Caribbean Region (GCR), encompassing a diverse array of SIDS, exemplifies the challenges and vulnerabilities of maritime activity in such contexts. Within this region, Trinidad and Tobago (T and T), an archipelagic nation situated off the north-eastern coast of Venezuela, serves as a microcosm of the broader maritime landscape, sharing maritime characteristics, governance frameworks, and environmental vulnerabilities. Like major Caribbean ports such as Kingston (Jamaica), Freeport (Bahamas), and San Juan (Puerto Rico), T and T’s Gulf of Paria and the waters off Chaguaramas experience relatively high vessel density, diverse maritime activities (Sánchez & Wilmsmeier, 2009), and navigational hazards (NGA, 2024). Vessel tracking platforms like Marine Traffic indicate that shipping density, vessel composition, and transit patterns in T and T are comparable to trends observed throughout the region, reinforcing the applicability of a standardised risk assessment framework (MarineTraffic, 2025). Recent hazardous sea alerts issued in T and T, St. Vincent and the Grenadines, Grenada, Antigua and Barbuda, and the British Virgin Islands highlight the frequent occurrence of rough seas, long-period swells, and high surf warnings, which threaten vessel stability, disrupt port operations, and complicate oil spill response efforts (Loop News, 2024). SIDS lack the infrastructure to handle extreme weather (Muñoz & Ötker, 2018), increasing the risk of ship accidents and cargo delays. Additionally, the Institute of Marine Affairs (IMA) study identifies T and T’s Gulf of Paria as a high-risk zone for ship-source pollution, where rough seas can intensify oil spill dispersal and complicate response strategies, similar to high-traffic areas across the region (Singh et al., 2015). From a governance perspective, T and T operates under the same regulatory frameworks as the broader Caribbean maritime sector, ensuring standardised risk mitigation approaches. The Caribbean Memorandum of Understanding on Port State Control (CMoU on PSC) establishes uniform vessel inspection protocols, preventing substandard operations through compliance with SOLAS, MARPOL, and the International Convention on Standards of Training, Certification and Watchkeeping for Seafarers (STCW; IMO, 1978) regulations (CMoU, 2020). The Caribbean Shipping Association (CSA) and the Caribbean Community (CARICOM) also facilitate regional cooperation on port efficiency, vessel monitoring, and sustainability initiatives (CSA, 2024). The dynamic maritime environment, shared governance structures, and risk management frameworks demonstrate that T and T’s maritime space is representative of regional conditions, reinforcing its suitability as a case study for risk assessment methodologies applicable to the SIDS of the GCR.
Drifting collisions, a specific type of maritime incident which this study defines as the collision of a drifting vessel with another moving vessel, pose a significant risk within T and T’s waters. Several documented incidents highlight the potential severity of such events. In February 2009, a luxury yacht went adrift along the northern coastline of Trinidad, near Blanchisseuse, during heavy rains, resulting in one fatality (Trinidad and Tobago Express, 2009). In September 2018, the partially submerged MV Treasure Queen II drifted near Pier II along the north-western coastline of Trinidad (Trinidad and Tobago Guardian, 2018). In December 2020, during rough seas, a deep-sea fishing boat drifted towards land near the south-eastern coastline in Speyside (Trinidad and Tobago Express, 2020). In May 2021, a drifting vessel, suspected to be a migrant boat, was discovered near Belle Garden Beach in south-eastern Tobago (LoopTT, 2021). In March 2022, a trawler overturned and drifted for over two hours off the western-coastline of Tobago (Trinidad and Tobago Newsday, 2022). As previously mentioned, in February 2024, the Gulfstream tanker caused a Tier 2 oil spill after drifting to Tobago’s northern coastline (Trinidad and Tobago Newsday, 2024). These incidents, along with other reported occurrences involving SOLAS vessels (Rambarran, 2021) underscore the need for practical risk assessment and mitigation measures to address drifting collisions and enhance maritime safety in T and T. Historical data indicate that the northern and north-western coastlines of Trinidad, as well as waters surrounding Tobago, are particularly susceptible to such incidents. The recurrence and severity of these events – often occurring under rough sea conditions or as a result of equipment failure – highlight gaps in existing monitoring and predictive frameworks. They also emphasize the necessity for a locally adapted, data-efficient model capable of estimating where and how drifting collisions are most likely to occur. This study addresses that need by developing a probabilistic risk assessment model that simulates drifting events and estimates incident probabilities using publicly available data.
Traditional maritime risk assessment methodologies, such as those outlined in the International Organization for Marine Aids to Navigation (IALA) risk management toolbox and the OpenRisk Toolbox, often present significant challenges for SIDS due to their reliance on combinations of extensive expert judgment, proprietary datasets (e.g., AIS data, high-resolution bathymetric data), and specialised software, training and consultancy services. These requirements can be prohibitively expensive and resource-intensive for SIDS, limiting their capacity to implement such methodologies effectively. To address these challenges, this study proposes an alternative maritime risk assessment model tailored explicitly to the resource-constrained environments of SIDS, focusing on estimating the probability of drifting collisions. The model minimises data requirements by utilising publicly available data sources, including historical traffic pattern images, port call logs, and open-source traffic pattern images, while maintaining predictive accuracy. By incorporating a Monte Carlo simulation approach and fault tree analysis (FTA) within a Geographic Information System (GIS), the model enables the calculation of localised causation probabilities of maritime incidents and facilitates the construction of statistical scenarios for annual incident probability estimations.
The development and validation of this model within the context of T and T’s maritime domain provide valuable insights for other SIDS facing similar challenges. The model’s reliance on publicly available data and adaptability to varying maritime environments enhance its scalability and replicability. It offers a practical and cost-effective solution for maritime risk assessment in resource-constrained settings. The findings of this study contribute to a deeper understanding of maritime risks and empower policymakers, researchers, and maritime stakeholders to prioritise interventions and develop effective strategies for mitigating drifting collisions and enhancing overall maritime safety within SIDS regions.
2 Literature review
The Aids to Navigation Requirements and Management – Risk Management working group of IALA (IALA, 2025) surveyed maritime authorities worldwide to identify the risk assessment methodologies commonly used in their operations. Eighty-one responses were received, some requiring further clarification from the respective authorities. Among the usable results, 28 respondents mentioned the Simplified IALA Risk Assessment (SIRA), 21 cited the IALA Waterway Risk Assessment Program (IWRAP), ten referenced the Ports and Waterways Safety Assessment (PAWSA MK II), and two mentioned the Simulation and Analysis Model for Safety of Navigation (SAMSON). The hydrographic risk assessment approach developed by Land Information New Zealand (LINZ) was not included as a response in this survey but has been utilised by hydrographic authorities in the South-West Pacific to prioritise resources for charting. This study reviews the applicability of these tools within resource-constrained environments such as SIDS. It examines key factors such as the availability of expert judgment, access to proprietary datasets derived from automatic identification systems (AIS) and historical vessel incident databases, the role of navigational hazard data, and the need for specialised training and consultancy. The probabilistic frameworks underlying these approaches are evaluated, and complementary methods, such as Monte Carlo simulations and FTA within a GIS are examined to develop a maritime risk assessment approach tailored for SIDS.
The Simplified IALA Risk Assessment (SIRA) was the most widely used maritime risk assessment tool among the maritime authorities that completed the survey. Developed by IALA, SIRA provides a structured and resource-efficient method for conducting small-scale risk assessments based on industry best practices. It requires minimal resources for implementation and relies on stakeholder engagement and expert judgment to identify potential hazards, assess their likelihood and severity, and develop mitigation strategies. This approach offers national authorities a practical framework for initial risk assessments, particularly in resource-constrained environments. As data availability and resources improve, authorities are encouraged to transition to more advanced tools, like IWRAP and PAWSA, that apply scientifically rigorous approaches, incorporating robust data analysis, theoretical modelling, simulation techniques, and expert judgment to assess the probability and consequences of maritime incidents (IALA, 2022c).
The IWRAP is a computer-based tool for calculating the probabilities of collisions, groundings and allisions. It models waterways using geometric and bathymetric data, and analyses AIS-based traffic volumes and compositions. Annual incident probabilities are derived using causation factors, calibrated against historical data and informed by expert judgment. While IWRAP provides a robust framework for estimating probabilities, its application can be limited by its reliance on proprietary datasets and licensing requirements (IALA, 2022a). IWRAP does not quantify the consequences of incidents, and it is often complemented by tools like the Ports and Waterways Safety Assessment (PAWSA). PAWSA incorporates about forty experts’ qualitative inputs during a two-day workshop to evaluate the broader consequences of maritime incidents and derive overall risk indices and options for mitigation (IALA, 2022b).
Using a comprehensive voyage database, the SAMSON model calculates accident probabilities by identifying potentially dangerous situations, termed exposures. These exposures are categorised based on traffic types, such as route-bound (e.g., merchant vessels and ferries), non-route-bound traffic (e.g., fishing or recreational vessels), and specific accident scenarios. Accident frequencies are determined by multiplying the calculated exposures by casualty rates, which are derived from global datasets, including historical accident data from Lloyd’s List Intelligence. This approach enables SAMSON to estimate the probability of various maritime incidents, such as collisions, groundings, and fires. SAMSON also serves as a strategic tool for policymaking and contingency planning by evaluating the potential impact of safety measures on casualty frequencies. However, its reliance on proprietary voyage datasets and the need for expert judgment can limit its accessibility, particularly for resource-constrained environments (MARIN, n.d.).
Within the LINZ method, the likelihood of an incident at sea is determined by analysing vessel traffic density acquired from AIS data and identifying hazards that could result in loss of life and/or pollution. These consequences are represented spatially within a GIS and combined with likelihood using weighting factors to calculate risk. This methodology, fully documented by Riding & Rawson (2015) for GIS implementation, aims to produce a heat map across the entire waterway to prioritise resource allocation effectively. However, the method requires extensive representation of waterway features within a GIS and relies on expert judgement – resources that are not always readily available within SIDS.
The framework underpinning these probabilistic maritime risk assessment approaches is based on the formula NC = NA × PC where NC is the geometric probability, NA represents the geometric number of vessel encounters assuming blind navigation, and PC denotes the causation probability of such incidents (Fujii, 1971; MacDuff, 1974). This review highlighted the challenges of applying existing maritime risk assessment approaches in resource-constrained environments. Traditional approaches like IWRAP, SIRA, PAWSA, SAMSON, and the LINZ method, as well as those utilising Monte Carlo simulation techniques rely on combinations of extensive proprietary datasets, licensing requirements, and costly training or consultancy fees. It should be noted that risk assessment methods are designed to achieve different objectives, and therefore, results across methods are not always directly comparable. Table 1 presents a comparative summary of the reviewed methodologies. It contrasts each model based on key factors such as data requirements, reliance on expert judgment, implementation cost, and suitability for SIDS. This comparison illustrates that while tools like IWRAP and SAMSON offer high analytical precision, they may not be feasible in regions with limited access to proprietary AIS datasets, large expert panels, or budgetary capacity for training and consultancy. SIRA remains highly applicable to such regions; however, it is intended primarily as a basic tool to identify risk control options. In contrast, the proposed model prioritises simplicity, accessibility, and probabilistic analysis, making it especially suitable for small maritime administrations operating with minimal resources.

2.1 Estimation of the geometric number of incident candidates
Monte Carlo simulations estimate NA by dynamically modelling vessel traffic patterns and simulating ship domains to identify and count potential incident candidates. By incorporating probabilistic inputs such as encounter angles, vessel speeds, and traffic density, these simulations replicate real-world scenarios to identify critical encounters. To model discrete events such as vessel encounters, Monte Carlo techniques are adaptable to various probability distributions, including normal and Poisson distributions. Applications of Monte Carlo simulations in maritime contexts include Przywarty (2008), who employed Poisson processes to identify critical encounters, and Goerlandt & Kujala (2010), who used traffic scenarios to estimate incident probabilities. Recent advancements highlight the versatility of Monte Carlo methods, such as integrating them with machine learning models (Vukša et al., 2022) or semi-Markov processes (Bogalecka & Dabrowska, 2023). Despite these innovations, their application in resource-constrained environments such as SIDS remains limited due to similar challenges, including extensive data and computational resource requirements.
2.2 Estimation of the causation probability
FTA is a deductive method that models the sequence of events leading to incidents. It begins with a top event, such as a collision, and traces its root causes through a hierarchical structure of basic events connected by logic gates. Probabilities are assigned to these basic events, enabling the calculation of the top event probability (Haugen & Kristiansen, 2023). FTA was chosen for this study because it is simple to construct, data-efficient, and adaptable to resource-constrained contexts like SIDS. Its structured framework facilitates the integration of human, technical, and environmental factors into the model, aligning with the study’s goal of developing a practical and replicable methodology for SIDS. The reliability and versatility of FTA have been extensively validated, as highlighted by the National Aeronautics and Space Administration (NASA) Office of Safety and Mission Assurance (NASA 2002), underscoring its effectiveness in modelling complex systems and quantifying failure probabilities. Causation probabilities in the FTA model are influenced by human errors (e.g., inattentiveness), technical failures (e.g., equipment malfunctions), and environmental conditions (e.g., low visibility) (IALA, 2009). These factors are modelled using historical data from the public domain, such as incident reports and records from national authorities. Unlike Bayesian Networks (BNs), which require extensive conditional probabilities and datasets, FTA allows for simplified assumptions without compromising analytical accuracy.
Traffic events simulated using the Monte Carlo technique do not account for the impact of risk mitigation measures which are globally recognised as critical safety measures that significantly reduce collision probabilities. For instance, pilotage in regions like the Great Belt and Turkish Straits has been demonstrated to reduce incident risks by up to 59 times. The causation factor value can be adjusted accordingly to incorporate the effect of these measures (IMPA, 2022). In addition to pilotage, other risk reduction measures, such as operational procedures, are widely recognised as effective in enhancing maritime safety. However, the literature has not extensively quantified their precise impact on incident probabilities. When using IWRAP, IALA recommends adjusting the causation factor value based on historical incident data to align model outputs with observed accident frequencies. IALA further advises that any adjustments to the causation factor should be documented to ensure transparency and reproducibility in risk assessments. While this approach is not strictly scientific, it serves as a practical solution in the absence of a more precise method (IALA, 2024).
This review highlighted the challenges of applying existing maritime risk assessment approaches in resource-constrained environments. Traditional approaches, such as IWRAP, SIRA, PAWSA, SAMSON, and the LINZ method, as well as those utilising Monte Carlo simulation techniques to assess NA, relied on combinations of extensive proprietary datasets, licensing requirements, and costly training or consultancy fees. It is worth noting that risk assessment methods are designed to achieve different objectives, and therefore, results across methods are not always directly comparable (Seepersad et al., 2020).
3 Methodology
This study addresses the limitations of traditional maritime risk assessment tools by leveraging publicly accessible data and structured modelling techniques to enhance accuracy and scalability. The methodology provides a computationally efficient and representative framework for modelling vessel movements, making it particularly suitable for resource-constrained environments. The methodology integrates Monte Carlo simulations to estimate the geometric number of drifting collision candidates (NA) and FTA to model causation probabilities (PC), unifying these components within the probabilistic framework (NC = NA × PC).
3.1 Data collection and sources
To address the challenge of limited AIS data, this methodology incorporated an alternative approach using traffic pattern images published on open-source platforms such as Marine Traffic. These images substitute AIS data from terrestrial or satellite systems when unavailable, ensuring maritime traffic modelling remains possible. For such cases, port call logs for one month can be analysed to estimate the frequency of vessel arrivals. The resulting data can then be scaled to represent an annual dataset, assuming no significant seasonal variations in traffic patterns. This scaling approach, also utilised in IWRAP, is designed for computational efficiency, enabling streamlined analysis without requiring complete year-round datasets (IALA, 2024). Historical data on vessel incidents were gathered through correspondence with the Navigational Aids Officer at the Maritime Services Division of T and T (Rambarran, 2021) and supplemented by reports from local newspapers. Human, technical, and environmental factors required for developing the fault tree were sourced from existing literature, including environmental data from the T and T Meteorological Office website. The modelling process was facilitated using ArcGIS Pro version 3.1.2, which utilizes the Model Builder environment and the integrated Python 3.9 interpreter for spatial analysis. ArcGIS Pro offers monthly subscription options, making it accessible and cost-effective for resource-constrained applications.
3.2 Simulation of the geometric number of drifting collision candidates
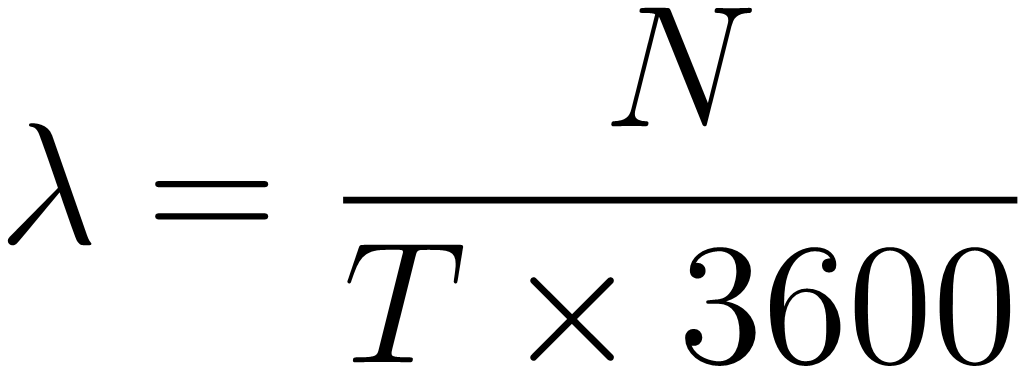
The process of modelling vessel movements to identify the geometric number of drifting collision candidates consists of eight major steps. These steps are summarised in Table 2. Fig. 1 depicts traffic patterns for 2023 obtained from MarineTraffic (2025), which were analysed to identify commonly utilised traffic routes for each port, with AIS data used as an alternative when available. Turning zone boundaries along these routes were delineated and stored as individual records in a polygon feature class, ensuring that each traffic route and related turning zones were uniquely identified. A random selection of traffic event identifiers was performed to ensure a diverse sample of vessel movements (refer to step 1 in Table 2). At this stage, a traffic event was a randomly selected vessel transit instance, identified from traffic pattern images or AIS data. After selection, each event was assigned a simulated departure time, navigation trajectory, and time-based movement data using probabilistic modelling techniques. By the end of the process, each traffic event had a complete profile – including spatial path, temporal dynamics, and safety domain – suitable for collision risk analysis. Departure times were modelled using a Poisson process, where the transit frequency (λ) was calculated based on the number of traffic events over a 24-hour epoch as shown in Eq. 1 below and step 2 in Table 2.
 |
(1) |
where
λ: event rate (events per second)
N: total traffic events
T: epoch duration (24 hours)
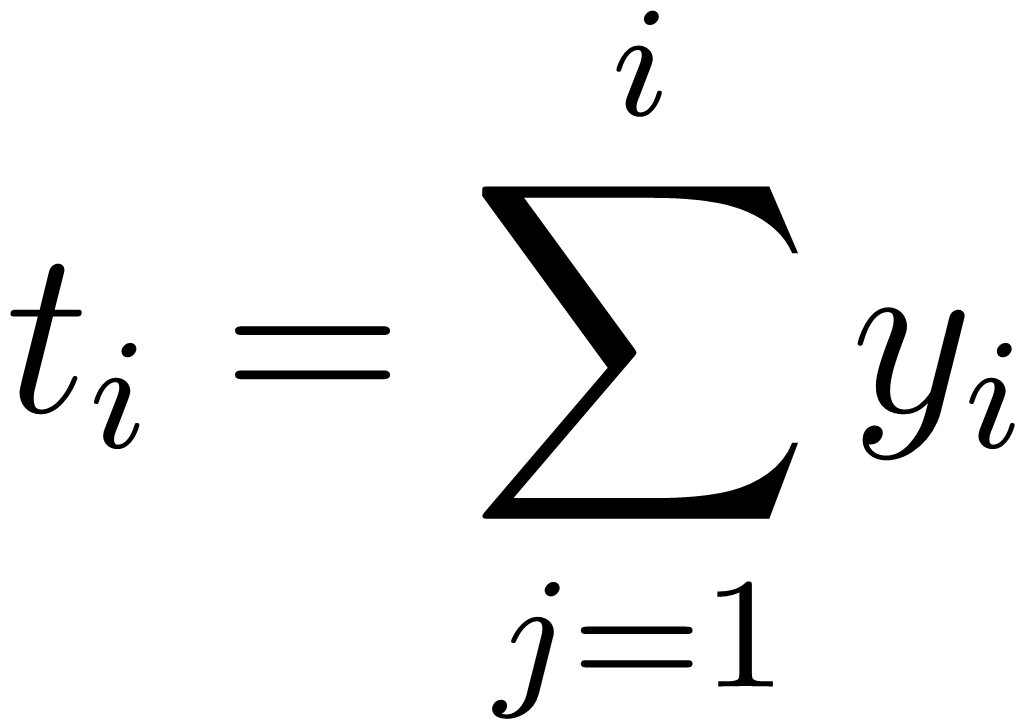
Vessel movement through turning zones was simulated by generating waypoints within the predefined boundaries and connecting them to form continuous transit paths. Each vessel’s navigation trajectory was determined by sequentially linking these waypoints (refer to step 3 in Table 2). The inter-arrival times were generated using an exponential distribution to reflect the assumption that vessel departures occur independently at a constant rate. This was implemented using the inverse transform sampling method, where the time between successive departures was calculated as shown in Eq. 2 below and step 4 in Table 2.
 |
(2) |
where
ti: timestamp of the ith event
yj: inter-arrival time (randomly generated using 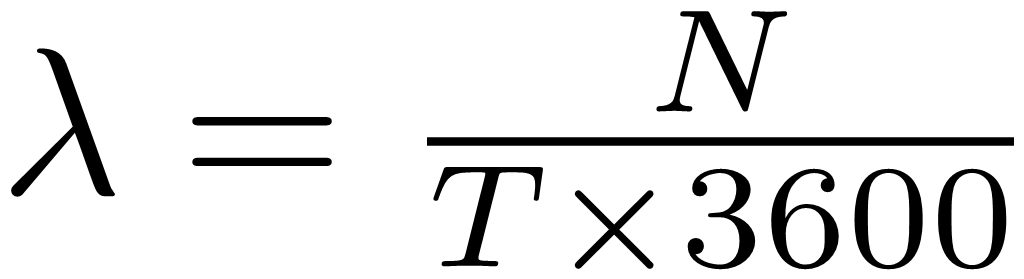 , where Uj~U(0,1) is a uniformly distributed random variable, ensuring that inter-arrival times follow an exponential pattern
The timestamps naturally spanned 17 days due to the cumulative nature of inter-arrival times and the total number of randomly selected traffic events. In real-world scenarios, however, factors such as port congestion, scheduling constraints, and environmental conditions can influence departure times, meaning vessel movements may not always adhere strictly to an exponential distribution. If structured scheduling or external constraints impact vessel traffic, alternative approaches, such as empirical distribution modelling, may be required.
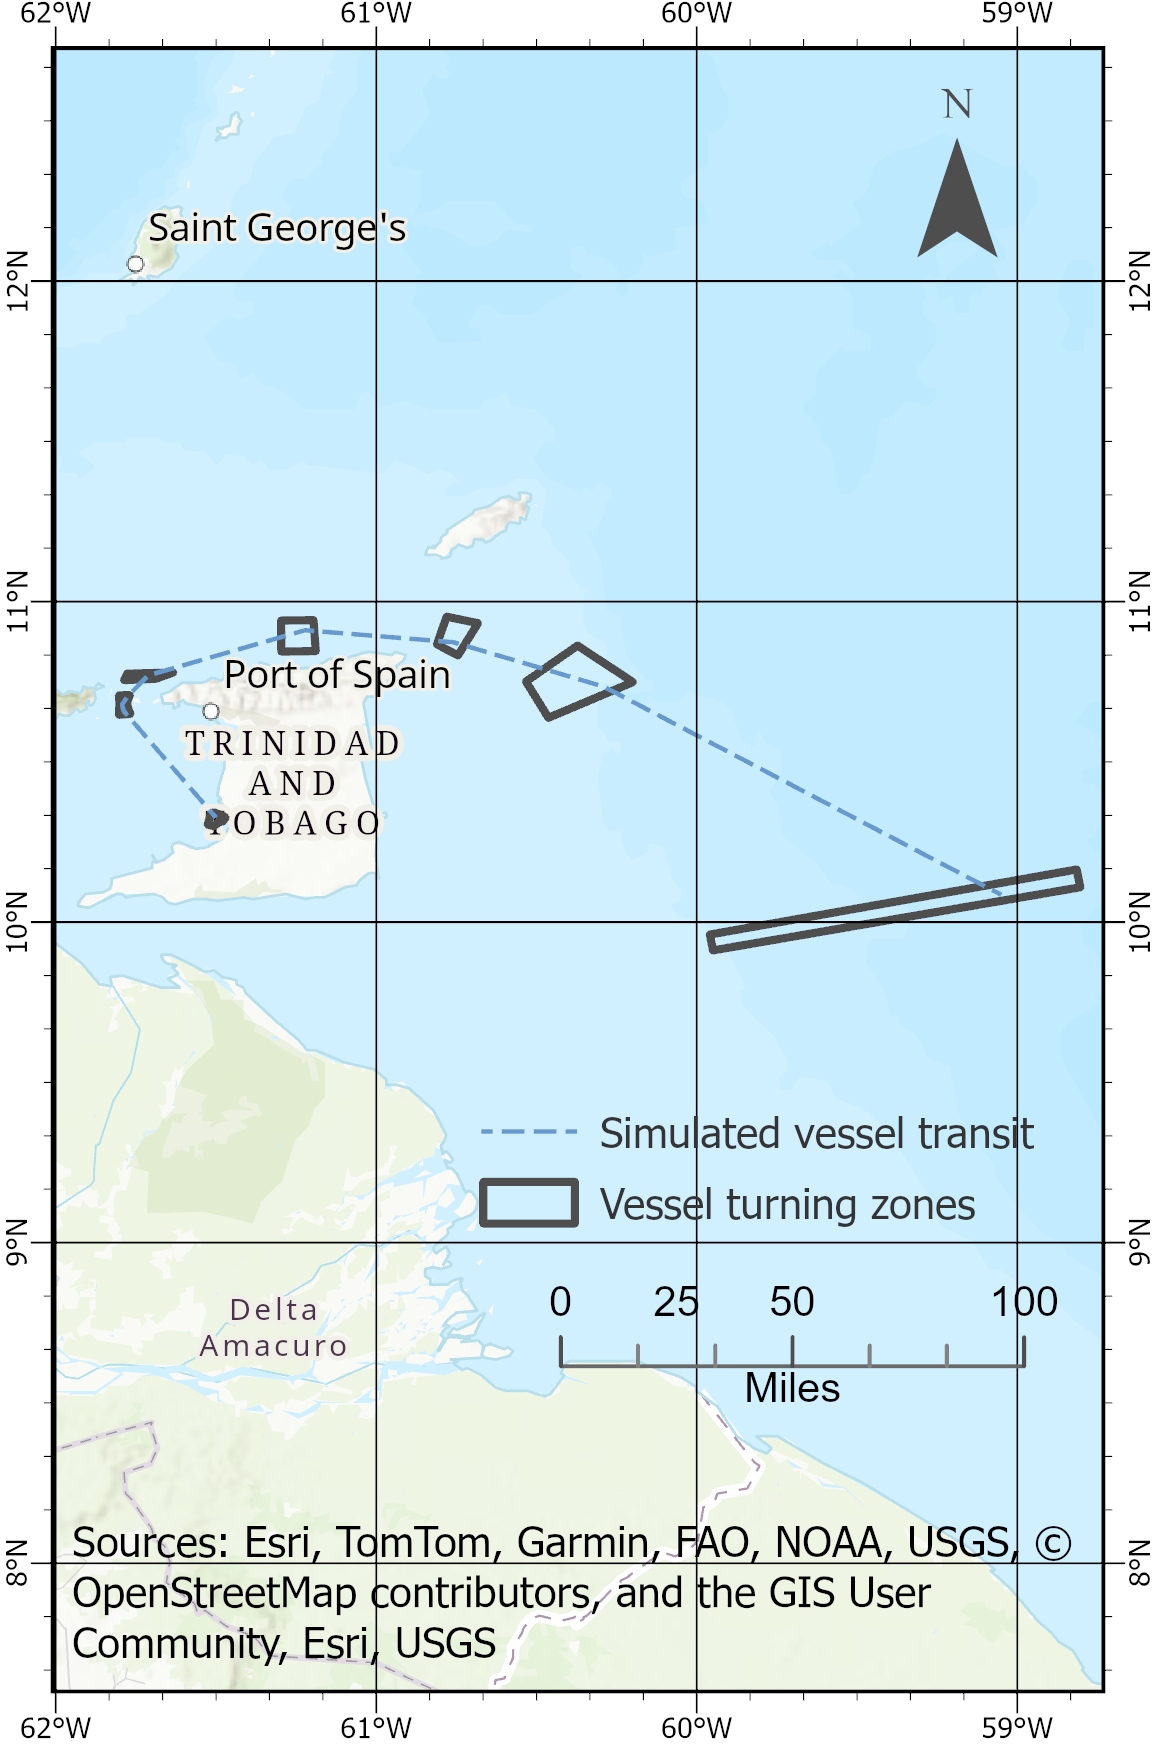
Fig. 2a illustrates the simulation of a single traffic event, including the associated turning zone boundaries along a randomly selected route. Fig. 2b presents the density of traffic events after the simulation was completed. A comparison of Figs. 2b and 1 reveal similar traffic distributions. Differences in the spatial distribution of maritime traffic along the south-eastern shoreline of Trinidad are attributed to offshore installations constructed after this study, including the Galeota Port Expansion and the East Coast Marine Area (ECMA) platforms and facilities associated with British Petroleum Trinidad and Tobago‘s (BPTT)’s gas fields. Notably, the colour coding in Fig. 1 represents traffic density relative to global patterns, whereas Fig. 2b is scaled to the local simulation.
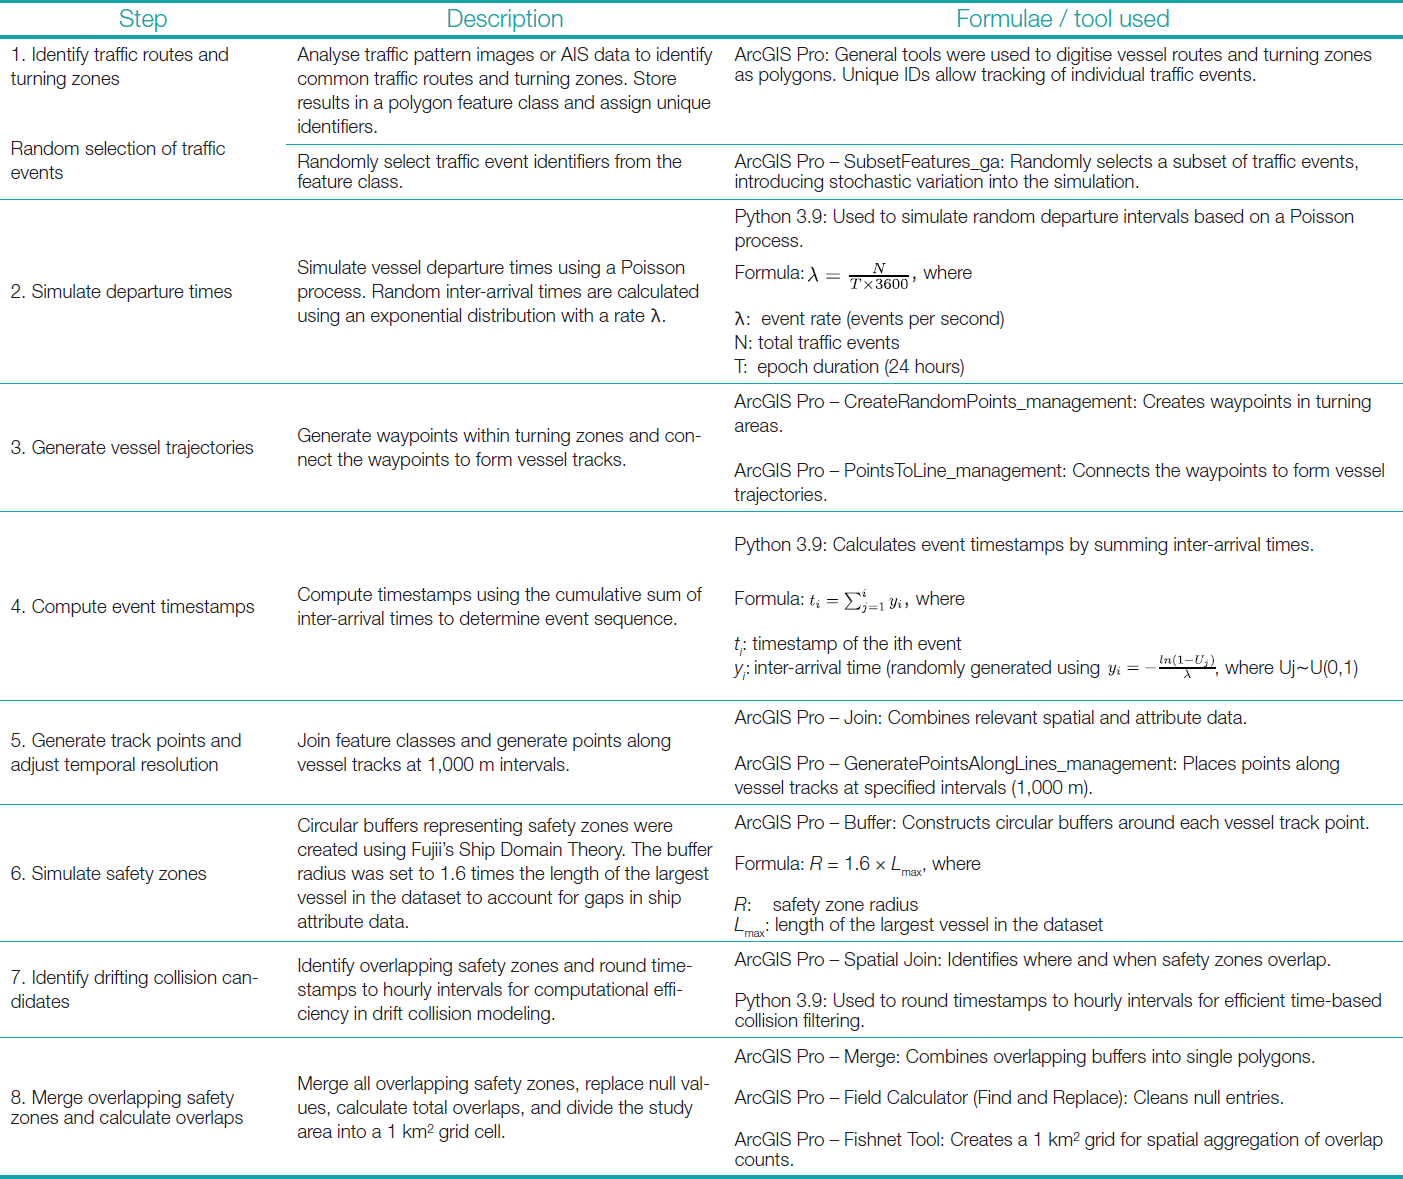


Following vessel track generation, feature classes were joined into a unified dataset for analysis. Track points were placed at 1,000-meter intervals to ensure that safety buffers along the same route did not overlap, simplifying the spatial representation of vessel movements (refer to step 5 in Table 2). Timestamps were then adjusted to the nearest hour to more efficiently model vessel drift and potential collisions. Using hourly intervals reduced computational demands while enabling the simulation of traffic volume across multiple shipping routes within T and T’s Economic Exclusive Zone (EEZ). Based on Fujii’s Ship Domain Theory, safety zones were defined as circular buffers around each vessel position. Due to the uniform circular shape, no distinction was made between inbound and outbound vessel movements at port locations. As shown in Eq. 3 below and step 6 in Table 2, the buffer radius was set to 1.6 times the length of the largest vessel in the dataset to accommodate potential gaps in ship attribute data. For this study, the largest vessel measured 300 meters, resulting in a safety zone radius of 480 meters. This standardisation eliminated the need for vessel traffic attributes defined in AIS data.
| R = 1.6 × Lmax | (3) |
where
R: safety zone radius
Lmax: length of the largest vessel in the dataset
Overlapping safety zones were analysed to identify drifting collision candidates (refer to step 7 in Table 2). To consolidate results, all overlapping safety zones were merged into a single dataset, and the annual number of overlaps per square kilometre was computed to quantify potential drifting collision hotspots (refer to step 8 in Table 2). The study area was then divided into a standardised 1 km² grid, ensuring that all spatial data layers remained aligned. The spatiotemporal resolution employed was deemed sufficient for capturing broader vessel movements associated with drifting, aligning with the scope of this analysis. While higher-resolution hydrodynamic data could improve the model, the selected approach prioritises scalability and computational feasibility without imposing excessive processing requirements.
3.3 Estimation of the causation probability
Historical incident reports obtained from the Maritime Services Division of T and T, alongside newspaper articles, were analysed to identify the causes of maritime incidents. These causes were categorised using the framework of causation factors outlined by IALA (2009). The probabilities associated with each cause contributing to a failed evasive manoeuvre are presented below.
- Based on historical incident data from 2018 to 2024, provided by Rambarran (2021), and national newspapers, the probability of human error aboard SOLAS-compliant vessels was estimated at 0.6 per year.
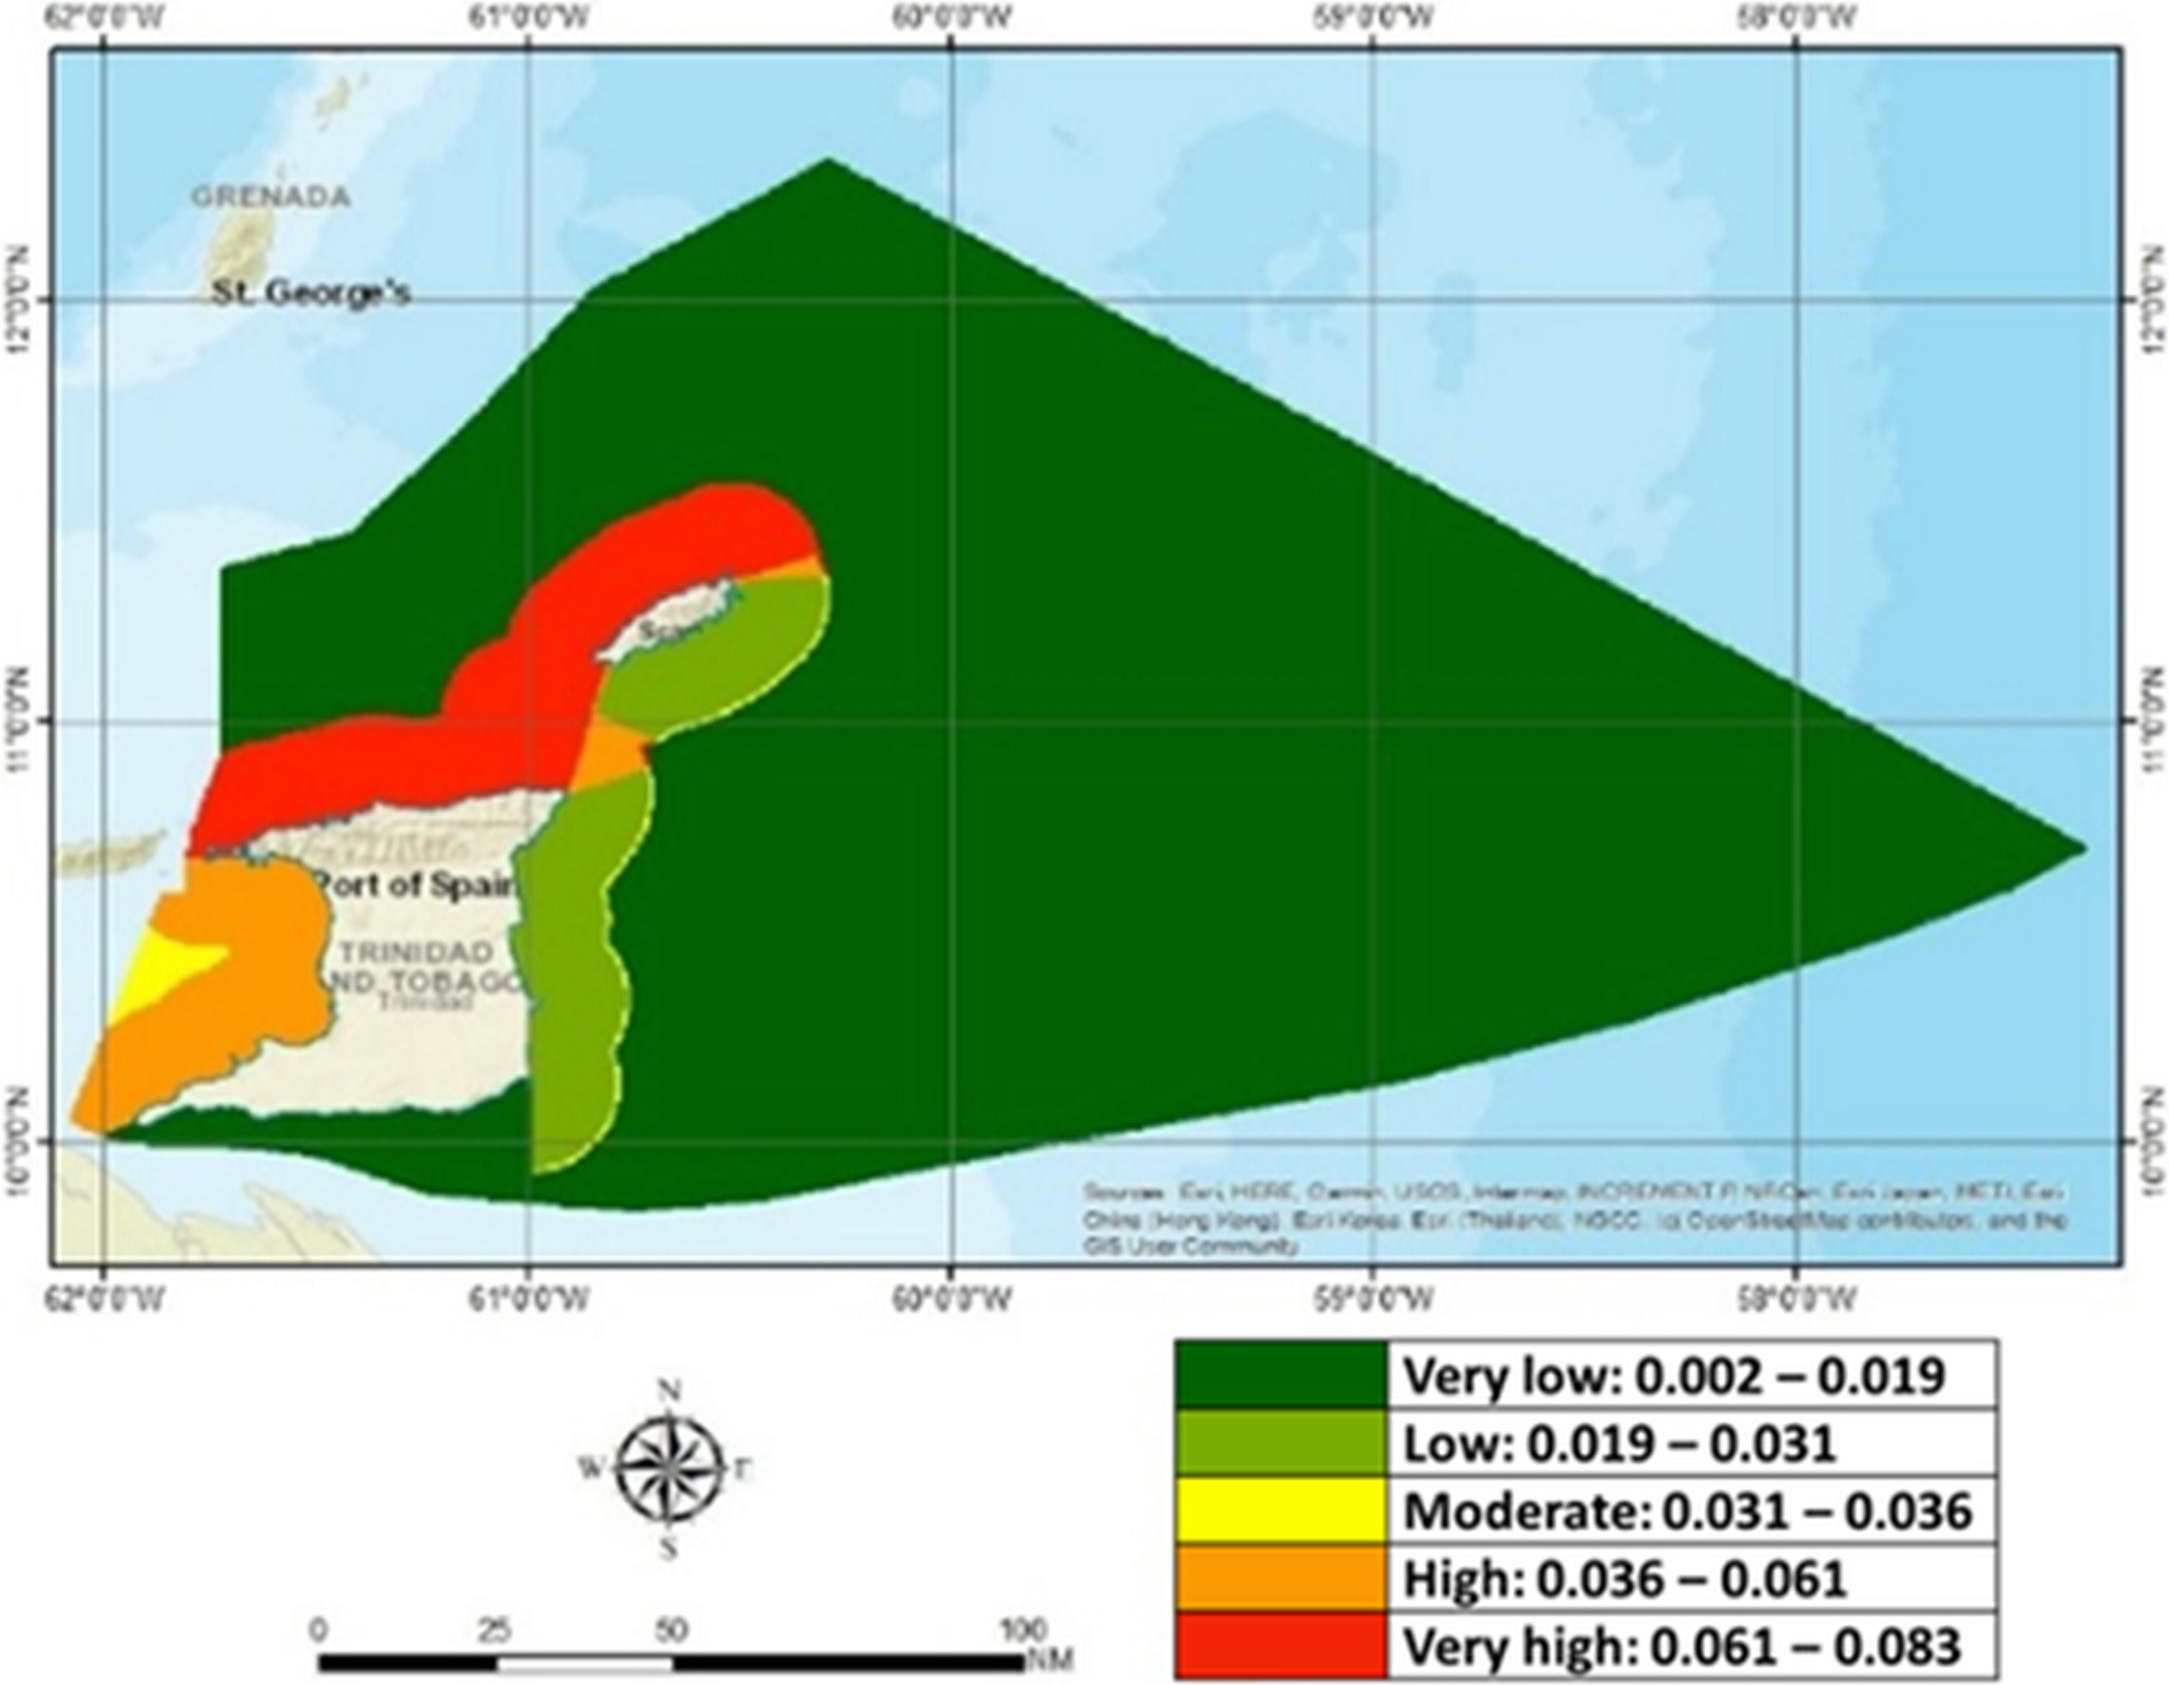
- Environmental risks, such as hazardous seas and reduced visibility, were assessed using national meteorological bulletins (2020–2022) (T and T Meteorological Service, 2025), and local interviews. Hazardous sea conditions were evaluated geographically (see Fig. 3a). Based on expert interviews, reduced visibility due to squalls was estimated to occur twice per month and last 18 minutes per event, with an annual probability of 0.0008.
- The Port State Control of Trinidad and Tobago, supported by the United States Coast Guard, assigns ship risk profiles based on type, age, Flag State, and historical detention records, following principles aligned with the Paris Memorandum of Understanding. Detention probabilities from inspections were used to estimate the probability of undesired scenarios resulting from technical deficiencies. Between 2005 and 2021, 2,031 ships were inspected, with 16 detentions, resulting in an annual average detention probability of 0.941 over the 17 years (CMoU, 2024).
- Human failure to address onboard deficiencies was modelled using a causation probability of 0.00001, based on Kirwan’s (1994) research on operator performance for well-designed tasks, as cited in the relevant literature on the IALA webpage. This value represents the probability of failure to repair the drifting scenario before the occurrence of the undesired event.
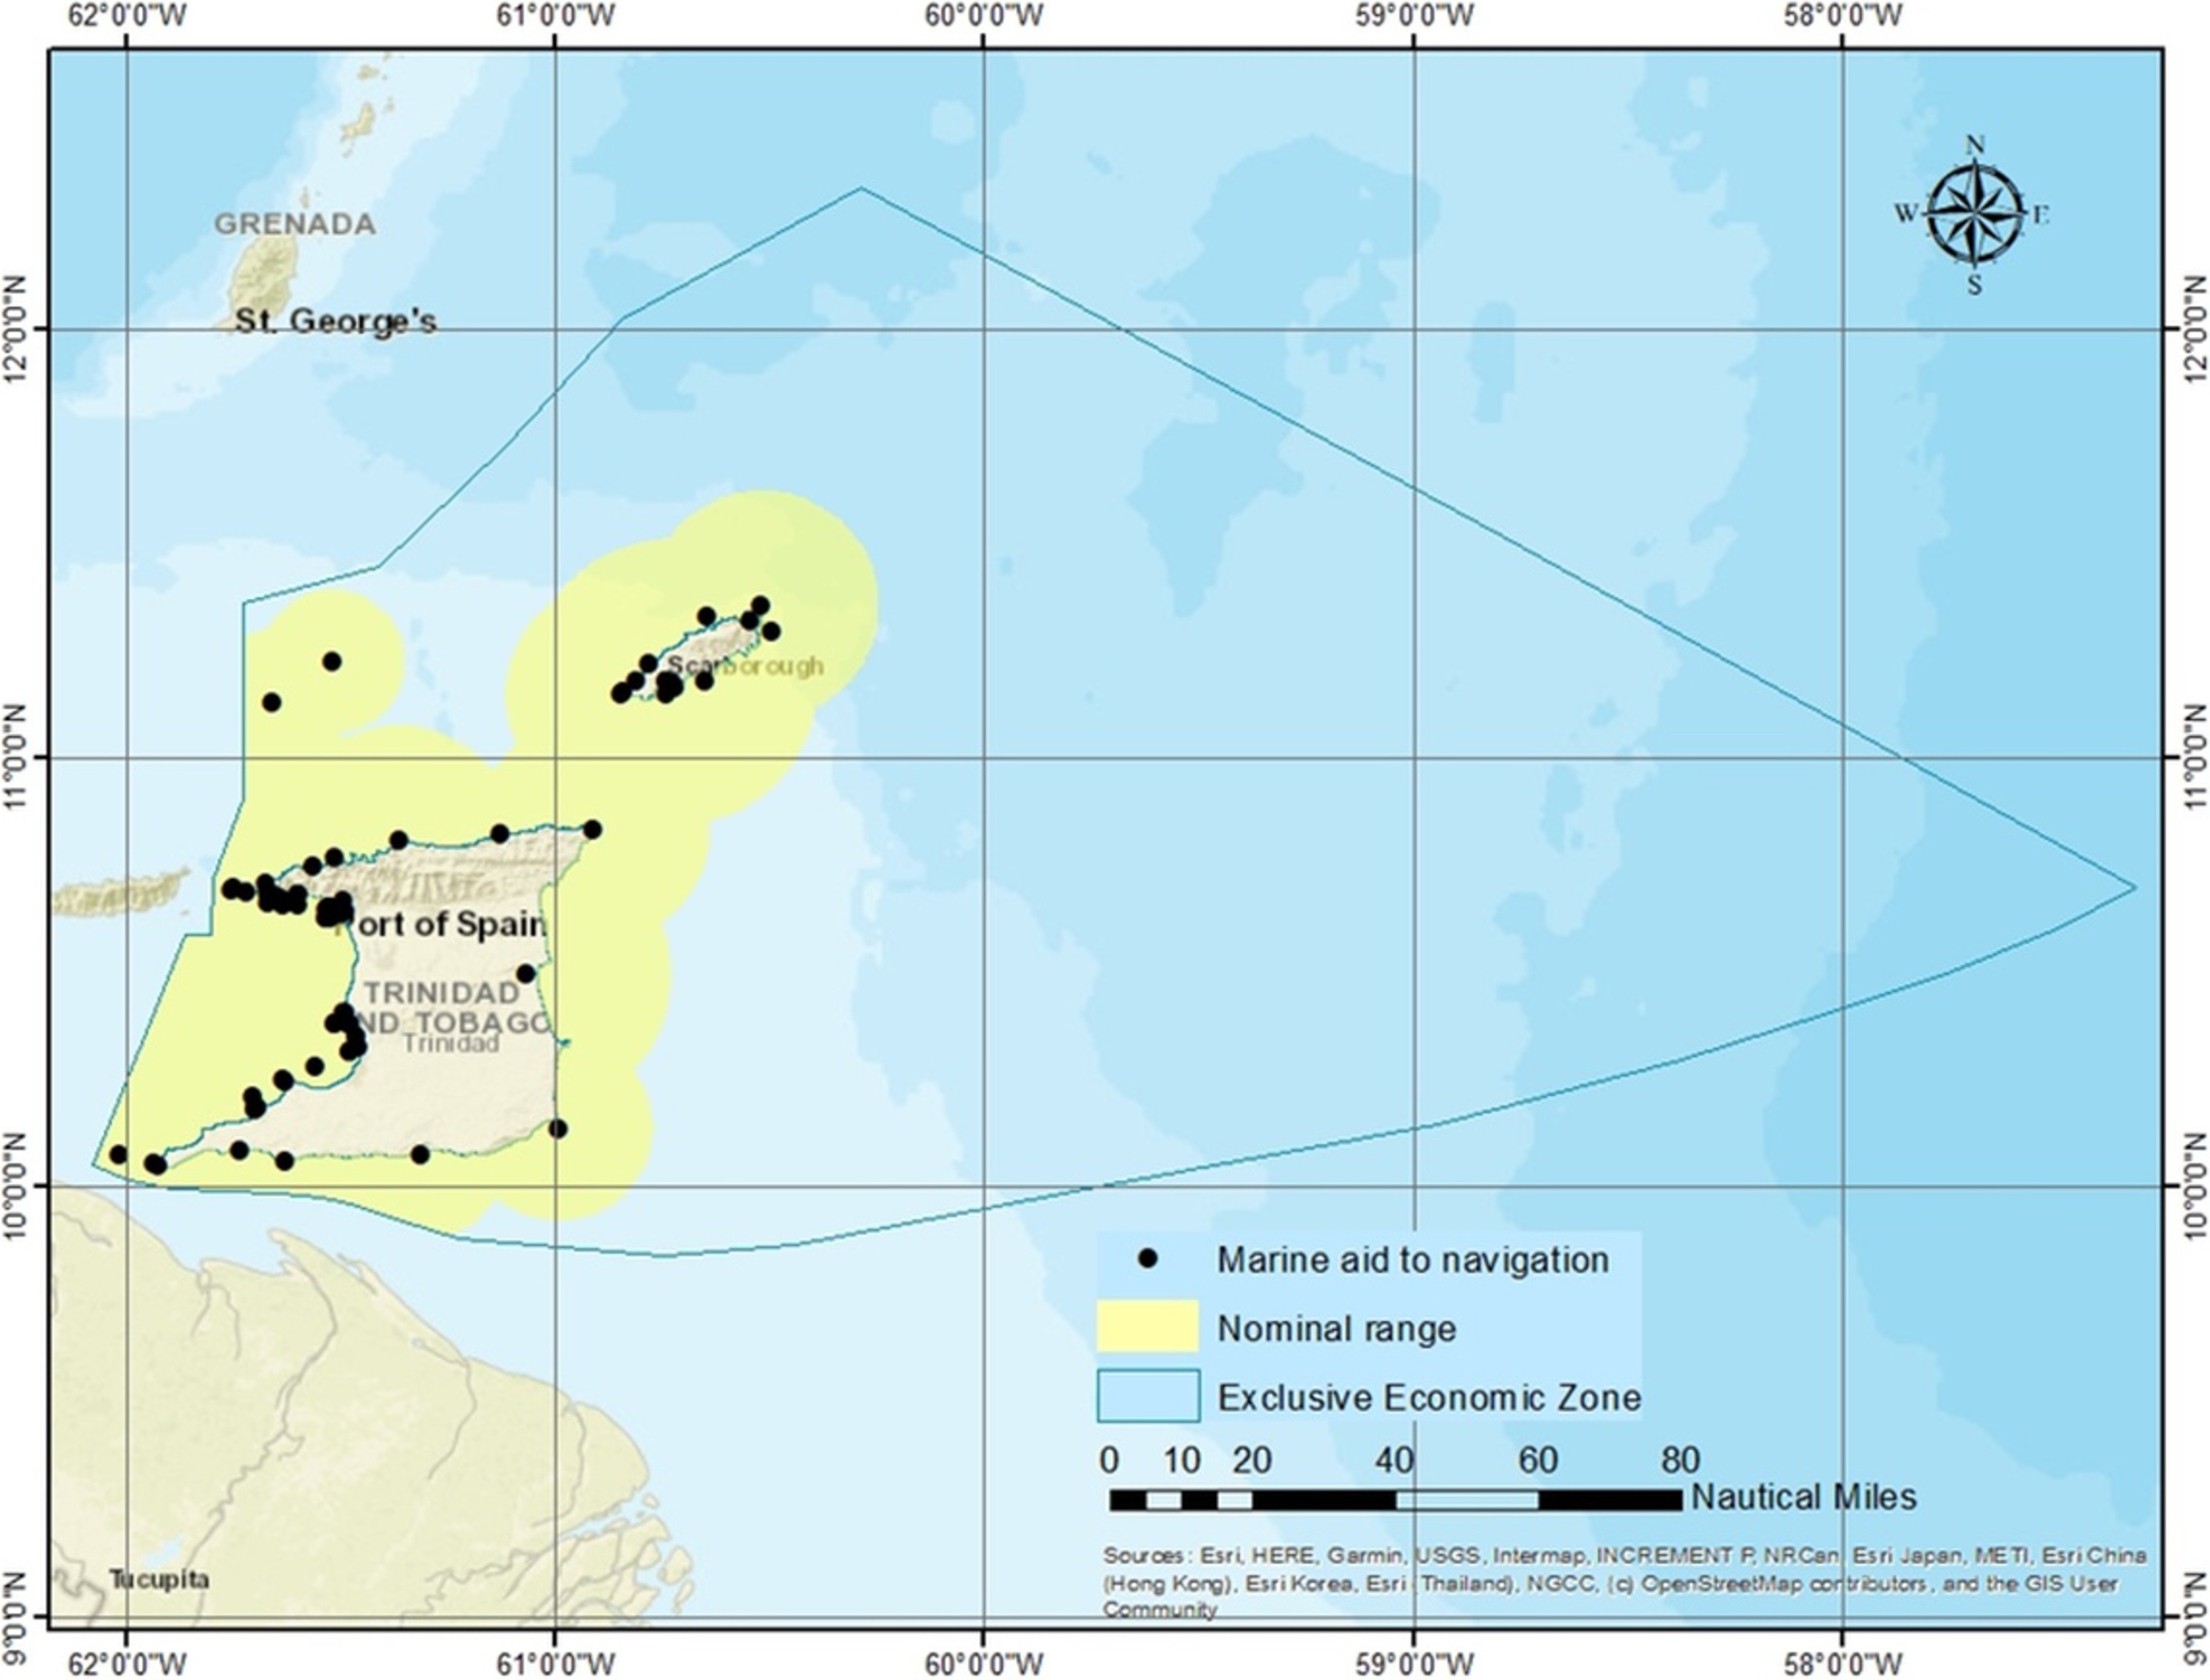
- The probability of Marine Aids to Navigation (AtoN) failure was calculated using IALA standards for Category 1 AtoN, which require 99.8 % availability (equivalent to one day of downtime annually) (IALA, 2004). This results in a failure probability of 0.0027, applied spatially to AtoN nominal ranges (see Fig. 3b) listed in the Pub 110: List of Lights, Radio Aids, and Fog Signals (NGA, 2024).
Except for hazardous sea conditions and the failure of Marine Aids to Navigation (AtoN), all assessed probabilities were applied across the entire EEZ of T and T rather than being confined to specific navigational zones. The figures below illustrate the spatial variation in probability for hazardous sea conditions (Fig. 3a) and areas susceptible to AtoN failure (Fig. 3b). Fig. 3a illustrates the spatial variation in the probability of hazardous sea conditions within T and T’s maritime domain. The probability values are color-coded, with green areas representing very low probabilities and red areas indicating very high probabilities. Notably, hazardous sea conditions are most prominent along the northern nearshore coastlines, where wave energy and meteorological factors contribute to greater risks. These conditions have critical implications for maritime safety, as they increase the likelihood of vessel instability, loss of maneuverability, and failed evasive maneuvers in emergency situations. Fig. 3b depicts the locations of marine aids to navigation (black dots) and their nominal operational ranges (yellow shaded areas) (MOWT, 2024). The yellow zones indicate the spatial extent of navigational aid coverage where necessary to ensure safe passage for vessels operating within these waters, especially in poor visibility conditions.
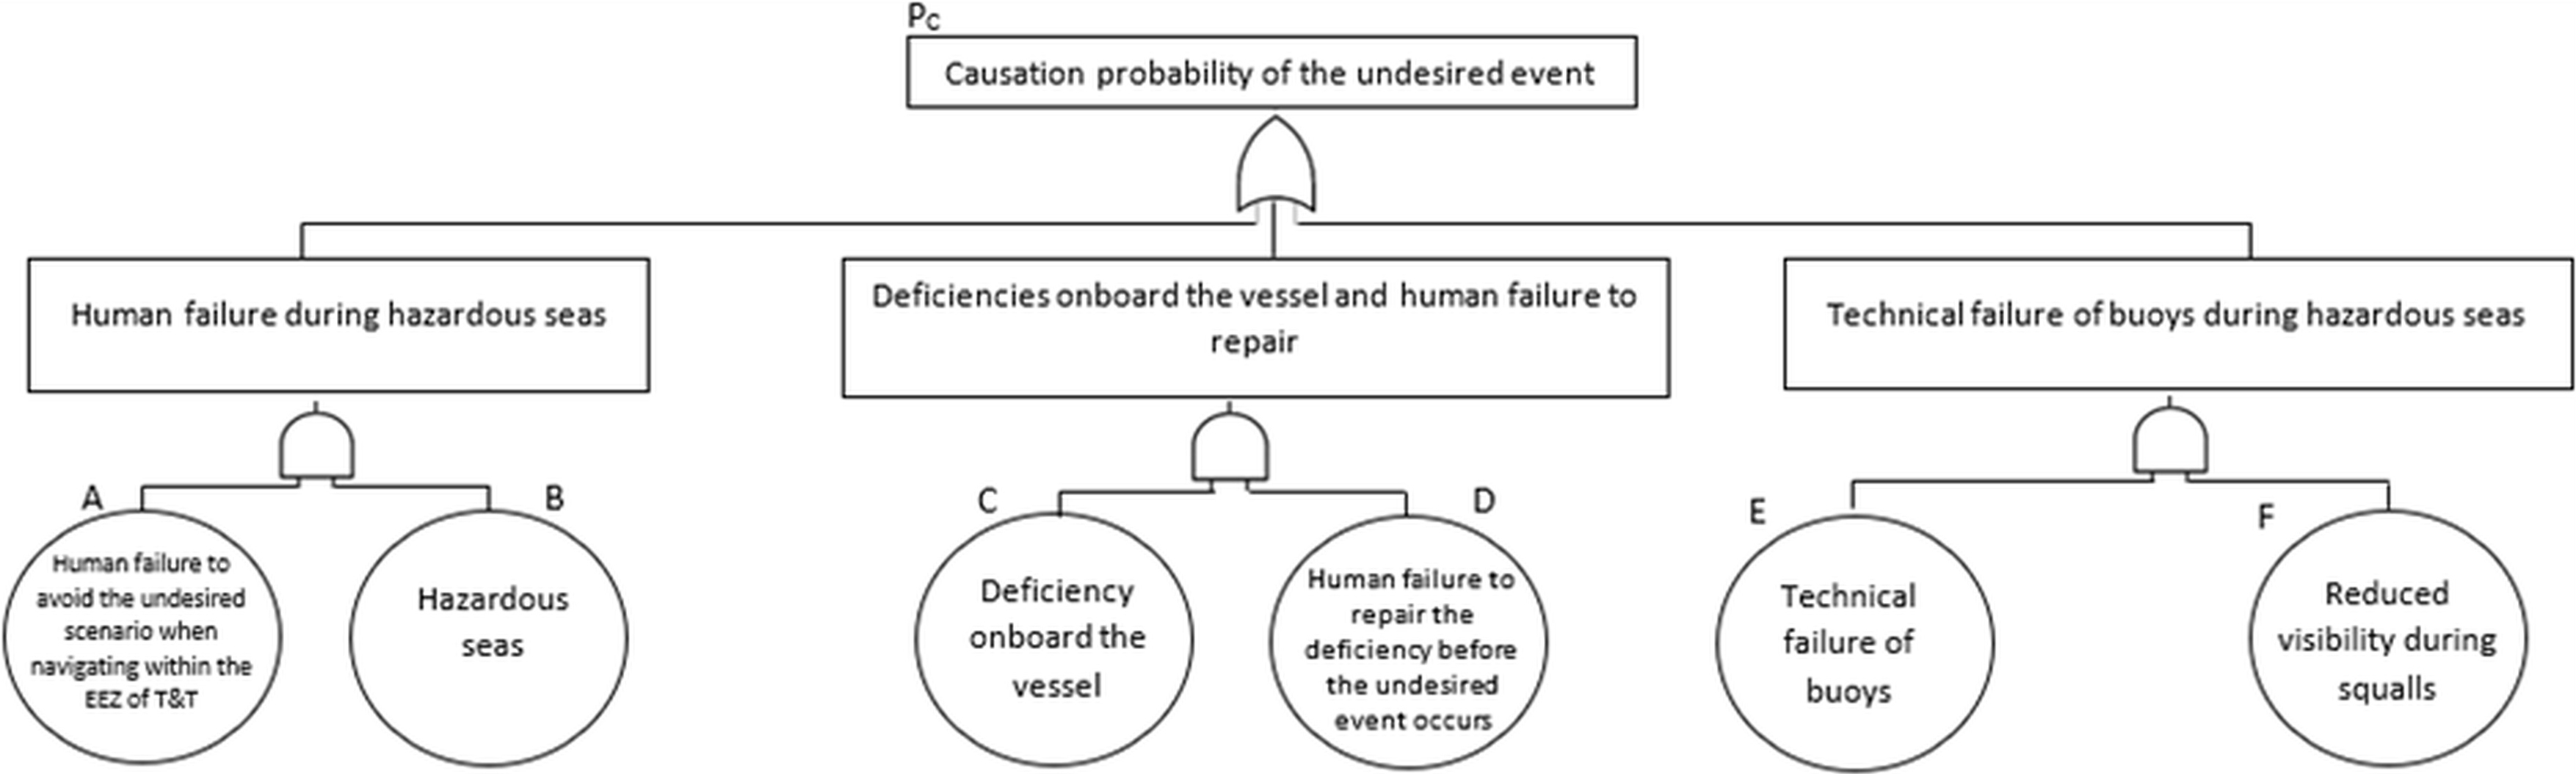
The fault tree shown in Fig. 4 below was modelled after Haugen (1991) and utilised the following Boolean logic to calculate causation probabilities:
| PC = [AB] + [CD] + [EF] | (4) |
3.4 Assumptions
Simulation of the geometric probability of drifting collisions assumed a Poisson distribution for vessel departures, with inter-arrival times generated using exponential sampling. A fixed drift duration of one hour was applied, and circular safety zones were defined with a radius of 480 m (1.6 × vessel length). Overlapping safety zones within the same hourly interval were counted as collision candidates. A uniform spatial resolution of 1 km² and temporal resolution of one hour were used to optimise computational efficiency. The causation probability fault tree assumed independent contributions from human, technical, and environmental failures. Probabilities were based on incident data, IALA publications, and expert estimates. Human and technical risks were uniformly applied, while environmental risks were spatially modelled. These inputs represent a static snapshot; causation probabilities may change over time due to regulatory, technological, or operational shifts.
4 Results
This section presents key findings from the Monte Carlo simulations that estimate the geometric number of drifting collision candidates (NA) and the causation probability (PC) estimated using the FTA.
4.1 The geometric number of drifting collision candidates based on the Monte Carlo approach
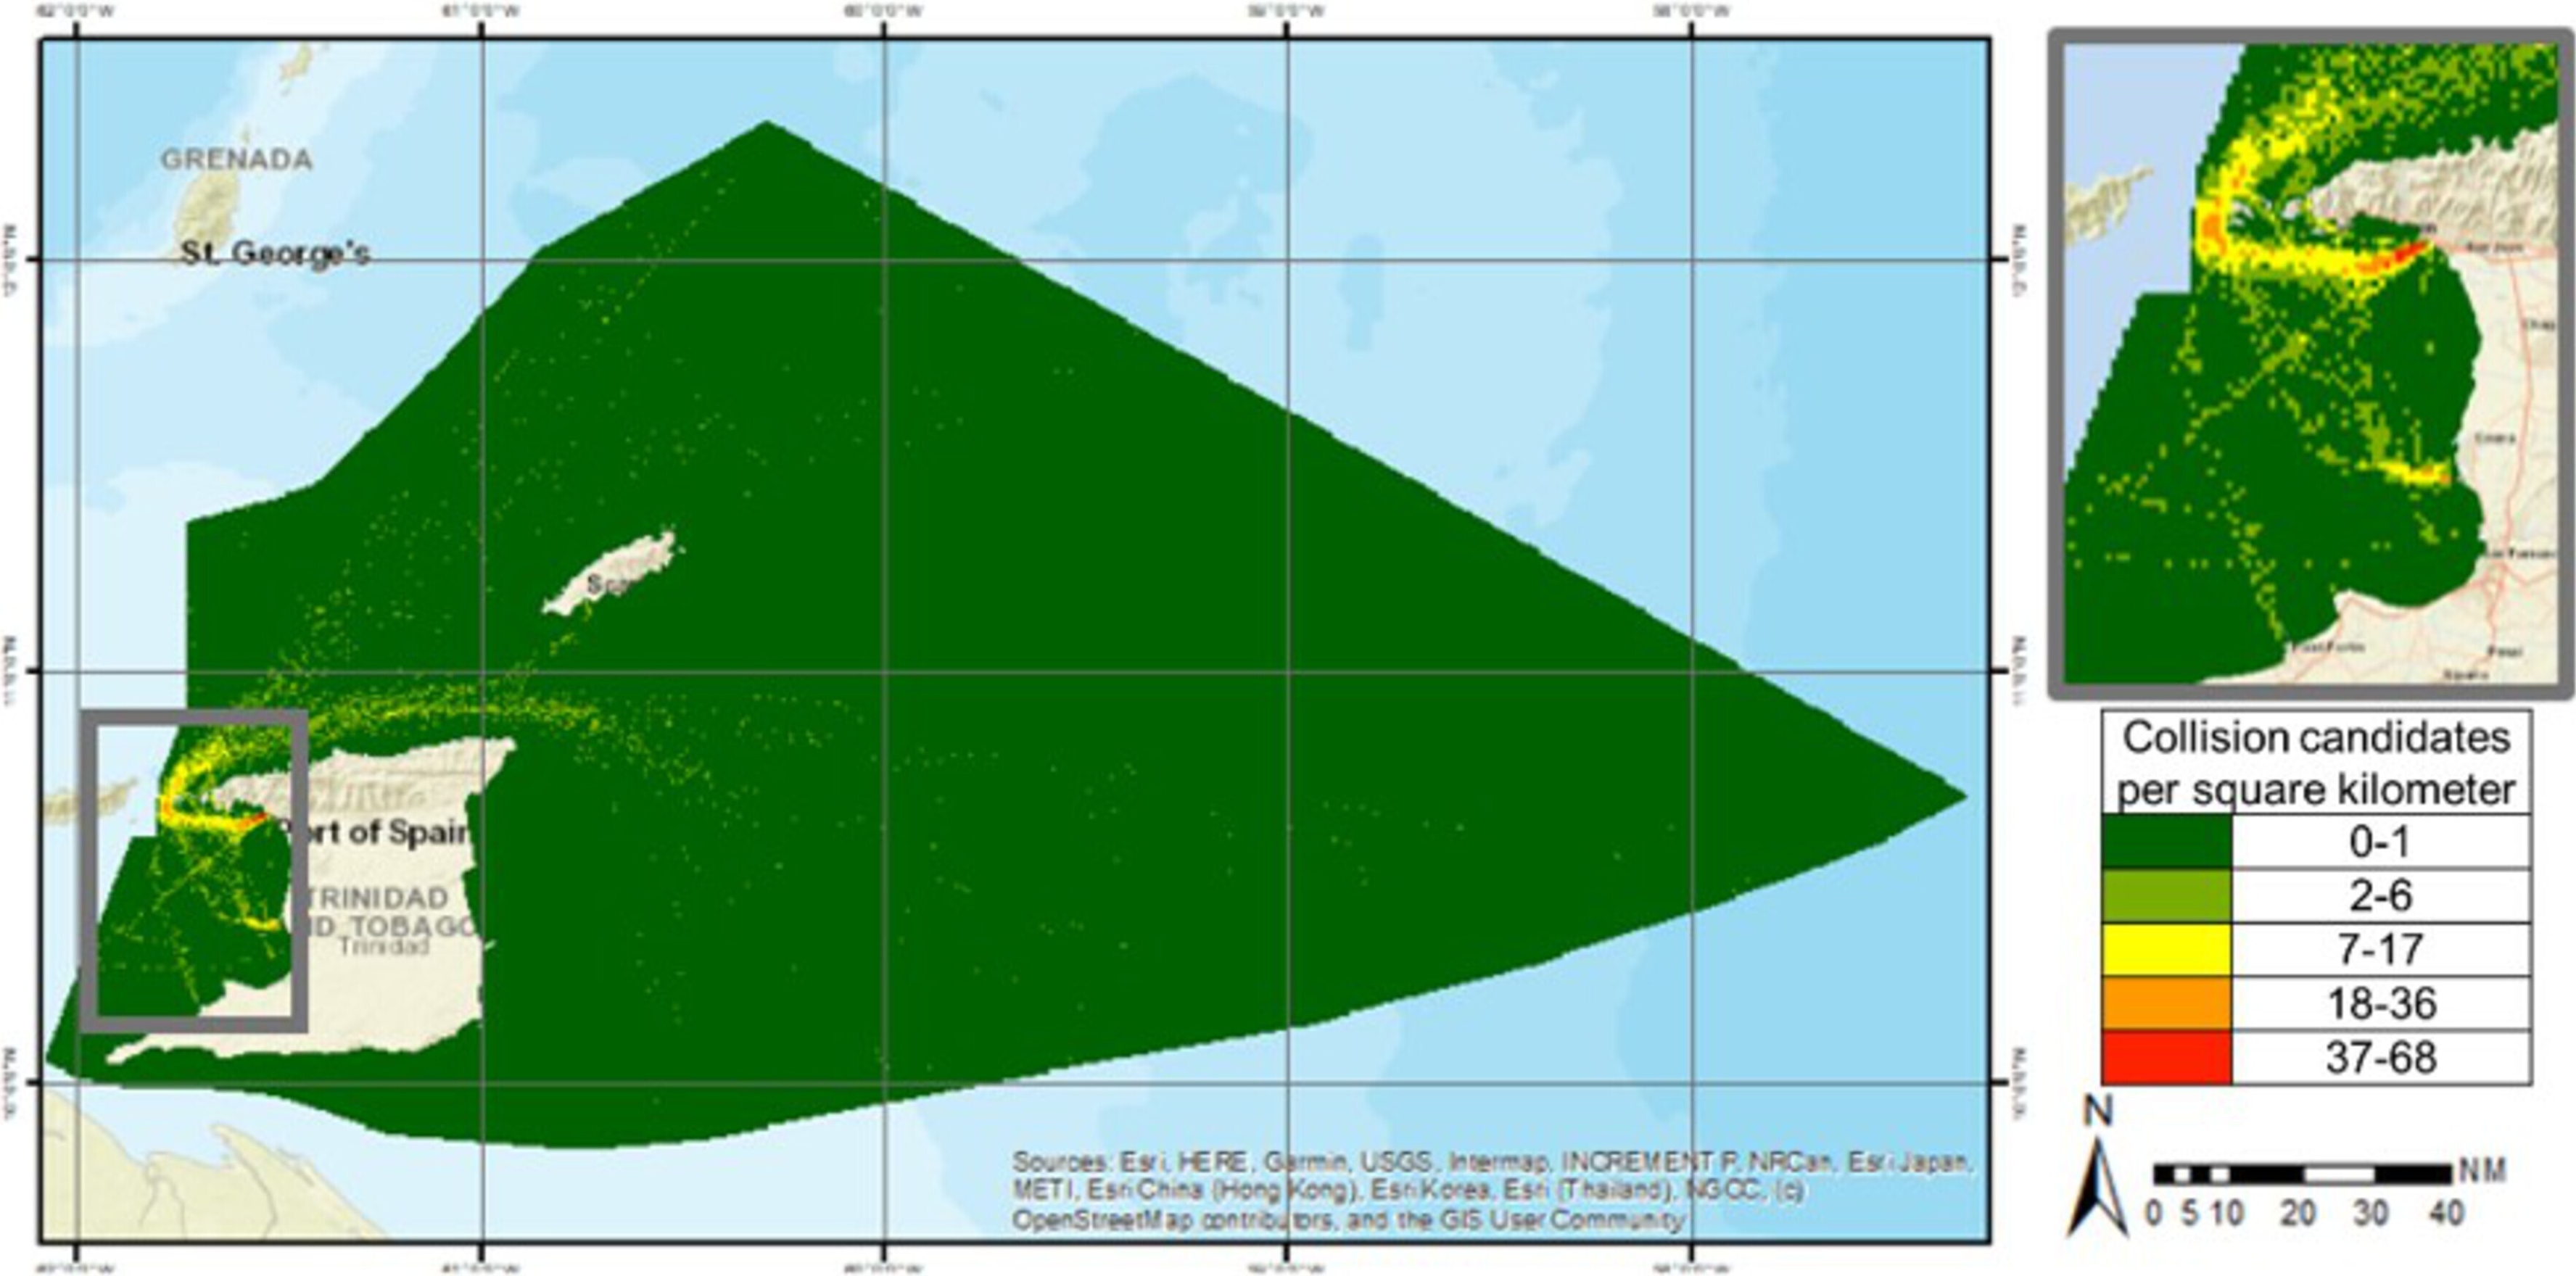
Fig. 5 illustrates the geometric number of annual drifting collision candidates generated using the Monte Carlo simulation approach. The calculation involves counting the number of overlapping safety zones of vessels operating within the same hour, indicating the potential for drifting collision scenarios. An overlap between safety zones indicates that two vessels are operating within a proximity that would not allow sufficient time or space to take evasive action if one were to become disabled and begin drifting, thereby creating a realistic potential for collision. The spatial distribution of overlapping safety zones can support decision-making by identifying where limited safety resources should be prioritised and by informing regulatory measures aimed at preventing drifting collisions in high-risk zones.
4.2 The causation probability based on the fault tree analysis
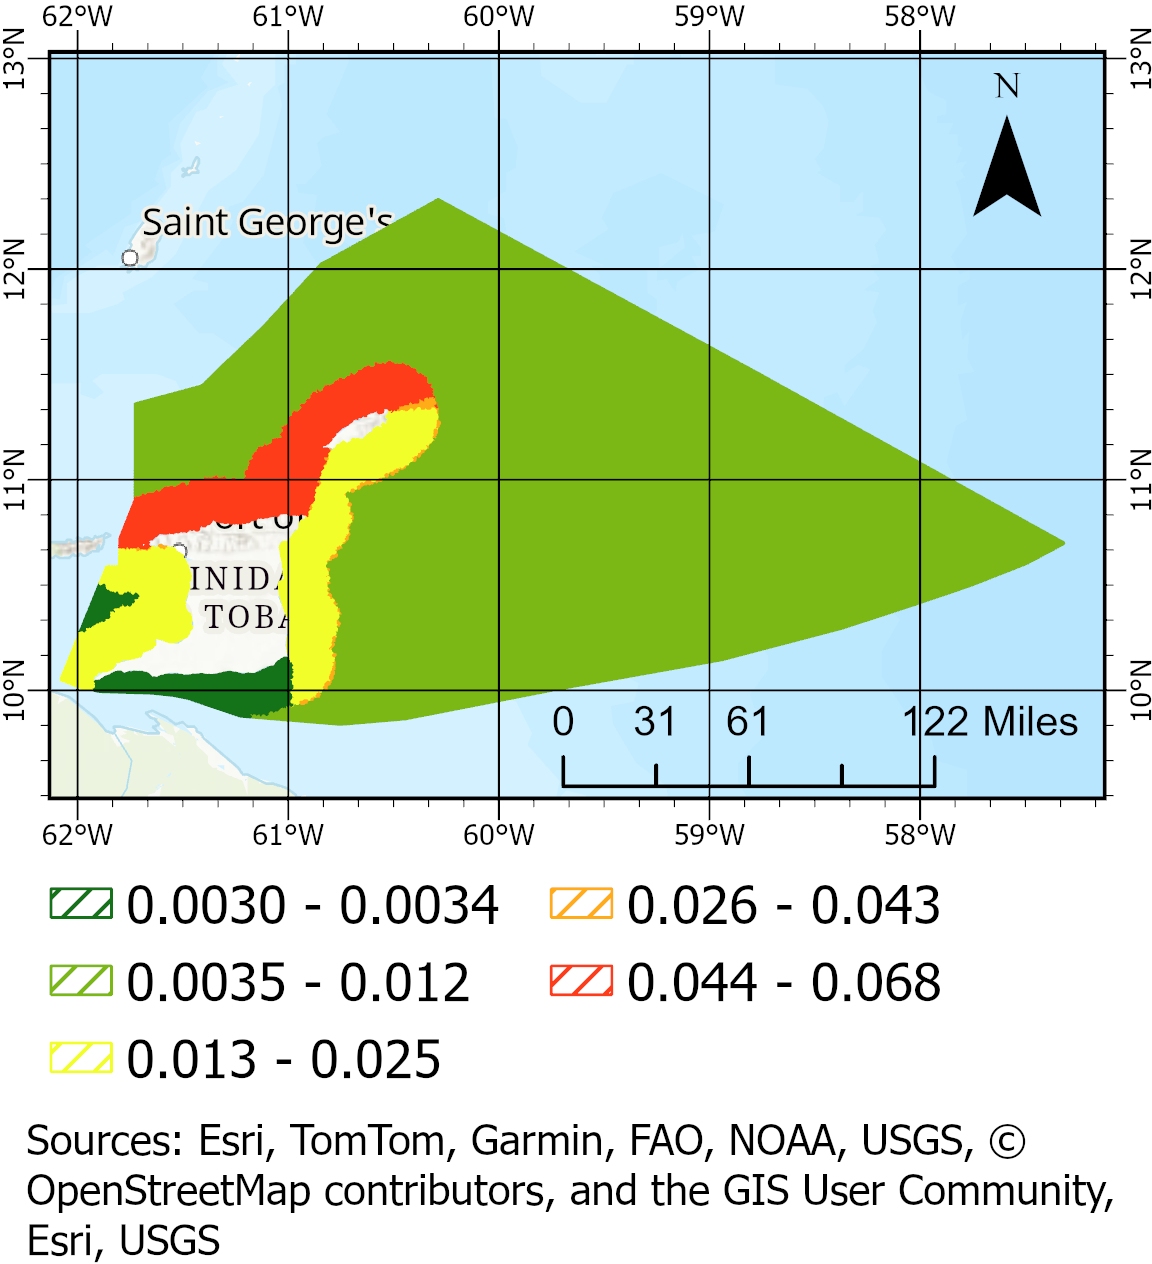
The Monte Carlo simulation and fault tree analysis did not explicitly account for the effectiveness of existing risk control measures such as pilotage and operational procedures. As a result, adjustments to the causation factor values (refer to Fig. 6) were necessary to improve alignment between the modelled probability of drifting collisions and observed historical patterns. Studies have shown that pilotage can reduce incident risk by up to 59 times in areas such as the Great Belt and the Turkish Straits. Using this benchmark, the causation factor was initially reduced by a factor of 59 to reflect the mitigating impact of pilotage in the study area. The effectiveness of local operational procedures has not been explicitly quantified in the literature. To account for these additional controls, a further reduction was applied using a combination of trial and error, expert judgment from individuals familiar with local maritime operations, and calibration based on historical data. This process resulted in a total causation factor reduction of 65 times. This approach of adjusting the causation factor to reflect local conditions and bring model outputs into closer agreement with historical incident data is consistent with the methodology used in IWRAP, a recognized maritime risk assessment tool developed by IALA.
In this study, the causation factor was adjusted with the dual objective of approximating the observed average of 0.6 incidents per year in Trinidad and Tobago’s waters and preserving the relative spatial variation in drifting collision probability, particularly the probability of incidents along the northern and north-western coasts of Trinidad and the waters around Tobago, as supported by historical patterns. While the final modelled output does not precisely match the historical incident frequency, it achieves a reasonable balance between the overall incident probability and the geographic distribution of risk. Table 3 presents the mean probability of drifting collisions across the modelled zones, and Fig. 8 depicts the resulting spatial distribution following adjustment for risk control measures.
4.3 Estimation of the probability of drifting collisions
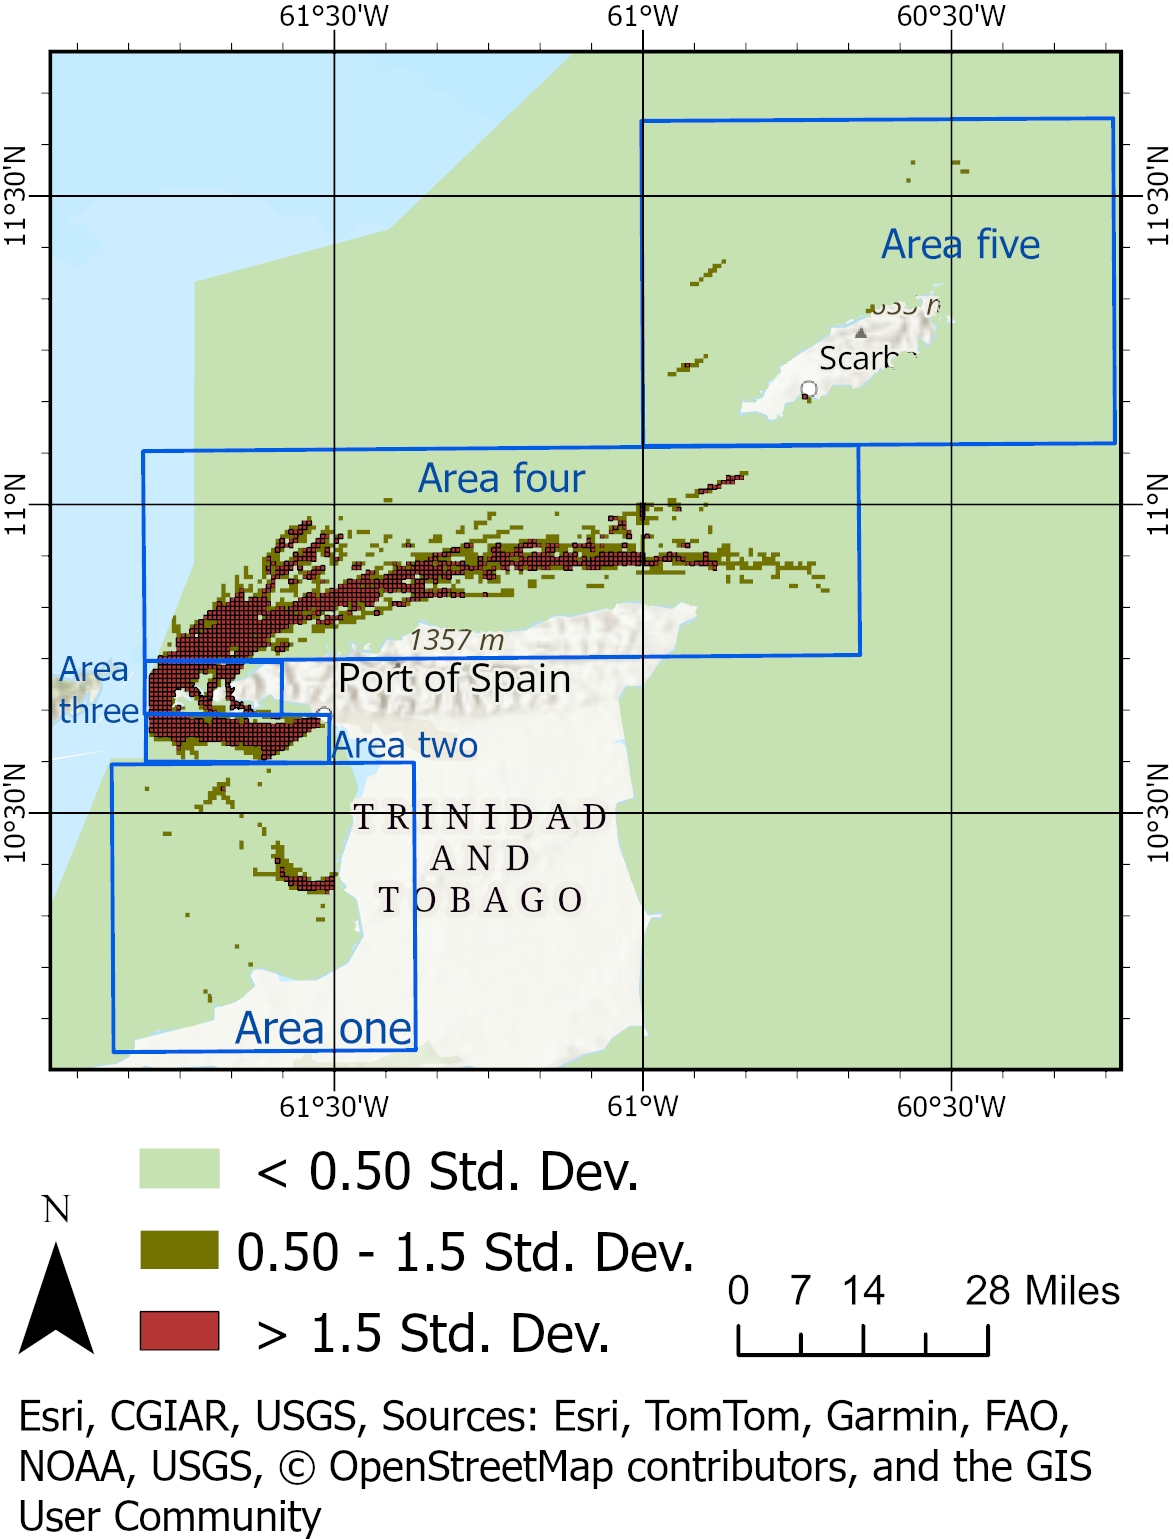
Fig. 7 below illustrates the annual probability of drifting collision candidates, calculated by multiplying the geometric number of drifting collision candidates (refer to Fig. 5) by the causation probability (refer to Fig. 6). The standard deviation data classification method in ArcGIS Pro was used to classify the results, as it highlights deviations from the mean and identifies areas with unusually high or low probabilities of drifting collisions. The mean probability was calculated as 0.014, with areas less than or equal to 0.013853 classified as low probability (≤0.5 standard deviations from the mean). Medium probabilities (0.5 to 1.5 standard deviations) were classified up to 0.03877, while high probabilities (>1.5 standard deviations) reached up to 3.983315. Colour coding was applied to represent these classifications: green indicates probabilities less than 0.5 standard deviations from the mean, orange represents probabilities between 0.5 and 1.5 standard deviations, and red highlights probabilities greater than 1.5 standard deviations. Geographically, the areas around Trinidad marked in red include the northern region, the approach to the Point Lisas port, and an isolated area at approximately 10.5392°N 061.6798°W. Around Tobago, red zones include the approach to the Scarborough port and an isolated area at approximately 11.2254°N 60.9284°W. A large red geographic area, indicating significantly elevated probabilities, is located between Trinidad and Tobago. Orange-coloured zones, representing medium probabilities, surround these high-risk areas, including regions within the Gulf of Paria and several areas north of Tobago.
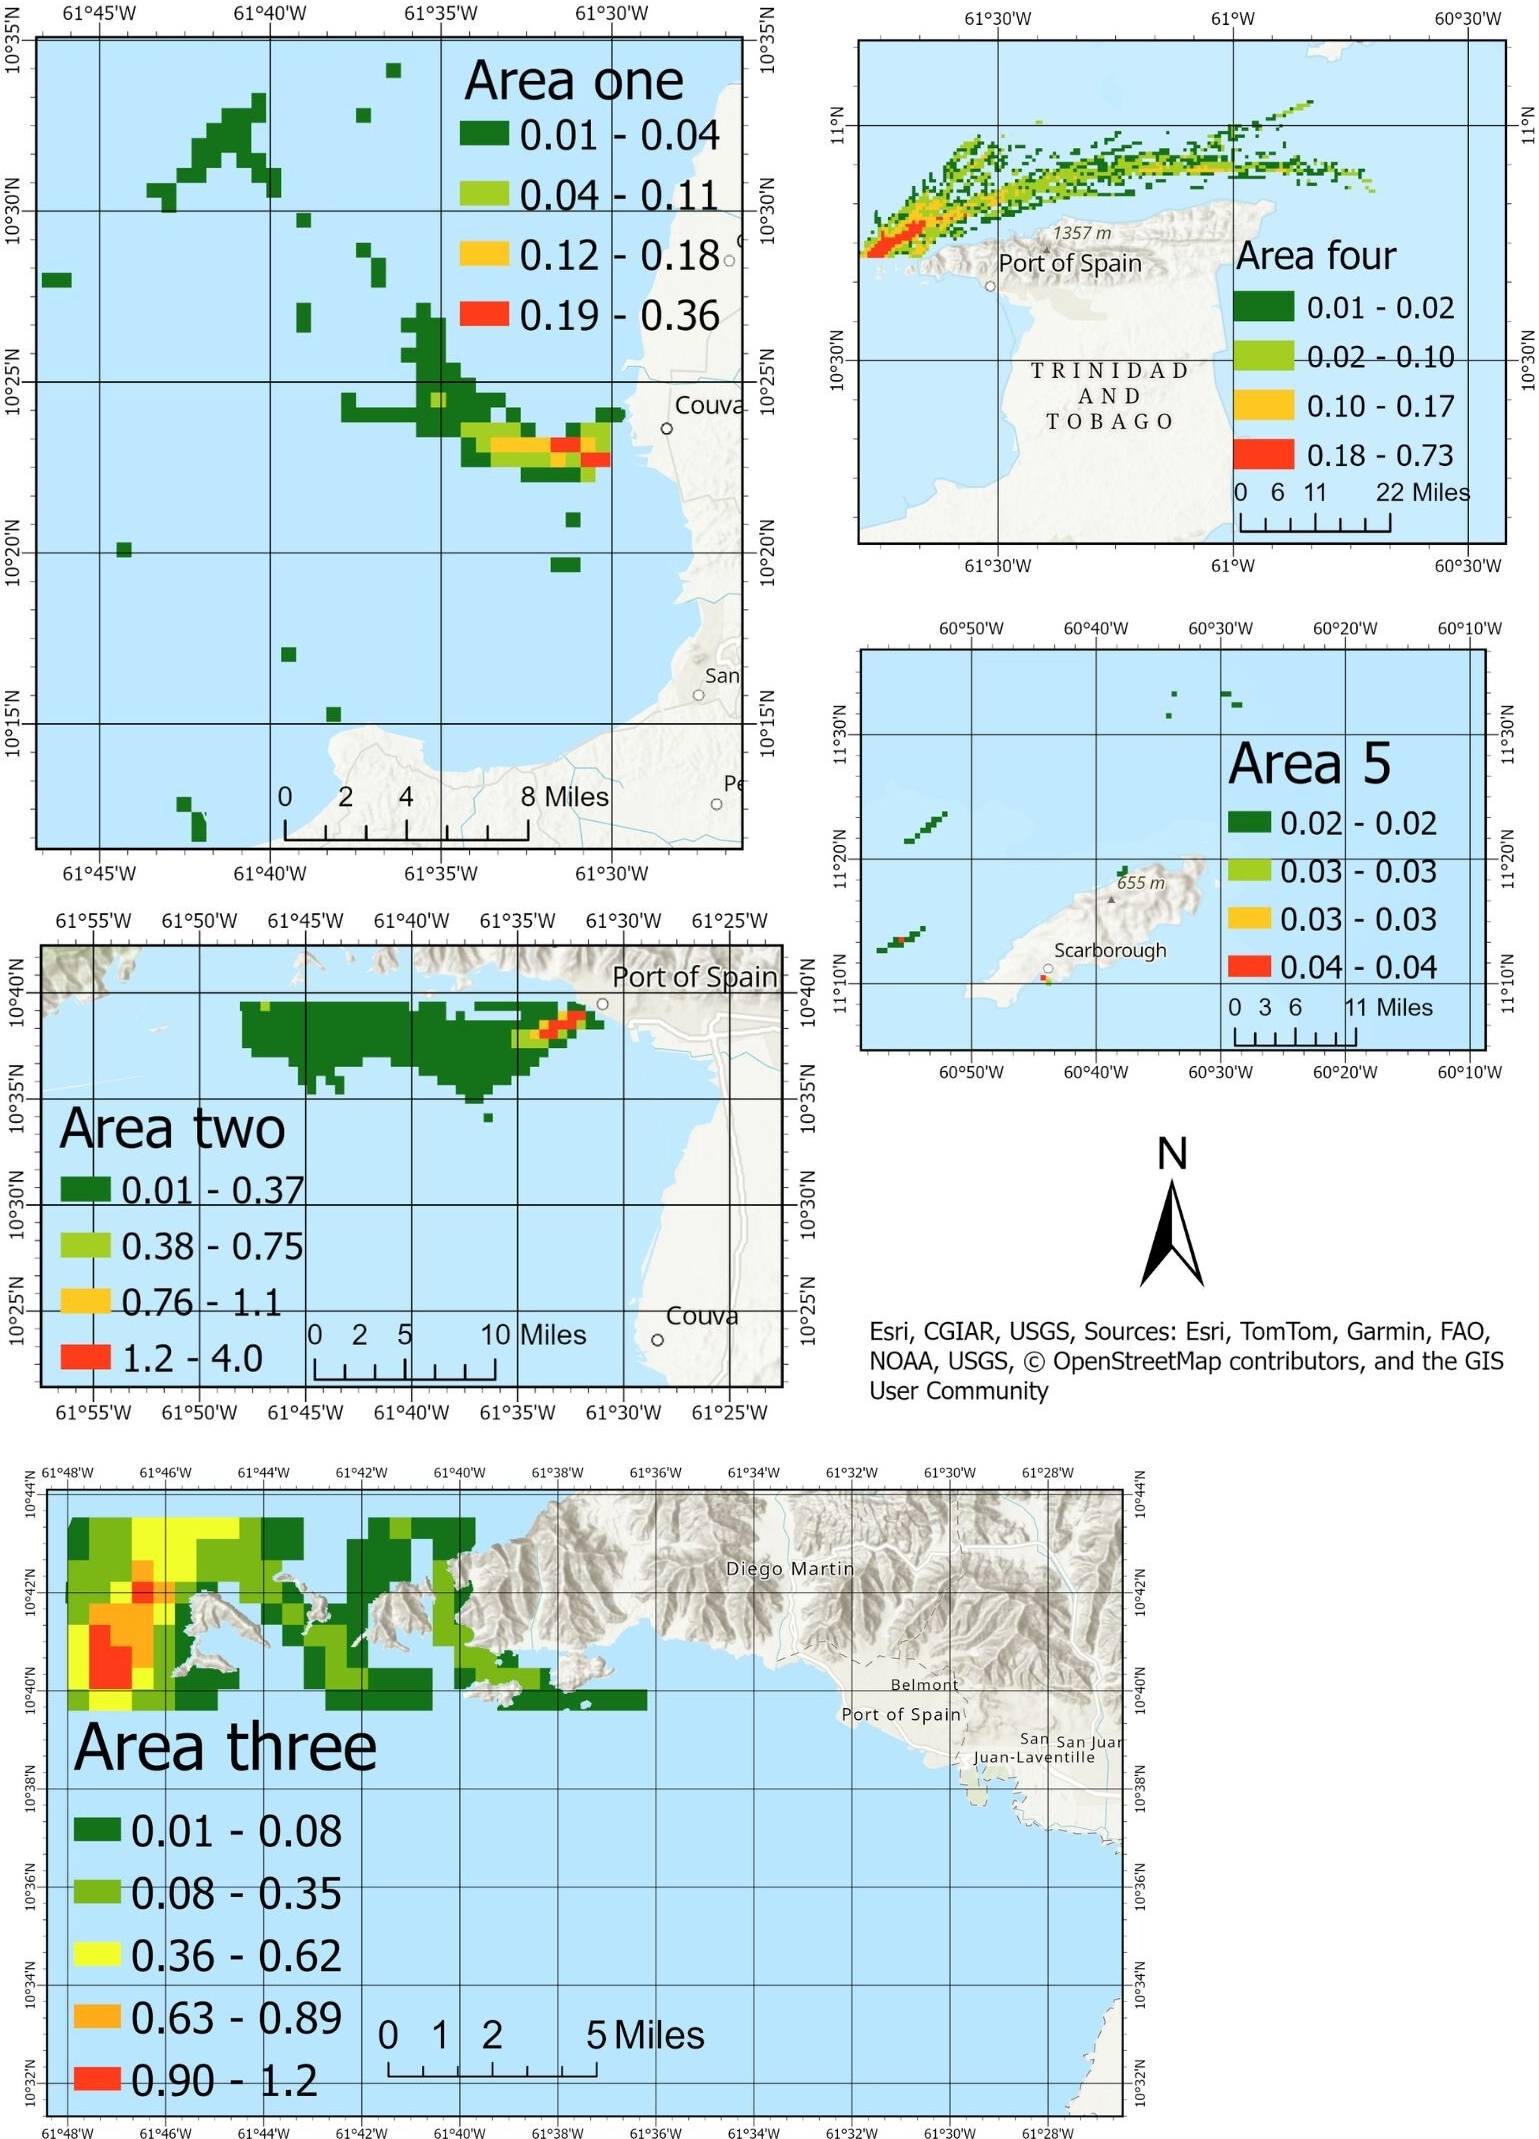
A closer analysis segmented the EEZ into five focus areas, as illustrated in Fig. 8. The data highlights distinct risk profiles across these areas. Area one exhibits generally low probabilities with isolated instances of higher risk. Area two demonstrates the highest variability and overall risk, indicating the need for prioritised risk mitigation strategies. Area three displays stable yet slightly elevated probabilities compared to Area one. Area four shows moderate risks, with distinct pockets of higher probability, while Area five maintains a stable and consistently low-risk profile with minimal variation. To represent the annual drifting collision probabilities for each focus area, the Jenks Natural Breaks classification method was applied. This method ensures an optimised representation of risk distribution by grouping values that are naturally closer together. This method enhances the visual and statistical understanding of spatial risk variations across the EEZ. Table 3 summarises the results of this analysis, providing a comparative overview of the probabilities within each focus area and guiding the prioritisation of risk management efforts. These results support the development of a risk assessment methodology tailored to the specific challenges of SIDS.

4.4 Model validation
To validate the model, simulated traffic patterns were compared with historical traffic data, areas with relatively high probabilities of incidents were compared with those identified by IWRAP, and the overall probability of incidents was compared with historical incident records. The spatial distribution of simulated vessel traffic, generated using Monte Carlo techniques and Poisson-distributed departure times, was visually compared to annual traffic density maps from the MarineTraffic platform. This comparison confirmed that the simulated traffic patterns closely mirrored observed vessel behaviour, particularly along key corridors, port approaches, and turning zones. The visual alignment provided confidence that the simulated vessel activity realistically reflected operational conditions within Trinidad and Tobago’s maritime domain. The spatial distribution of drifting collision probabilities was compared with results obtained from IWRAP, a recognised maritime risk assessment tool used to assess navigational risk within the Gulf of Paria (Seepersad et al., 2020). While IWRAP does not directly simulate drifting collisions as defined in this study, the general patterns of high-risk areas identified by both models were consistent. A comparative review of areas one and two, as shown in Fig. 8, alongside the IWRAP results, highlights notable correlations. Area one corresponds to turning zones within the Gulf of Paria and port approaches along the central to southern coastline. Similarly, area two aligns with port approaches along the north-western coastline. These similarities suggest consistency between the model’s outputs and established risk patterns identified by IWRAP.
In terms of historical incident alignment, the literature review and incident records indicate that drifting collisions in Trinidad and Tobago have most frequently occurred along the northern and north-western coastlines of Trinidad, as well as the western, northern, and south-eastern coastlines of Tobago. Notably, the available records do not specify drifting collisions within the Gulf of Paria, except for the northern and north-western areas. However, both this model and the IWRAP results identify the Gulf of Paria as an area of elevated risk. Drifting incidents along the south-eastern coastline of Tobago often involved deep-sea fishing vessels or migrant boats, both of which may lack AIS transponders or deliberately disable them. These characteristics help explain why the modelled results shown in Fig. 8 did not detect incidents in that area, as the simulation relies on observable or estimable traffic patterns. Further analysis of Fig. 8 revealed that area four shows an increased probability of drifting collisions near Tobago’s western coastline, while area five exhibits lower but non-negligible risk in the waters north of Tobago, with a notable hotspot near the Port of Scarborough.
Although the model outputs were consistent with known high-risk zones and the general historical incident frequency of approximately 0.6 per year, formal statistical validation techniques such as confidence intervals, error margins, or residual analyses were not applied. This limitation stems from the lack of detailed, georeferenced incident datasets. Future enhancements to the model should incorporate such data, allowing for the use of statistical performance metrics to quantify model accuracy and uncertainty.
5 Discussion
This study addressed a critical gap in maritime risk assessment for SIDS, where limited resources often constrained the adoption of traditional resource-intensive methods. By integrating publicly available data, structured modelling techniques, and geospatial tools, the proposed methodology offered a practical and scalable solution for evaluating maritime risks. Its adaptability to resource-limited contexts ensured alignment with international obligations under frameworks such as SOLAS, MARPOL, and UNCLOS, making it highly relevant to coastal States facing similar challenges.
A notable strength of the methodology lies in its innovative use of alternative datasets, including open-source traffic patterns and historical port call logs, to supplement limited AIS data. This approach aligned with established probabilistic modelling efforts (Przywarty, 2008; Goerlandt & Kujala, 2011), while prioritising accessibility and cost-effectiveness. Furthermore, the integration of Monte Carlo simulations and FTA enhanced the robustness of risk estimation by accounting for probabilistic vessel encounters and causation probabilities. The use of FTA, successfully applied in aerospace and maritime contexts (NASA, 2002; Haugen & Kristiansen, 2023), ensured methodological reliability while maintaining computational feasibility for SIDS.
Another strength of the model lies in its balance between granularity and practicality. While the model did not simulate highly specific or overly precise results, this was an intentional design choice to prioritise robust risk assessment over predictive precision. Attempting to simulate outcomes with excessive specificity risks introducing errors or overreliance on uncertain data, which could misinform mitigation efforts and resource allocation priorities. Instead, the model focused on identifying broad areas of concern and prioritising risk factors, ensuring that recommendations were actionable, value-laden, and resilient to data uncertainties. This approach underscores the importance of a risk assessment framework that guides mitigation efforts without creating a false sense of precision.
The findings also demonstrated the capability of the methodology to replicate real-world traffic patterns, as evidenced by the alignment between simulated and AIS-derived traffic densities. The safety zone mapping results effectively identified high-risk areas, providing actionable insights for resource allocation and risk mitigation strategies.
Despite its contributions, this study faced several limitations. The model did not fully account for dynamic environmental factors such as meteorological conditions and water currents, which could significantly influence vessel drift and collision probabilities. Future enhancements could incorporate finer-scale hydrodynamic data or employ Bayesian networks for more nuanced analyses. Additionally, the framework specifically targeted drifting collisions, which limited its scope. Expanding the methodology to include other maritime risks, such as groundings or allisions, would enable a more comprehensive assessment of maritime safety. A hydrographic (bathymetry, floor characteristics, tides, etc.) analysis could provide valuable information about grounding avoidance and grounding mitigation.
The simulation assumed existing traffic patterns as the starting point, which may have underestimated overall traffic volumes and, consequently, the number of drifting collisions. This highlights the importance of incorporating dynamic initial traffic conditions in future studies. Furthermore, several simplifying assumptions were made to balance computational efficiency with accuracy, such as constant vessel speeds, omission of ship turning radii, and reliance on the Poisson process for simulating departure times without accounting for seasonal variations. While these simplifications were justified within the study’s scope, future research could address them by utilising more detailed data and computational resources.
6 Conclusion
This study developed a resource-efficient methodology for maritime risk assessment tailored to the unique challenges of SIDS. By integrating publicly available data with probabilistic modelling techniques, it provided actionable insights into the spatial variability of risk across the study area, enabling prioritisation of resources to reduce maritime risks. The approach successfully balanced granularity and practicality, focusing on broad risk patterns without over-reliance on precise yet uncertain data. Comparisons with established models, such as IWRAP, validated its robustness, while its flexibility ensures adaptability to other contexts.
Although limitations remain, including simplified assumptions and the exclusion of dynamic environmental factors, the framework offers a scalable foundation for maritime safety management. Future integration of probability values with economic consequence estimates could further enhance decision-making, providing policymakers with interpretable and impactful tools for resource allocation and risk mitigation. This study demonstrates that robust maritime risk assessments can be achieved in resource-constrained environments, advancing the field of maritime safety management.
7 Future works
Future work could extend this study by incorporating an economic valuation of consequences, where probability values are multiplied by potential consequences expressed as dollar values. This approach would enable the calculation of risk per unit area, combining probability and consequence to produce actionable and interpretable risk maps. Addressing the limitations presented in 5.1 could also improve the value of this methodology.
References
Bogalecka, M. and Dabrowska, E. (2023). Monte Carlo simulation approach to shipping accidents consequences assessment. Water, 15(10). https://www.mdpi.com/2073-4441/15/10/1824 (last accessed 20 January 2025).
CMoU (2020). Annual Report 2020. Caribbean Memorandum of Understanding on Port State Control, Kingston, Jamaica. https://www.caribbeanmou.org/sites/default/files/annual_report_2020.pdf (last accessed 30 January 2025).
CMoU (2024). Publications. Caribbean Memorandum of Understanding on Port State Control, Kingston, Jamaica. https://caribbeanmou.org/content/publications (last accessed 30 September 2024).
CSA (2024). Initiatives on Port Efficiency and Sustainability. Caribbean Shipping Association, Kingston, Jamaica. https://www.caribbeanshipping.org/ (last accessed 30 January 2025).
Fujii, K. T. Y. (1971). Traffic capacity. The Journal of Navigation, 27(4), pp. 543–552, https://doi.org/10.1017/S0373463300022384
Goerlandt, F. and Kujala, P. (2010). Modelling of ship collision probability using dynamic traffic simulation. In B. J. M. Ale, I. A. Papazoglou and E. Zio (Eds.), Reliability, Risk and Safety (pp.40–447). Taylor and Francis Group, London. https://www.researchgate.net/publication/286541864 (last accessed 20 January 2025).
Haugen, S. (1991). Probabilistic evaluation of frequency of collision between ships and offshore platforms. [Doctoral dissertation, University of Trondheim].
Haugen, S. and Kristiansen, S. (2023). Maritime Transportation: Safety Management and Risk Analysis. CRC Press, Kindle edition, p. 217.
IALA (2004). Categorisation and Availability Objectives for Short Range Aids to Navigation (R0130, 3.1 ed.) International Association of Marine Aids to Navigation and Lighthouse, Staint Germain en Laye, France. https://www.iala.int/product/r0130/ (last accessed 20 May 2024).
IALA (2009). Causation Probability Modelling. https://www.iala.int/wiki/iwrap/index.php/Causation_Probability_Modelling (last accessed 20 January 2025).
IALA (2022a). The Use of IALA Waterway Risk Assessment Programme (G1123, 2.1 ed.). International Association of Marine Aids to Navigation and Lighthouse, Staint Germain en Laye, France. https://www.iala.int/product/g1123/ (last accessed 20 January 2025).
IALA (2022b). The Use of Ports and Waterways Safety Assessment (G1124, 2.1 ed.). International Association of Marine Aids to Navigation and Lighthouse, Staint Germain en Laye, France. https://www.iala.int/product/g1124/ (last accessed 20 January 2025).
IALA (2022c). The Use of the Simplified IALA Risk Assessment Method (G1138, 2.0 ed.). International Association of Marine Aids to Navigation and Lighthouse, Staint Germain en Laye, France. https://www.iala.int/product/g1138/ (last accessed 20 January 2025).
IALA (2024). Aids to Navigation Manager Training Level 1 – Use of the IALA Risk Management Tools (C1003, 3.0 ed.). International Association of Marine Aids to Navigation and Lighthouse, Staint Germain en Laye, France. https://www.iala.int/product/c1003/ (last accessed 30 January 2025).
IALA (2025). Review of the Risk Management Tools – Global Survey. International Association of Marine Aids to Navigation and Lighthouse, Staint Germain en Laye, France.
IMO (1973). International Convention for the Prevention of Pollution from Ships (MARPOL). International Maritime Organization, London, United Kingdom. https://www.imo.org/en/about/Conventions/Pages/International-Convention-for-the-Prevention-of-Pollution-from-Ships-(MARPOL).aspx (last accessed 30 January 2025).
IMO (1974). International Convention for the Safety of Life at Sea (SOLAS). International Maritime Organization, London, United Kingdom. https://www.imo.org/en/About/Conventions/Pages/International-Convention-for-the-Safety-of-Life-at-Sea-(SOLAS),-1974.aspx (last accessed 30 January 2025).
IMO (1978). International Convention on Standards of Training, Certification and Watchkeeping for Seafarers (STCW). International Maritime Organization, London, United Kingdom. https://www.imo.org/en/OurWork/HumanElement/Pages/STCW-Convention.aspx (last accessed 30 January 2025).
IMO (2010). Global Integrated Shipping Information System (GISIS) (Incident record: C0008290). International Maritime Organization, London, United Kingdom. https://gisis.imo.org/Public/MCIR/Occurrence.aspx?Reference=C0008290 (last accessed 30 January 2025).
IMO (2024). Global Integrated Shipping Information System (GISIS) (Incident record: C1000310). International Maritime Organization, London, United Kingdom.
https://gisis.imo.org/Public/MCIR/Occurrence.aspx?Reference=C1000310 (last accessed 30 January 2025).
IMO (2025). Oil pollution: prevention and response. International Maritime Organization, London, United Kingdom. https://www.imo.org/en/OurWork/Environment/Pages/OilPollution-Default.aspx (last accessed 20 January 2025).
IMPA (2022, November 1). Maritime pilots and pilotage: Our commitment to safety, pollution prevention and environmental sustainability. IMO Seminar, International Maritime Pilots’ Association, London, United Kingdom. https://www.impahq.org/sites/default/files/content-files/20220916-IMPA%20IMO%20Seminar%202022-FINAL.pdf (last accessed 20 January 2025).
ITOPF (2025). Atlantic Empress, West Indies, 1979. ITOPF Ltd, London, United Kingdom. https://www.itopf.org/in-action/case-studies/atlantic-empress-west-indies-1979/ (last accessed 30 January 2025).
Kirwan, B. (1994). A guide to practical human reliability assessment (1st ed.). CRC Press. https://doi.org/10.1201/9781315136349
Loop News Caribbean (2024). Rough seas affecting coastlines across the Caribbean. https://www.loopnews.com/content/rough-seas-affecting-coastlines-across-the-caribbean/ (last accessed 30 January 2025).
MacDuff, T. (1974). The probability of vessel collisions. Ocean Industry, 9(9). https://trid.trb.org/View/26999 (last accessed 20 January 2025).
MarineTraffic (2025). AIS vessel tracking map. Kpler Holding SA, Brussels, Belgien. https://www.marinetraffic.com/en/ais/home/centerx:-60.2/centery:10.2/zoom:8 (last accessed 30 January 2025).
MARIN (n.d.). SAMSON: Safety assessment models for shipping and offshore in the North Sea. Maritime Research Institute Netherlands, Wageningen, The Netherlands. https://www.marin.nl/en/about/facilities-and-tools/software/samson (last accessed 20 January 2025).
MEEA (2013). The National Oil Spill Contingency Plan of Trinidad and Tobago. Ministry of Energy and Energy Affairs, Government of the Republic of Trinidad and Tobago, Port of Spain, Republic of Trinidad and Tobago.
MOWT (2024). Aids to Navigation Operational Plan for All Areas. Maritime Services Division, Ministry of Works and Transport, Government of the Republic of Trinidad and Tobago, Port of Spain, Republic of Trinidad and Tobago.
https://www.mowt.gov.tt/MOWT/media/General/Documents/Maritime%20Forms/Navigational%20Plan/Maritime-Services-Division-Aids-to-Navigation-Operational-Plan-for-all-areas.pdf (last accessed 30 January 2025).
Muñoz, S. and Ötker, I. (2018). Building resilience to natural disasters in the Caribbean requires greater preparedness. International Monetary Fund, Washington, D.C., USA. https://www.imf.org/en/News/Articles/2018/12/07/NA120718-Building-Resilience-to-Natural-Disasters-in-Caribbean-Requires-Greater-Preparedness (last accessed 2 April 2025).
NGA (2024). List of Lights, Radio Aids, and Fog Signals (Publication number 110). Maritime Safety Office, National Geospatial-Intelligence Agency, Springfield, USA. https://msi.nga.mil/api/publications/download?key=16694312/SFH00000/NIMA_LOL/Pub110/Pub110bk.pdf&type=view (last accessed 27 March 2025).
NASA (2002). Fault Tree Handbook with Aerospace Applications (1.1 ed.). NASA Office of Safety and Mission Assurance, National Aeronautics and Space Administration, Washington, D.C., USA. https://www.mwftr.com/CS2/Fault%20Tree%20Handbook_NASA.pdf (last accessed 20 January 2025).
Przywarty, M. (2008). Probabilistic model of ships’ navigational safety assessment on large sea areas. Proceedings of the 16th International Symposium on Electronics in Transport, Ljubljana, Slovenia. https://www.researchgate.net/publication/387019707_Probabilistic_model_of_ships_navigational_safety
_assessment_on_large_sea_areas (last accessed 20 January 2025).
Rambarran, T. (2021). Correspondence on vessel incidents [unpublished]. Maritime Services Division, Ministry of Works and Transport, Government of the Republic of Trinidad and Tobago, Port of Spain, Republic of Trinidad and Tobago.
Riding, J. and Rawson, A. (2015). LINZ Hydrography Risk Assessment Methodology Update (report number 15NZ322, issue 03). Land Information New Zealand (LINZ), Wellington, New Zealand. https://iho.int/uploads/user/Inter-Regional%20Coordination/WEND-WG/WENDWG%20Repository/SWPRHP-Hydrography-Risk-Assessment-Methodology.pdf (last accessed 7 April 2025).
Sánchez, R. J. and Wilmsmeier, G. (2009). Maritime sector and ports in the Caribbean: The case of CARICOM countries. CEPAL – Serie Recursos naturales e infraestructura, 140. https://www.researchgate.net/publication/259871293_Maritime_sector_and_ports_in_the_Caribbean
_the_case_of_CARICOM_countries (last accessed 2 April 2025).
Seepersad, D., Greenland, A., Eriksson, O. F. and Miller, K. (2020). Benefits of assessing risk in maritime navigation using IALA and LINZ methods. The International Hydrographic Review, 23. pp. 7–33. https://ihr.iho.int/articles/benefits-of-assessing-risk-in-maritime-navigation-using-iala-and-linz-methods/ (last accessed 20 January 2025).
Singh, A. et al. (2015). Assessment of Ship-Source Pollution in the Gulf of Paria. Institute of Marine Affairs (IMA). https://www.ima.gov.tt/publications/ (last accessed 30 January 2025).
Trinidad and Tobago Express (2009). Dead man found aboard drifting yacht. https://trinidadexpress.com/news/local/dead-man-found-aboard-drifting-yacht/article_38fe4033-0ec8-503c-a4b3-bc0ff916f32a.html (last accessed 20 January 2025).
Trinidad and Tobago Guardian (2018). Treasure Queen II now a hazard. https://www.guardian.co.tt/news/treasure-queen-ii-now-a-hazard-6.2.666682.a3e5b88a3f (last accessed 20 January 2025).
Trinidad and Tobago Guardian (2020). Castara fishermen rescue drifting deepsea vessel. https://www.guardian.co.tt/news/castara-fishermen-rescue-drifting-deepsea-vessel-6.2.1332650.f61392fad6 (last accessed 20 January 2025).
Trinidad and Tobago Guardian (2024). PM weighing foreign help if oil spill worsens. https://www.guardian.co.tt/news/pm-weighing-foreign-help-if-oil-spill-worsens-6.2.1923219.50bcf5d956 (last accessed 26 March 2025).
Trinidad and Tobago Newsday (2022). Updated: Five rescued after boat sinks: God saved us from drowning. https://newsday.co.tt/2022/03/13/updated-five-rescued-after-boat-sinks-god-saved-us-from-drowning/ (last accessed 20 January 2025).
Trinidad and Tobago Meteorological Service (2024). Satellite imagery. https://www.metoffice.gov.tt/ (last accessed 30 August 2024).
UN (1982). United Nations Convention on the Law of the Sea (UNCLOS). United Nations, United Nations, New York, USA. https://www.un.org/depts/los/convention_agreements/texts/unclos/unclos_e.pdf (last accessed 30 January 2025).
Vukša, S., Vidan, P., Bukljaš, M. and Pavic, S. (2022). Research on ship collision probability model based on Monte Carlo simulation and Bi-LSTM. Marine Science and Engineering, 10(8). https://www.mdpi.com/2077-1312/10/8/1124 (last accessed 20 January 2025).
Authors’ biographies

Shivani Seepersad is an Advisor to the International Organisation of Marine Aids to Navigation and a PhD candidate in the Department of Geomatics Engineering and Land Management at the University of the West Indies, Trinidad and Tobago. Her doctoral research, titled An Economic Evaluation of Risks due to Maritime Navigation across the Greater Caribbean Region, focuses on maritime safety and risk assessment. She has previously served as a GIS intern at York University, contributing to flood risk modelling for the Greater Toronto Area, and as a GIS technician at Land Information New Zealand on the Niue Hydrographic Risk Assessment. Shivani holds a B.Sc. in Geomatics Engineering (Honours) and an M.Sc. in Geoinformatics (Distinction).

Dexter Davis is Lecturer in the field of surveying, adjustments and geodetic surveying and is also Coordinator of the B.Sc. Geomatics Engineering Programme in the Department of Geomatics Engineering & Land Management, Faculty of Engineering, The University of the West Indies. He is a member of the Institute of Surveyors of Trinidad and Tobago as well as the ASPRS. His research areas include engineering surveying, digital photogrammetry and digital mapping, GNSS, geodesy and geodetic applications and hydrographic surveying. Some of his recent work includes sea level monitoring, low cost and disaster relief mapping and 3D point cloud applications for engineering and digital twins.