
Abstract
Preamble
Julia Swedenklef from the University of Plymouth (United Kingdom) is the winner of the IFHS Student Award 2024 for her Bachelor’s thesis on “Slippery slopes in the South Sandwich Islands: A GIS based approach to submarine landslide susceptibility mapping”. The following article summarises her award-winning work.
1 Introduction
1.1 Background
Submarine landslides represent a significant geological hazard due to their potential to generate destructive tsunamis, particularly in volcanic island settings where slope oversteepening and seismic activity contribute to their occurrence (Gallotti et al., 2020). Submarine volcanic flank collapse has the potential to cause great devastation. Historical examples highlight the devastating consequences, such as landslide-induced tsunamis on Oshima-Oshima (Japan, 1741, ~2000 casualties), Mt. Unzen (Japan, 1792, ~14,500 casualties), and Ritter Island (Papua New Guinea, 1888, >1500 casualties) (Karstens et al., 2020). The remote South Sandwich Islands, an active volcanic arc located in the Southern Atlantic Ocean, is particularly susceptible to landslide occurrence, and the impacts from tsunamis originating here have been recorded globally (Dragani et al., 2008). Despite this risk, landslide susceptibility in this region remains understudied, highlighting the need for focused research.
This study aims to address this gap by conducting the first comprehensive landslide inventory mapping and susceptibility modelling assessment for the South Sandwich Islands. The primary objectives are: (1) to create a detailed landslide inventory map by identifying and categorizing past landslide events using shipboard multibeam bathymetric data, and (2) to develop a landslide susceptibility model by integrating the landslide inventory with various geomorphic, geophysical, and oceanographic causative factors. The Frequency Ratio (FR) statistical approach will be used to calculate the ratio between landslide occurrence and non-occurrence for different classes of causal factors (Lee & Pradhan, 2007). This method is well-suited for data-scarce regions as it primarily relies on mapping past landslides and relating them to available regional datasets. This study is based on the assumption that landslide occurrence is both dependent on landslide causative factors, and that future landslides will occur under the same conditions of past landslides (Lee & Talib, 2005; Getachew & Meten, 2021). Throughout this study, the term “landslide” will be used to encompass various forms of sediment mass movement, such as slumps, debris flow, slips, or slides, all of which result in the formation of a characteristic scar in the bathymetry.
By enhancing the understanding of landslide dynamics and susceptibility in the South Sandwich Islands, this study will provide a baseline for future research and inform regional hazard assessment and mitigation strategies. The landslide inventory database and susceptibility map generated in this research will serve as valuable resources for researchers and policymakers involved in mitigating the risks posed by landslide-induced tsunamis in this remote oceanic region.
1.2 Study area
1.2.1 Physiographic and geological setting
The South Sandwich Islands are a 350 km long volcanic arc located in the remote South Atlantic Ocean, approximately 760 km south-east of South Georgia (Allen & Smellie, 2008). This intra-oceanic arc was formed by the subduction of the South American tectonic plate beneath the Antarctic plate (Hogg et al., 2021; Leat et al., 2014). The main tectonic features in the region include the South Sandwich Trench, marking the subduction zone, the volcanic arc itself comprising the islands, and the East Scotia Ridge back-arc spreading center (Leat et al., 2003). The islands are volcanically active, with various volcanoes exhibiting eruptions within the time frame of historical record (Bristol Island, 1956; Protector Shoal, 1962; Saunders Island, 1995–1998; Montagu Island in 2001–2007 (Leat et al., 2013)). The bathymetry of the arc is marked by steep volcanic flanks and seamounts, making the region particularly susceptible to slope instability and mass wasting processes. Historical records also indicate that the area has experienced significant seismic activity, with earthquakes occurring at various depths and displaying complex temporal patterns (Jia et al., 2022). These seismic events, combined with the oversteepening of volcanic slopes, can trigger slope failures and contribute to landslide hazards.
1.2.2 Oceanographic setting
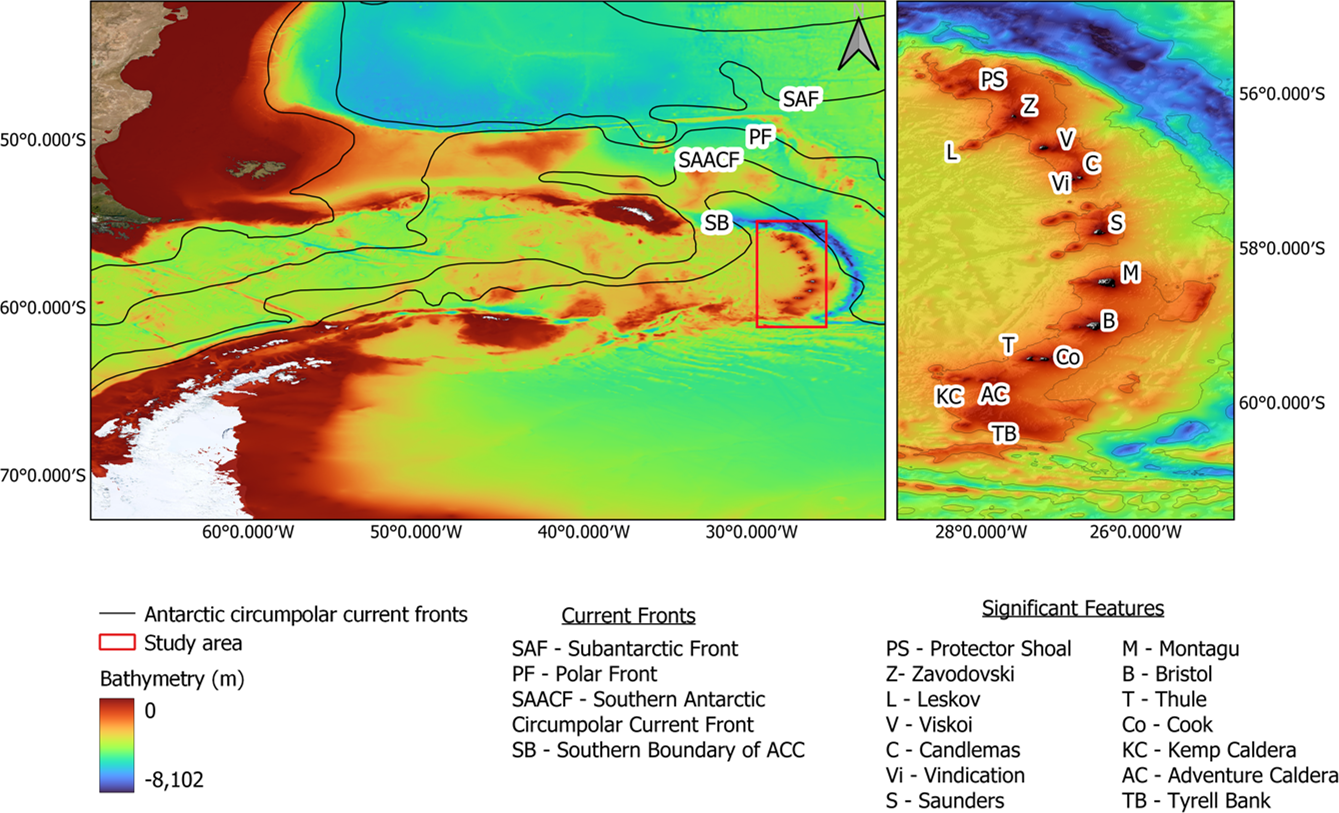
In addition to the active tectonic processes, the South Sandwich Islands are situated in a dynamic oceanographic setting influenced by the Antarctic circumpolar current (ACC). This powerful eastward-flowing current encircles Antarctica and is comprised of several fronts, shown in Fig. 1. The Southern Boundary (SB) of the ACC flows northeastward through the region, generating strong currents, turbulence, and mixing patterns that can affect seafloor sedimentation and slope stability (Thorpe & Murphy, 2022; Nicholson et al., 2020; Collins et al., 2022). The complex interaction between active volcanism, seismicity, steep submarine slopes, and the influence of the ACC creates an environment particularly prone to submarine landslides and mass wasting processes.
2 Methodology
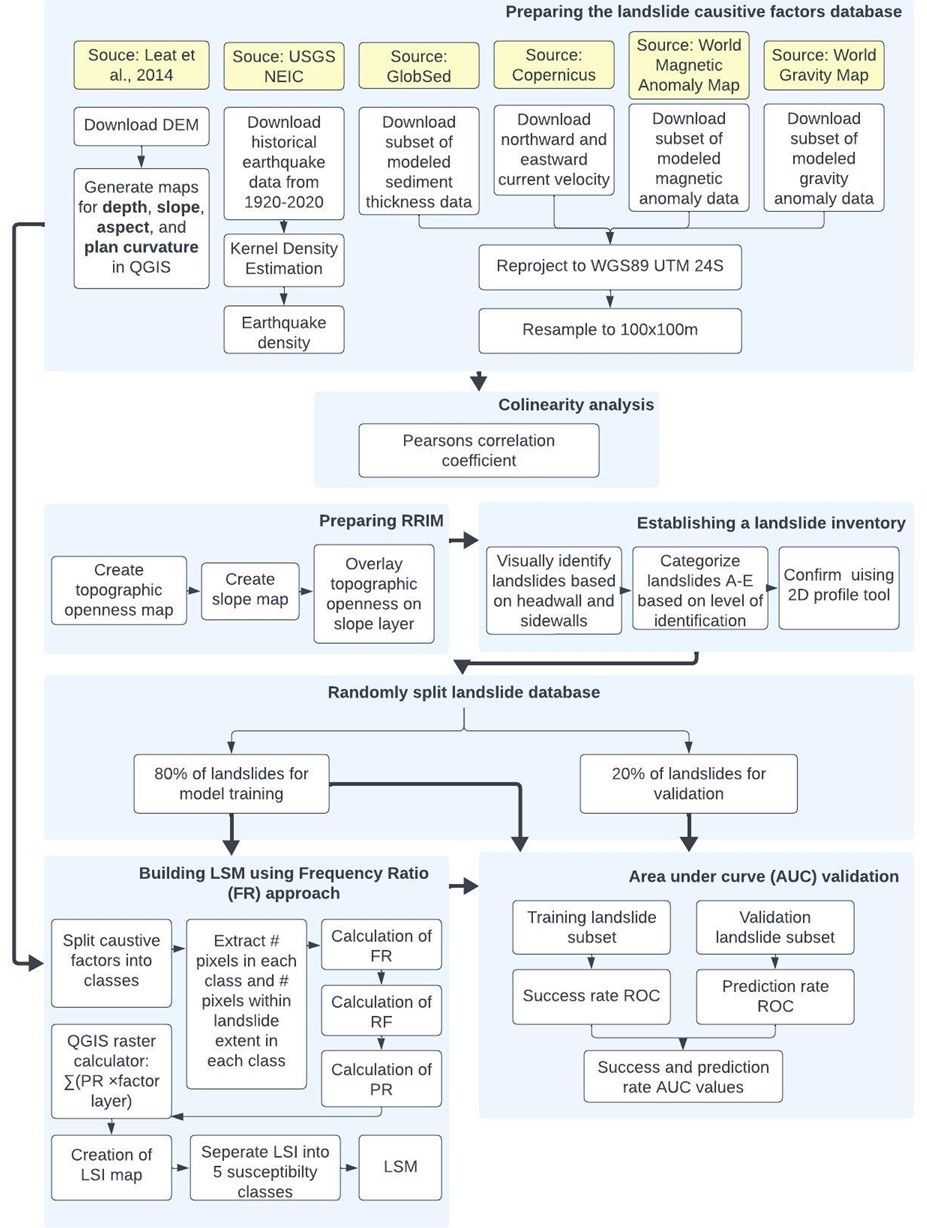
A methodology workflow was created as in Fig. 2, detailing key steps taken to generate results. The following Sections 2.1–2.7 provide a more detailed overview as to how methodological steps were undertaken.
2.1 Data collection and organization
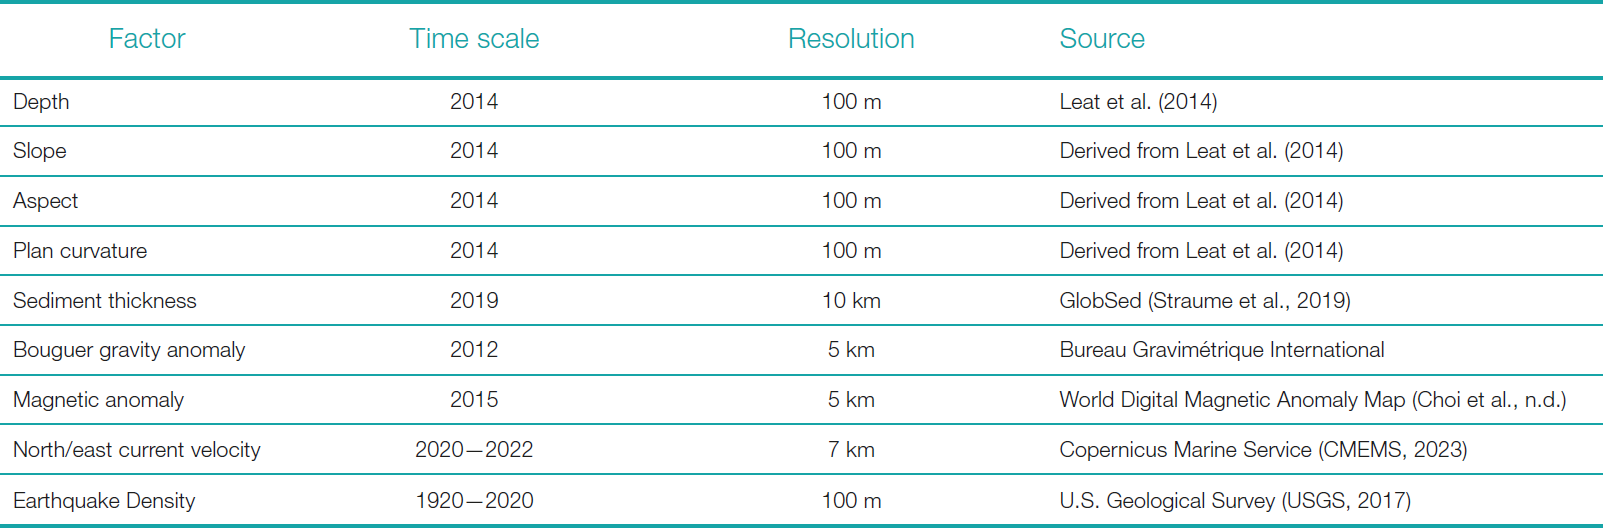
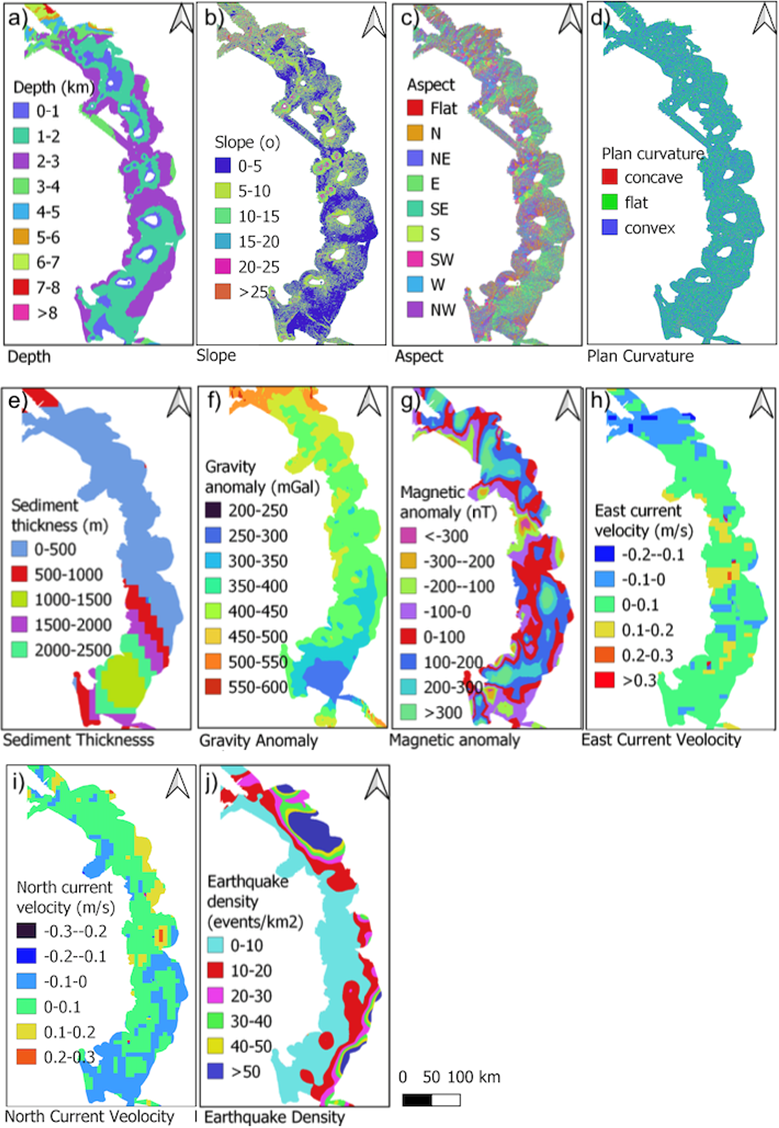
Data for the susceptibility mapping was compiled from various sources including a 100 m resolution Digital Elevation Map (DEM) and its derivatives (Leat et al., 2014), modelled sediment thickness, gravity anomaly, magnetic anomaly, current velocity at 1000 m depth, and historical earthquake events. All data were resampled to 100 m to match the DEM resolution. Table 1 compiles the causative factors with the data time scale, resolution, and source.
The DEM was used for landslide identification and mapping. It was converted to a red relief image map (details in Section 2.2) to aid visual detection of landslides by identifying headwalls, sidewalls, and deposit areas. The 3D visualization and 2D profile tool in QGIS were also used to identify/confirm possible landslides. A total of 342 landslides were identified and randomly split into 80 % for modelling and 20 % for validation. Data processing was done using QGIS, Excel and IBM SPSS.
2.2 Preparing Red Relief Image Map (RRIM)
Using the methods of Chiba et al. (2007), a Red Relief Image Map (RRIM), was created to aid landslide identification. The main benefit of using the RRIM approach is that it distinguishes concave and convex features (valleys vs ridges), unlike a slope map which is the more commonly used technique for landslide mapping. RRIM depicts features with greater steepness as appearing redder and features that are more downward than the surroundings as darker. This was done by overlaying a topographic openness map with a white to red colour scale on a greyscale slope map.
2.3 Landslide classification scheme
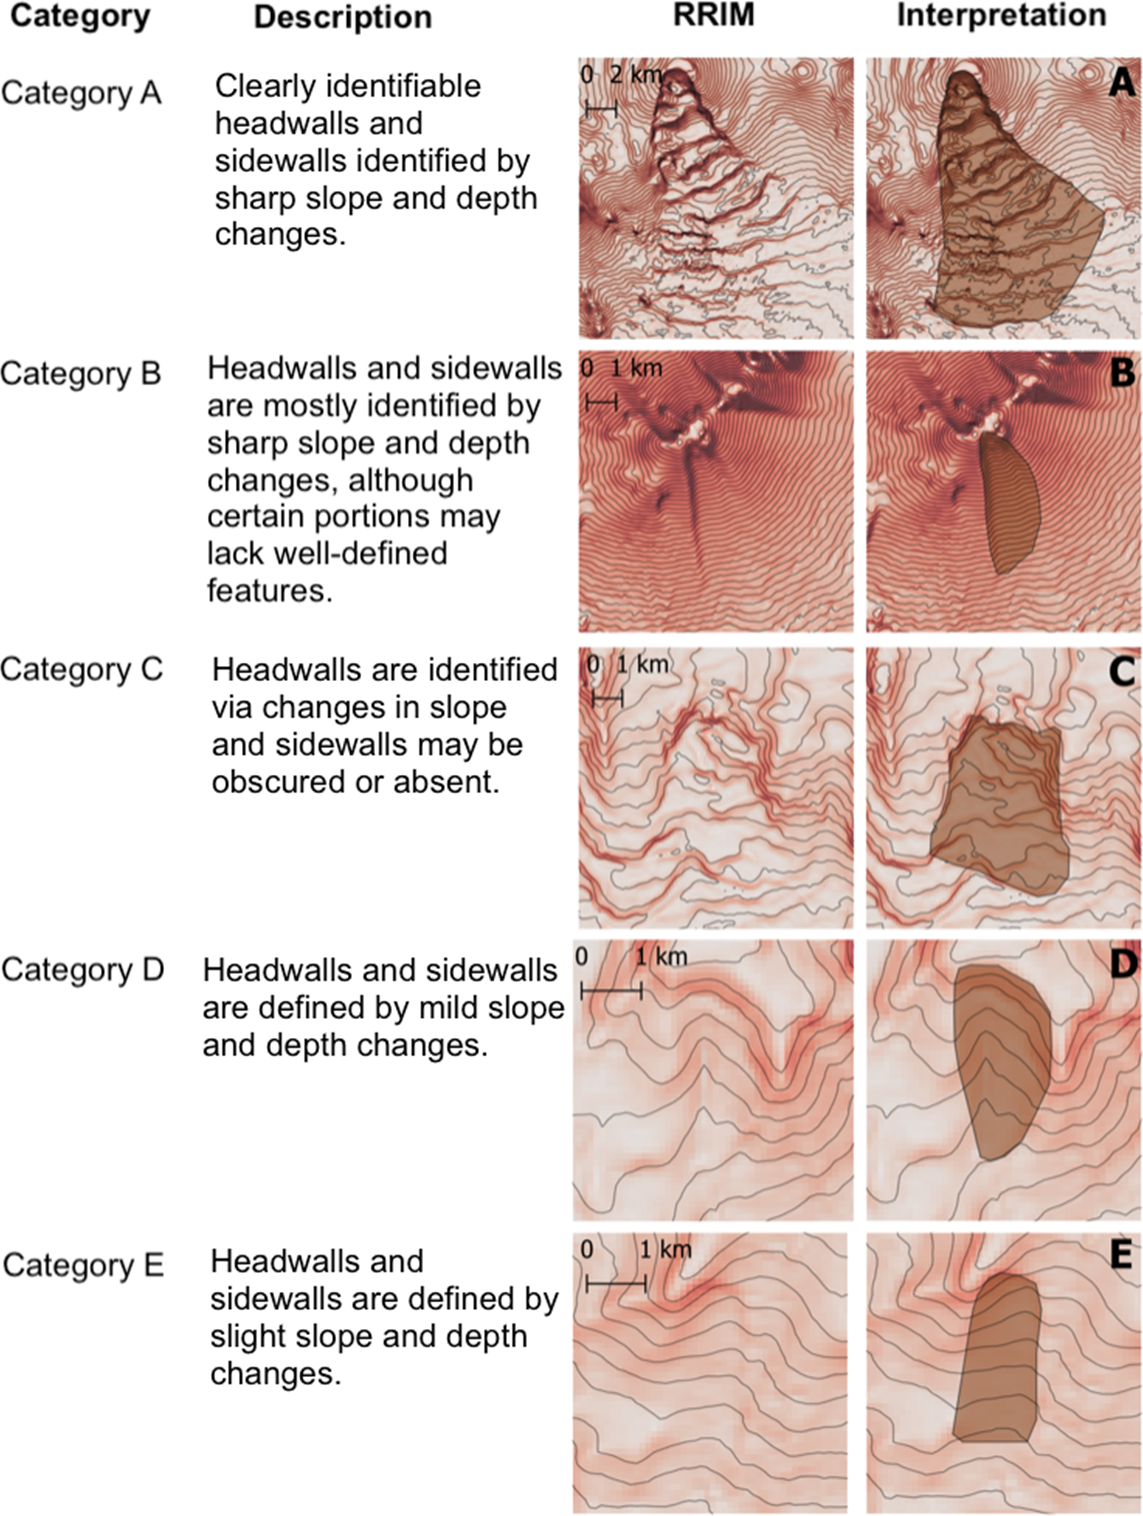
Identified landslides were classified from A–E based on the clarity of headwalls and sidewalls, adapted from Chang et al. (2021). This scheme assigns confidence levels to account for the limited resolution and challenges of visual identification of landslides over large time scales. The classification scheme used is described in Fig. 3.
2.4 Database for landslide causative factors
Landslide susceptibility analysis requires a comprehensive spatial database comprising of a landslide inventory and various factor layers known to influence slope instability. In this study, ten causative factors (Table 1) were selected based on data availability and their significance in previous landslide susceptibility studies, both for submarine (Dyer et al., 2022; Du et al., 2022; Masson et al., 2006; Conforti & Letto, 2021; Innocenti et al., 2020) and terrestrial (Acharya & Lee, 2018; Alkhasawneh et al., 2013; Borrell et al., 2016; Genene & Meten, 2021; Getachew & Meten, 2021; Islam et al., 2022; Mersha & Meten, 2020; Mirnazari et al., 2014) environments. All factor layers were compiled in QGIS as raster datasets with a consistent projection (WSG84 UTM Zone 24S) and a cell size, and sub divided into a number of classes depending on the range of the data.
2.5 Collinearity analysis
A collinearity analysis was performed to exclude highly correlated factors and avoid biasing the results (Conforti & Letto, 2021). Pearson correlation coefficient was used to detect collinearity among the ten factors. Factors with coefficients exceeding 0.7 were considered correlated and removed from further analysis.
2.6 Frequency ratio model
The frequency ratio (FR) model is a simple bivariate statistical method often used in landslide susceptibility mapping with reliable results (Silalahi et al., 2019; Acharya & Lee, 2018; Genene & Meten, 2021; Mirnazari et al., 2014; Oh, Lee & Hong, 2017; Rahman et al., 2020; Amaliah et al., 2021). The FR method calculates the ratio of landslide occurrence to non-occurrence for each class of the causative factors. In this study, the landslide inventory database was divided into a training subset (80 % of the data) for constructing the susceptibility model and a validation subset (remaining 20 %) for assessing the model’s predictive capability. For each factor layer, the number of pixels in each class was extracted, along with the number of pixels within the training landslide regions for that class.
The FR value for each class was calculated using the formula below (Thapa & Bhandari, 2019):
 |
(1) |
where
- A: Number of landslide pixels for individual class i within each factor n
- B: Total number of pixels in landslide regions over study area
- C: Number of pixels in each class i of each factor n
- D: Total number of pixels in the study area
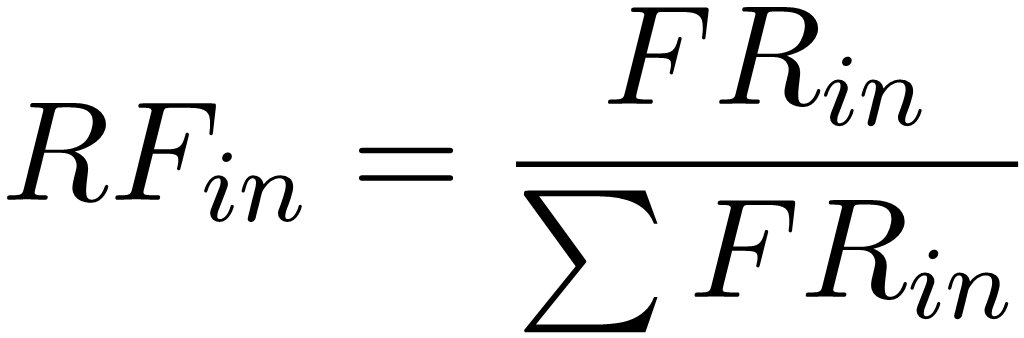
An FR value greater than 1 indicates a higher probability of landslide occurrence for that class. To standardize the FR values within the range of 0 to 1, the relative frequency (RF) was derived using the following formula (Youssef et al., 2023):
 |
(2) |
The causative factor layers were then reclassified with their respective RF values. Next, the weight, or prediction rate (PR), of each factor was calculated to assess its relative importance:
 |
(3) |
Using the raster calculator in QGIS, the landslide susceptibility index (LSI) was computed by summing the products of each factor’s PR and reclassified RF layer:
 |
(4) |
The LSI represents the relative landslide susceptibility, with higher values indicating higher susceptibility. The LSI values were categorized into five classes (very low, low, medium, high, and very high) using Jenks natural breaks, generating the final landslide susceptibility map (LSM) from the training subset.
2.7 Area under curve validation
The LSM’s accuracy was assessed using area under the curve (AUC) derived from success and prediction rate receiver operating characteristic (ROC) curves using IBM SPSS software. Success rate evaluates the model’s efficiency in capturing known landslides (training subset). Prediction rate calculates the percentage of independent landslides captured by the susceptibility map, indicating the ability to predict “unknown” landslides. This is done using the validation landslide subset that was not used in the model (Genene & Meten, 2021).
3 Results
3.1 Landslide inventory map
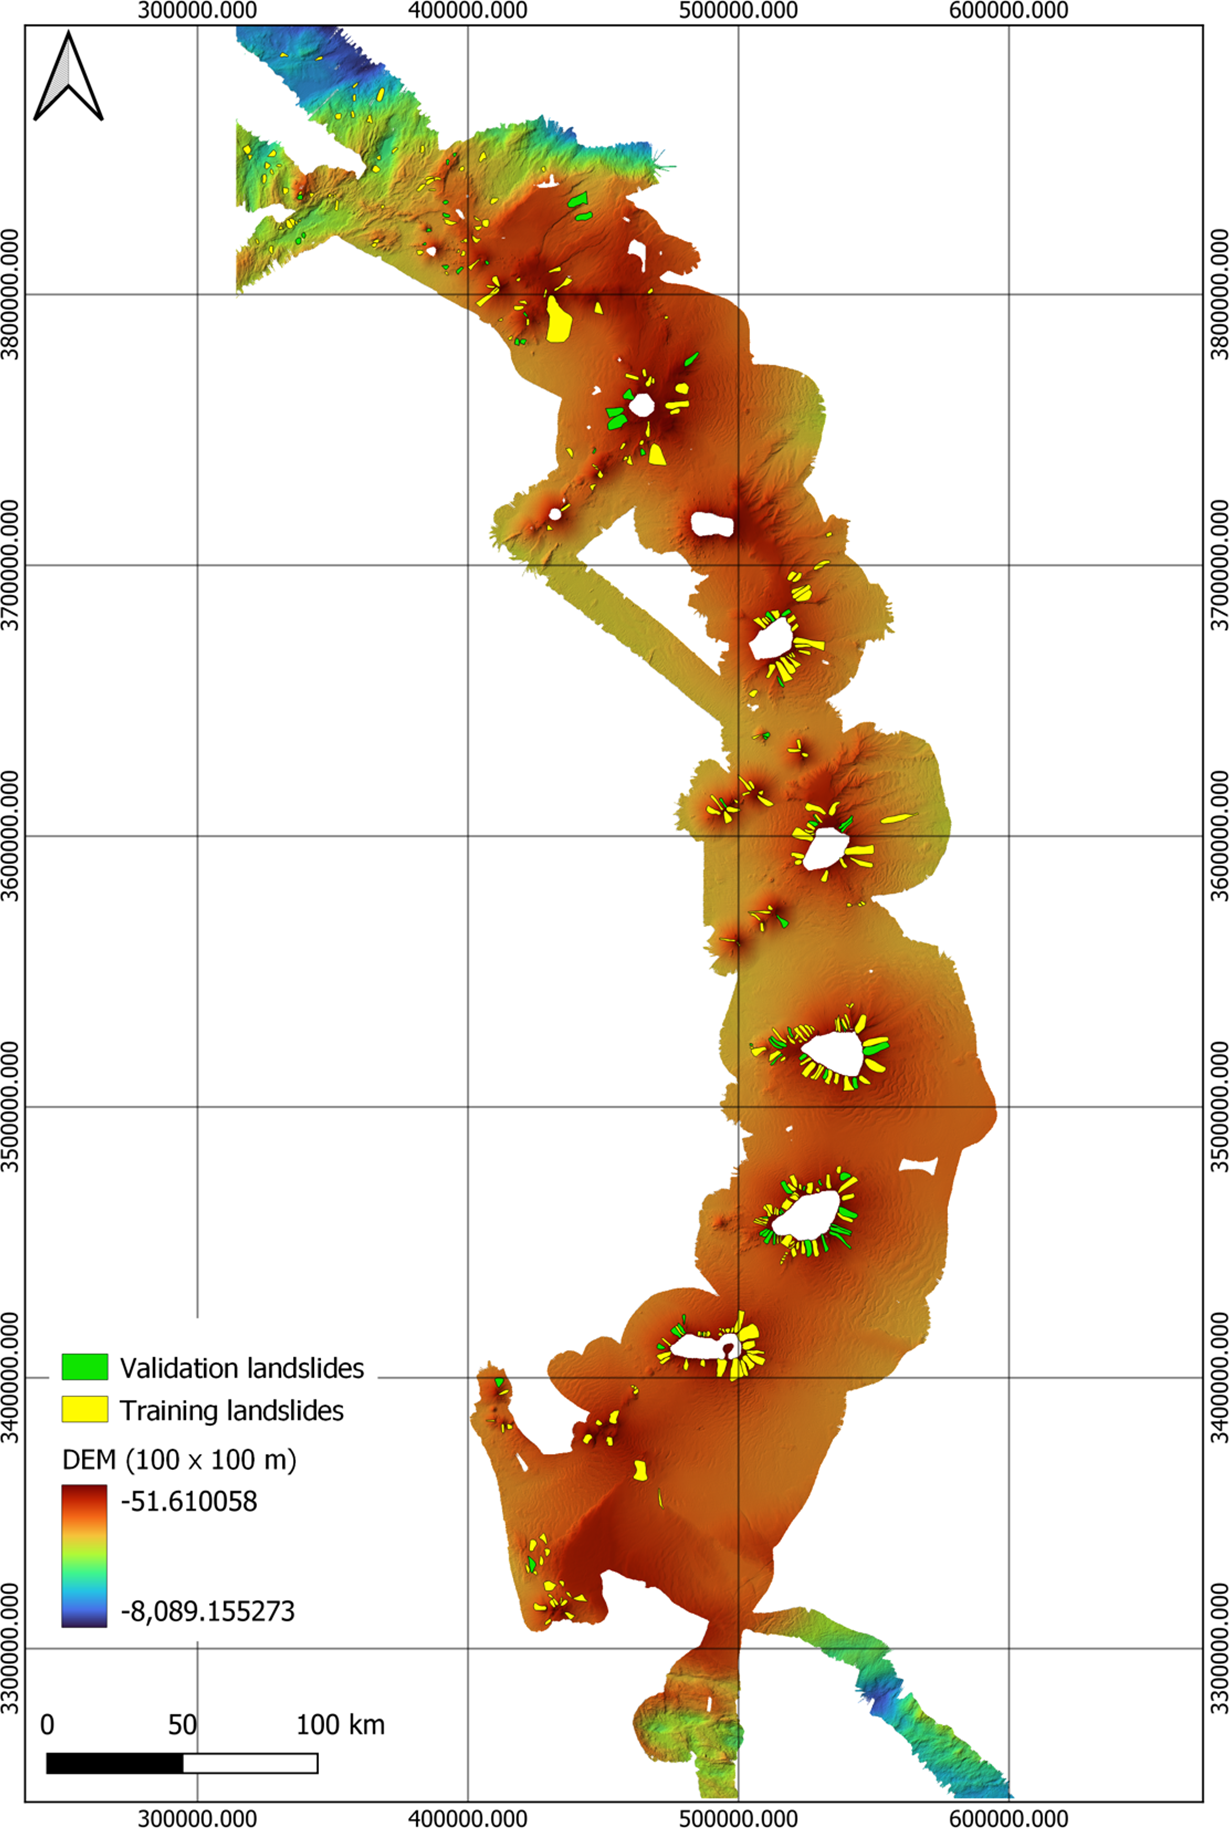
A total of 342 landslides were identified throughout the study site, primarily concentrated on the upper slopes of volcanoes and seamounts. The majority of landslides were classified into category B (106 landslides), followed by D (73), C (69), A (68), and E (21). The average area of landslides in the South Sandwich Islands is 6,200 km2. There is a concentration of small landslides not associated with volcanoes in the deep region north of Protector Shoal. The most significant landslide event is documented on the southern side of the Protector Shoal, spanning 7,620 km2.
The distribution of mapped landslides across the entire study site is shown in Fig. 5, with the training and validation landslides indicated by yellow and green, respectively. The general pattern of landslide occurrence 6 indicates that landslides tend to occur on the upper slopes of volcanic islands and seamounts. A deviation from the pattern of landslides occurs on the Visokoi Island where there is an absence of landslides, instead, an erosion pattern is present.
3.2 Detection of collinearity between causative factors
The Pearson correlation test confirmed no strong collinearity among the causative factors, with all correlation coefficients between -0.7 and 0.7 (Appendix, Table 3). Therefore, all ten factors were included in the landslide susceptibility model.
3.3 Relationship between landslide occurrence and causative factors
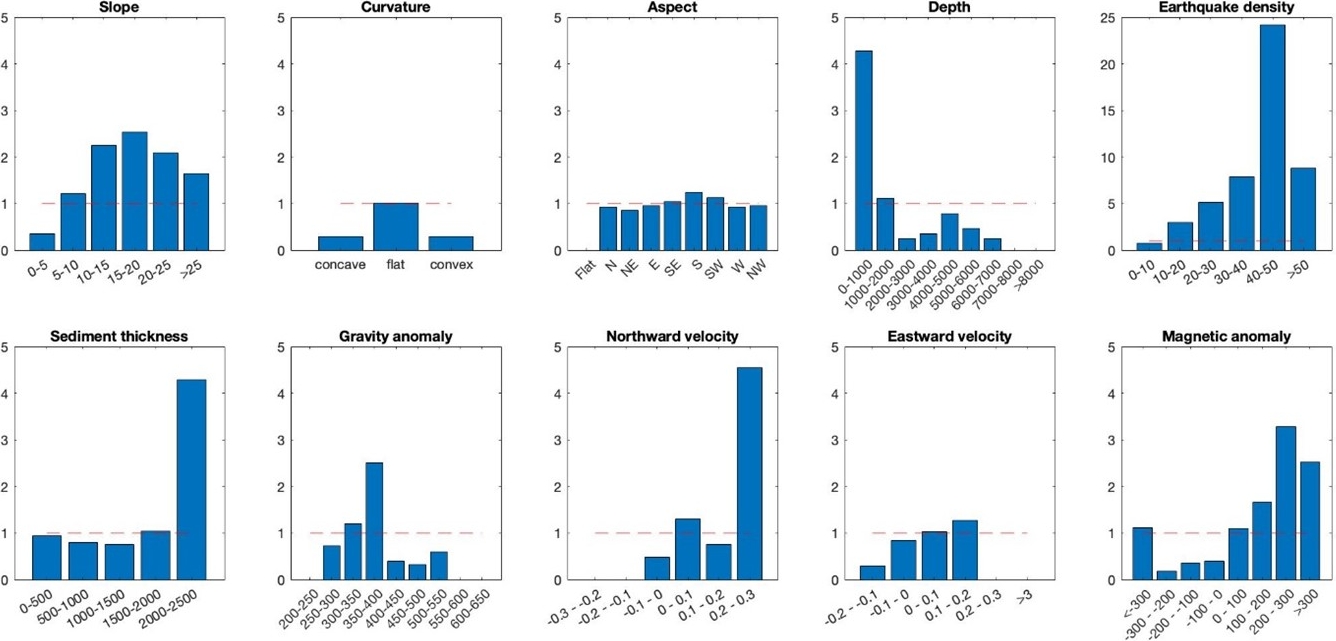
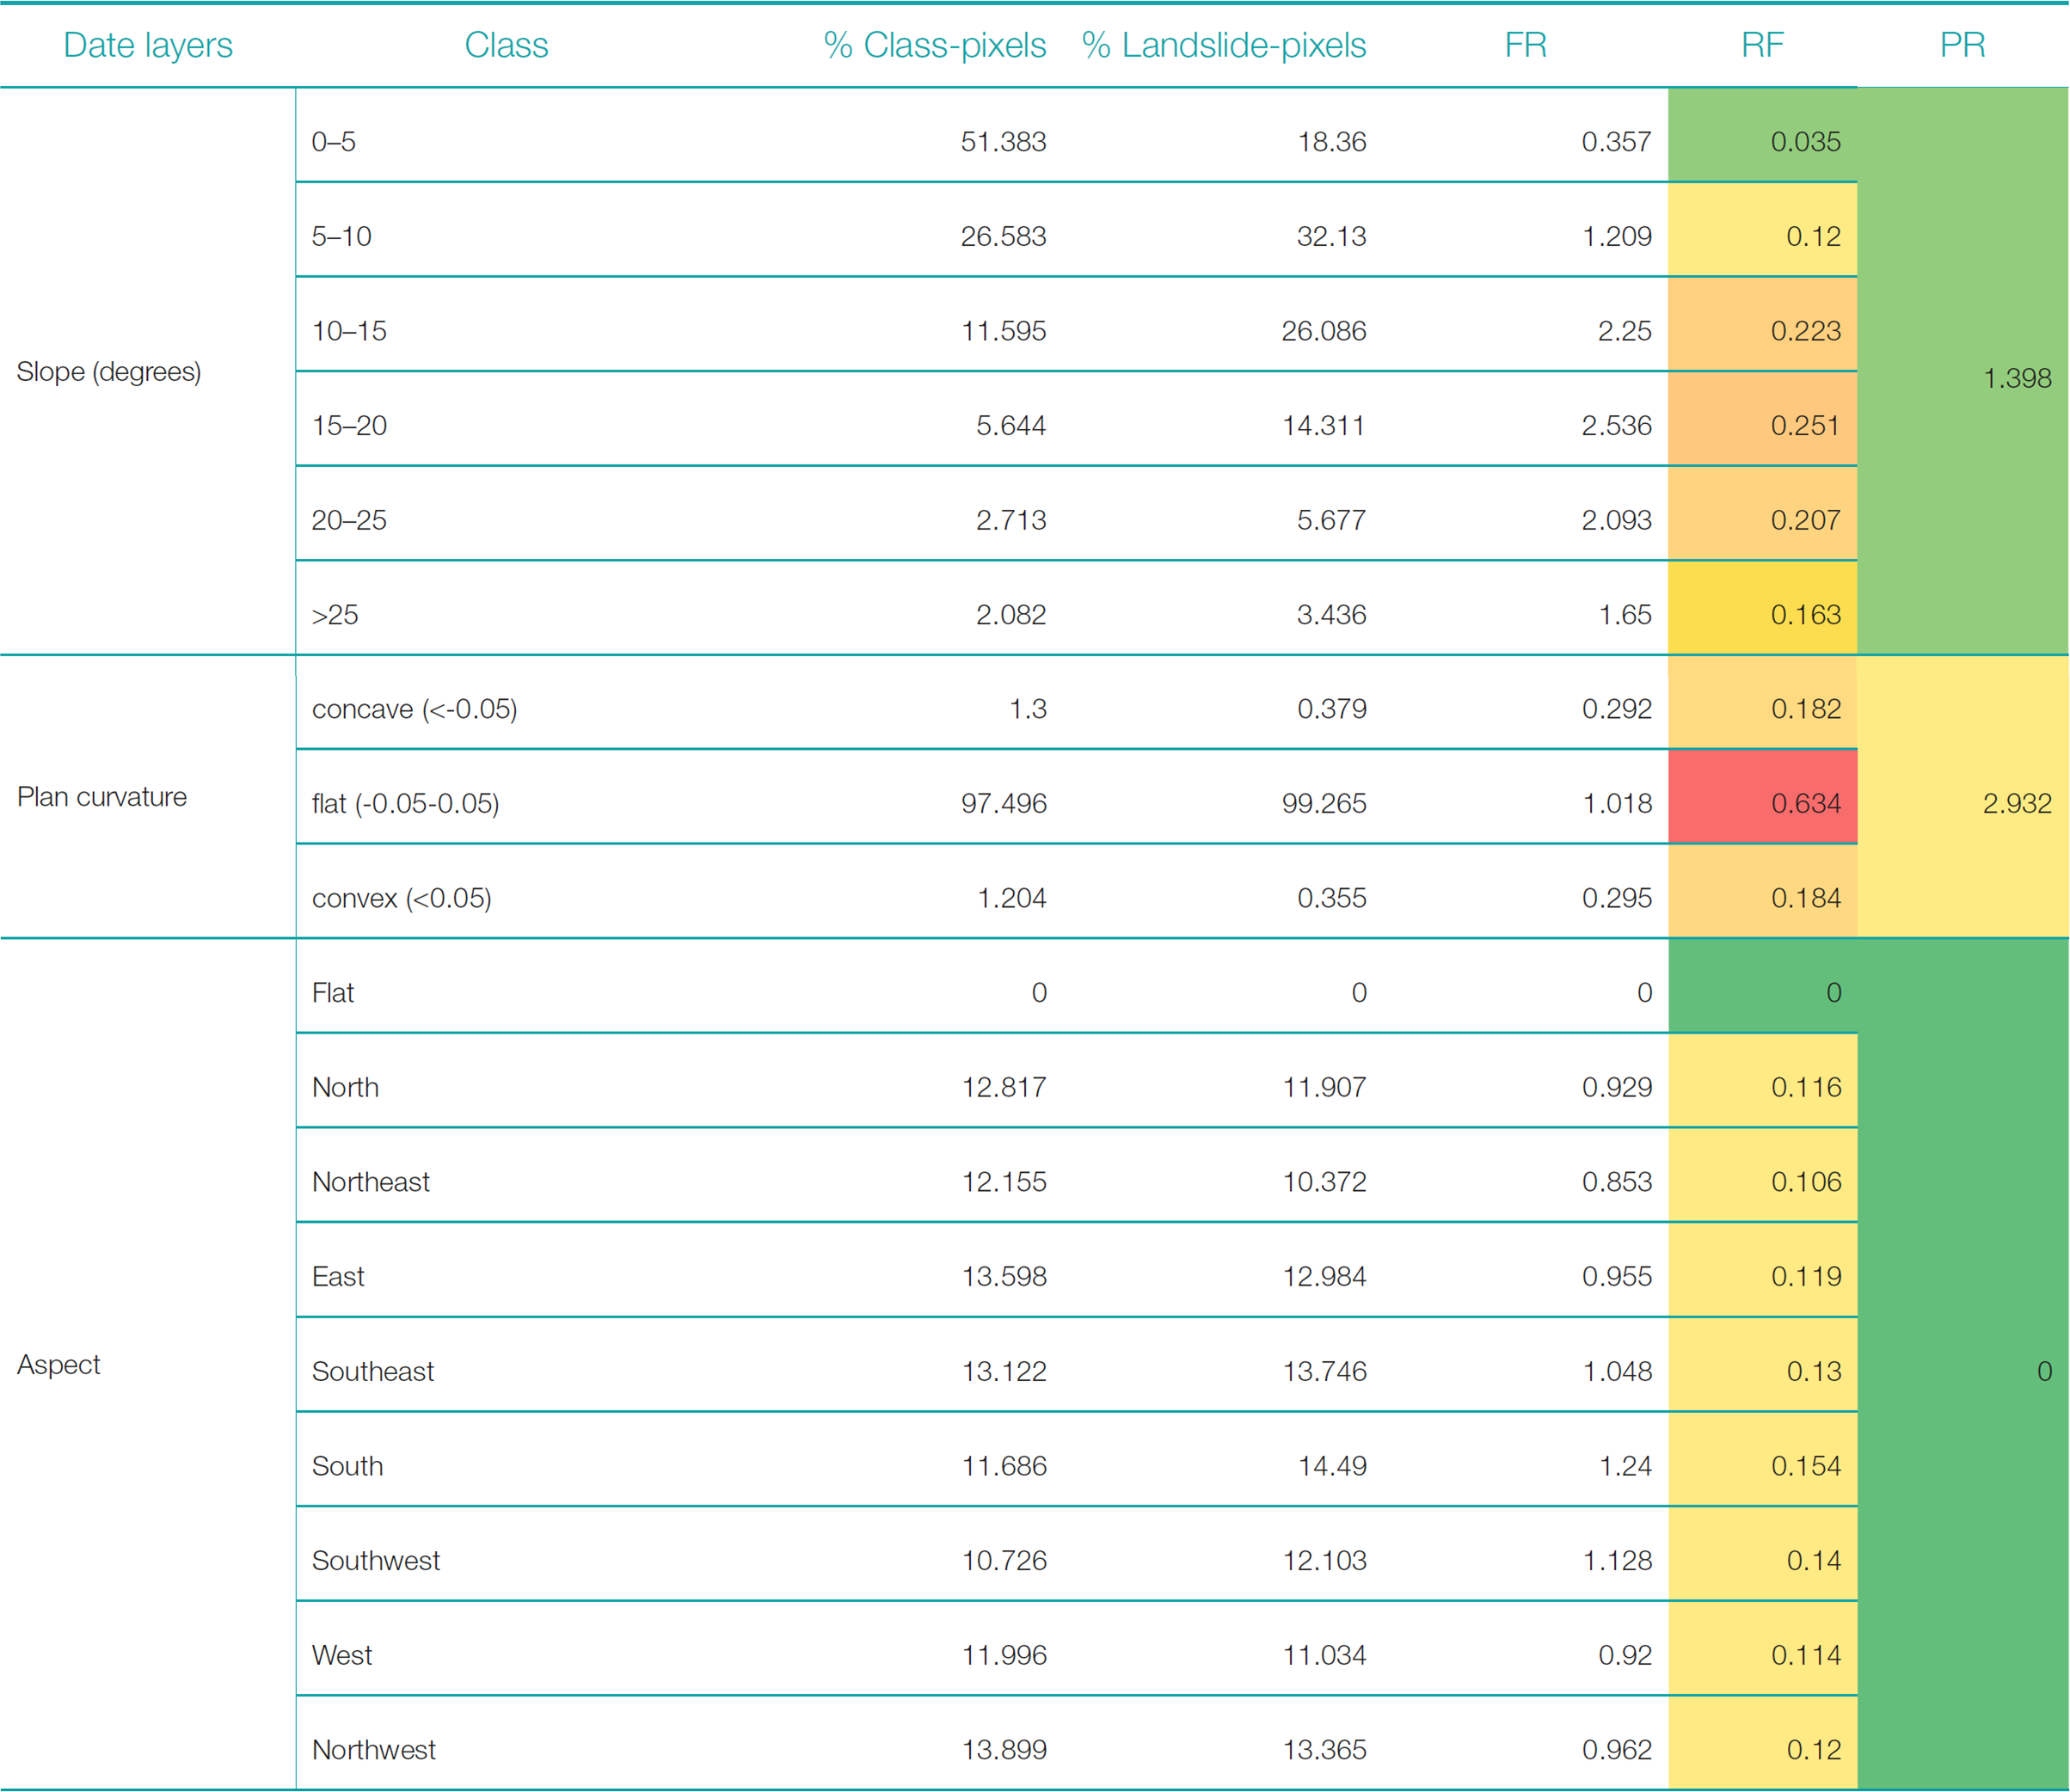
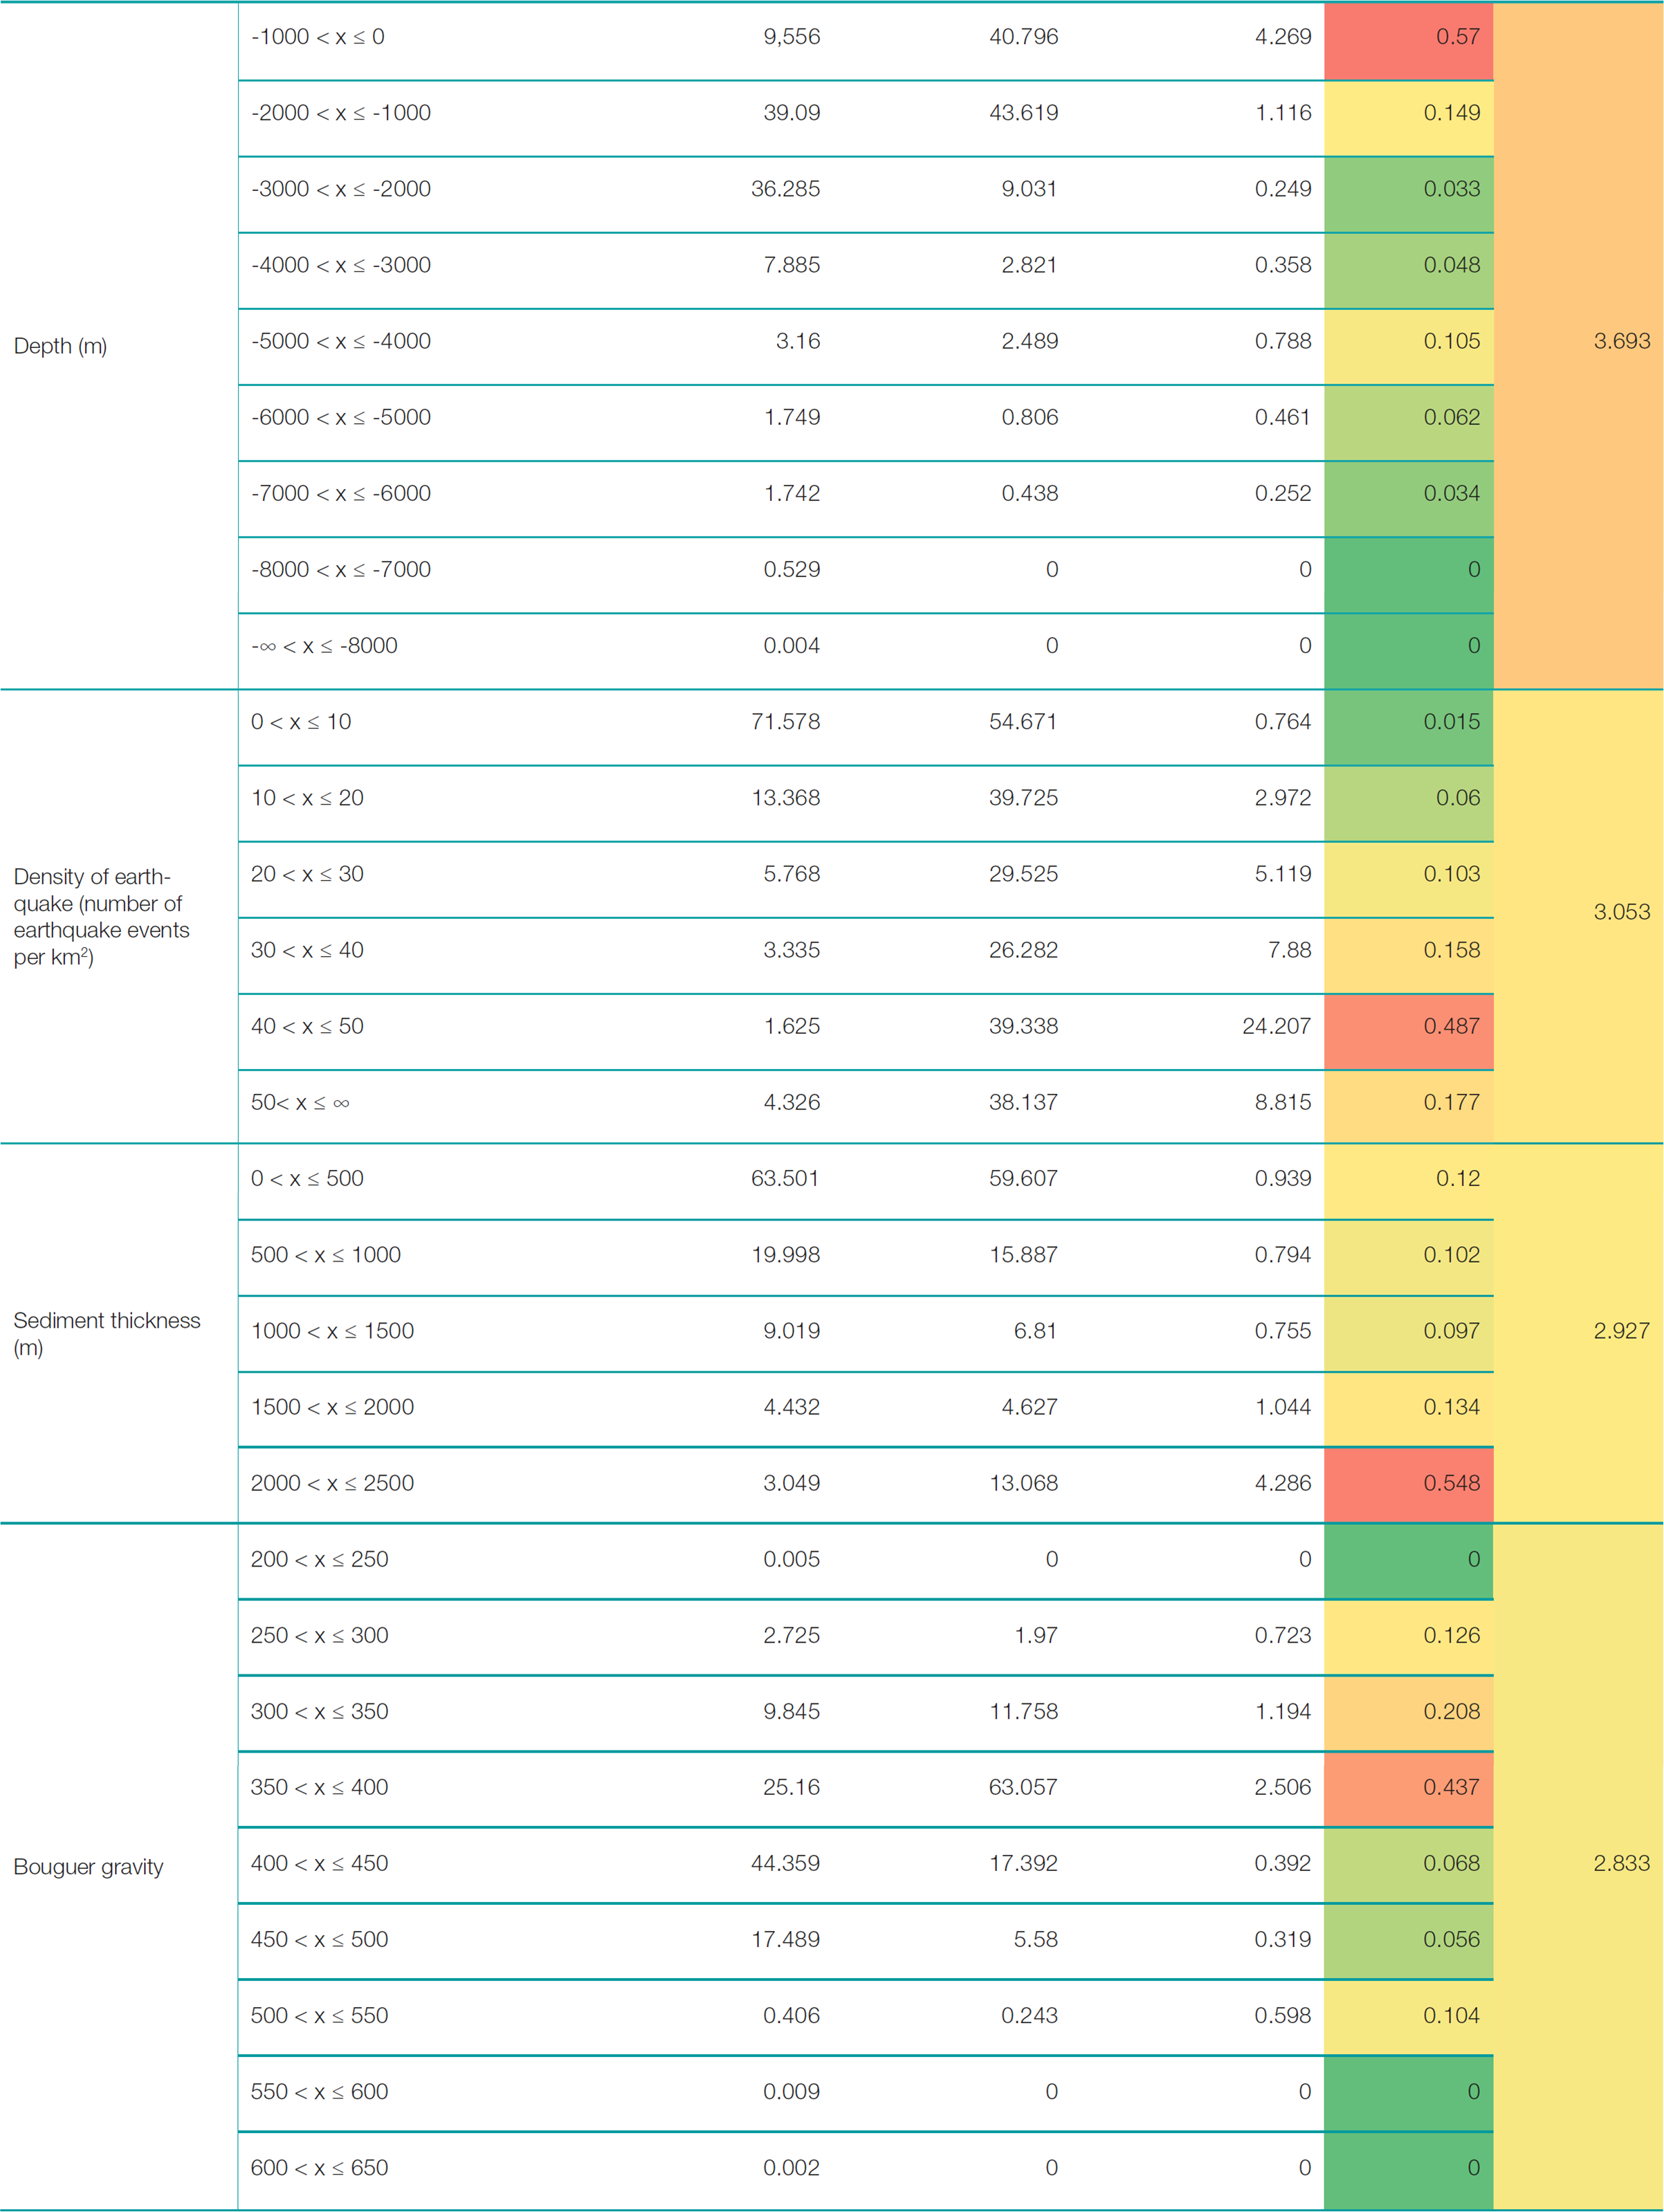
The FR model approach outlined in Section 2.6 enabled a comprehensive analysis of the relationship between landslide occurrence and the ten selected causative factors in the South Sandwich Islands region. Fig. 6 graphically represents the FR values, with the red dashed line indicating when the classes exhibit a higher propensity for landslide occurrence (FR > 1). Table 4 in the Appendix shows the full table of FR, RF and PR values.
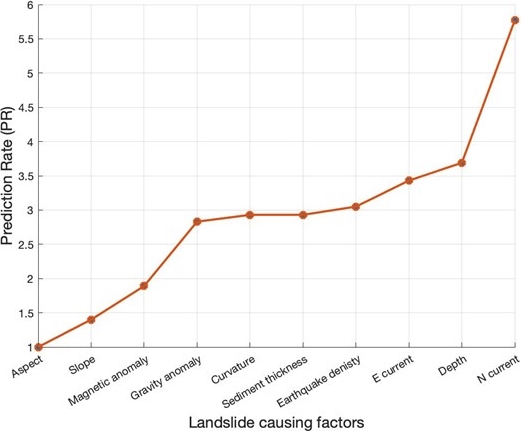
Northward current velocity emerged as the most significant factor, with the 0.2–0.3 m/s class exhibiting the maximum FR value of 4.55, indicating high relative landslide susceptibility under these strong northward flow conditions. For eastward currents, the 0.1-0.2 m/s class demonstrated the maximum FR value of 1.27. As anticipated, most landslides occurred within 1000 m depth (FR = 4.27), with the 1000–2000 m class also exhibiting elevated susceptibility (FR = 1.12), and no slides were detected below 6000 m depth. Additionally, areas with earthquake densities greater than 10 events/km2 were significantly more susceptible, peaking at 40–50 events/km2 (FR = 24.21).
Surprisingly, slope angle did not show the expected increasing susceptibility trend on steeper slopes. Instead, the 15–20° class had the highest FR value of 2.54. While aspect overall was found to be the least significant (Fig. 7), the south-facing slopes were the only classes found to have higher landslide susceptibility. Additionally, positive magnetic anomalies (>0 nT, FR up to 3.28) were generally associated with higher landslide occurrences, except for values less than -300 nT which also showed elevated susceptibility (FR = 1.11). The Bouguer gravity anomaly data showed greater association between landslide occurrence and positive gravity anomaly values, with the 350–400 mGal class having an FR value of 2.50.
Increased sediment thickness correlated with higher landslide susceptibility with the 2000–2500 m class having the highest FR value of 4.29. Finally, the ‘flat’ curvature class (values between -0.05 and 0.05) had an FR value of 1.018, just exceeding the higher susceptibility threshold of FR > 1 and is a relatively minor factor for the LSM.
3.4 Prediction rate of factors
The significance of each factor to landslide occurrence is given by the PR values (Youssef et al., 2023). Northward current velocity was found to be the most significant factor for determining landslide susceptibility, followed by depth, eastward current velocity, earthquake density, sediment thickness, curvature, and gravity anomaly. The least significant factors were aspect, slope, and magnetic anomaly. A scatterplot of the PR values for each factor is shown in Fig. 7.
3.5 Landslide susceptibility map
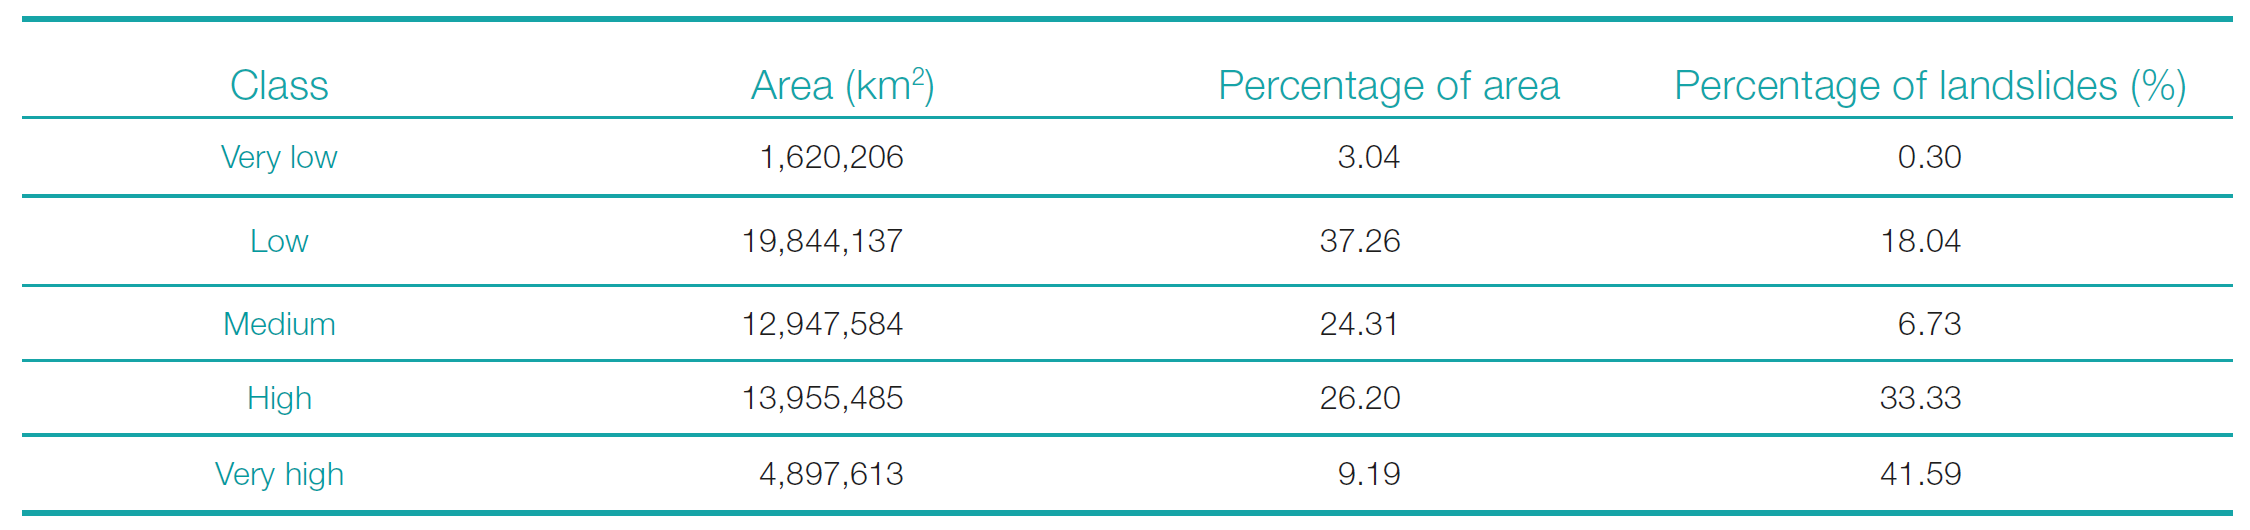
The LSI values computed by the frequency ratio model ranged from 81 to 612. The LSI values were classified into five categories (very low, low, medium, high, and very high susceptibility) using the Jenks natural breaks method. This classification technique optimally represents clustered patterns by minimizing within-group variance while maximizing between-group variance (Chen et al., 2013). The area coverage and percentage of mapped landslides within each susceptibility class are presented in Table 2. The ‘very low’ class covered the smallest area (3.04 %) and contained only 0.3 % of total landslides, while the ‘high’ and ‘very high’ classes encompassed a substantial 74.92 % of landslides despite accounting for 35.39 % of the study area. This distribution aligns with the expectation that higher susceptibility areas should capture a greater proportion of historical landslide events.
The resulting LSM is shown in Fig. 8. As anticipated, ‘high’ to ‘very high’ susceptibility areas are concentrated around the upper slopes of volcanic islands and seamounts, where steeper terrain is more prone to slope failures. Visually, the LSM exhibits some harsh geometric patterns likely due to the coarse resolutions of certain input datasets. For example, a rectangular section in the southern end of the study area is characterized as ‘high susceptibility’; however, no landslides have occurred in that region. This pattern corresponds to the spatial distribution of the sediment thickness factor layer, suggesting that the model may have assigned excessive weight to this parameter in certain areas due to its coarse resolution.
Additionally, while the LSM indicates ‘very high’ susceptibility on the upper slopes of Visokoi Island, no landslides were detected in this area during inventory mapping. Instead, a gully feature, potentially formed by glacial erosion, was observed. This discrepancy highlights the importance of interpreting the LSM in conjunction with field observations and other relevant data.

3.6 Model validation
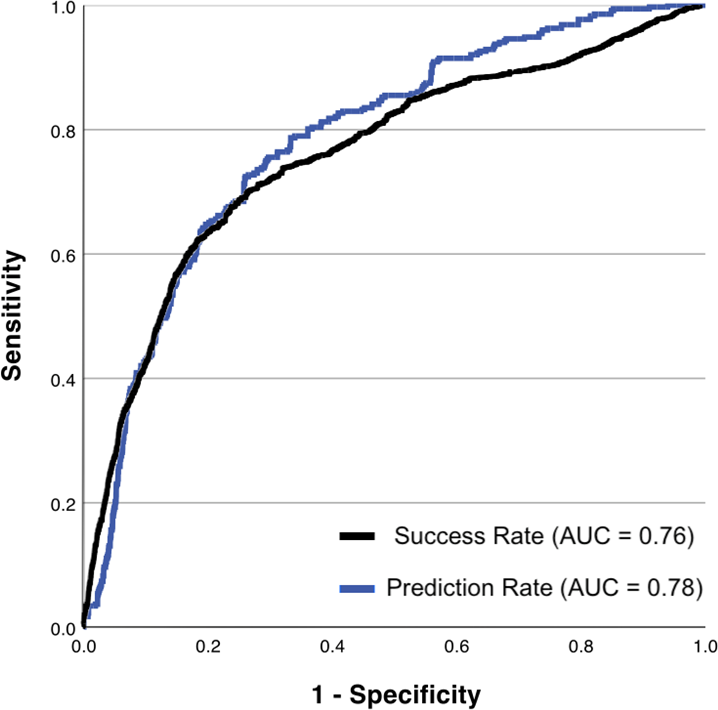
Model validation was performed using AUC derived from ROC curves for success rate and prediction rate scenarios. An AUC of 0.5 represents a random prediction, while a value of 1 indicates perfect classification. Fig. 9 shows the success rate (black) and prediction rate (blue) ROC curves for the landslide susceptibility model developed in this study. The corresponding AUC values are 0.759 for the success rate and 0.784 for the prediction rate, suggesting good overall performance in capturing both known and unknown landslide events.
4 Discussion
4.1 Landslide inventory map
This analysis is constructed around the theory that future landslides are likely to occur under similar conditions as past landslides, therefore, the landslide inventory map is a crucial factor in this analysis. The majority of landslides were concentrated on the upper slopes of volcanic islands and seamounts, reflecting the influence of steep terrain and surface processes on slope failure dynamics. This pattern aligns with observations from other volcanic island and seamount settings, where the steepness of upper slopes, erosion from underwater currents which tend to be stronger near the surface, and ongoing volcanic and seismic activity contribute to heightened instability. (e.g., Dyer, 2022; Avdievitch & Coe, 2022; Chang et al., 2021).
A notable deviation from this pattern was observed in the area north of Protector Shoal, where a concentration of smaller landslides not directly associated with volcanic edifices was identified. This cluster may be indicative of the influence of regional oceanographic processes, such as strong bottom currents or sediment transport mechanisms, in triggering slope failures in this region. Further investigation into the local sedimentological and hydrodynamic conditions could shed light on the specific causal factors responsible for this landslide distribution.
The classification scheme employed in this study provides a valuable framework for quantifying the confidence levels associated with each identified landslide feature. By assigning categories based on the clarity of headwalls and sidewalls, this approach acknowledges the inherent challenges and uncertainties involved in visual landslide detection, particularly in areas with limited resolution data. The distribution of landslide categories revealed that the majority fell within categories B and D, indicating a moderate level of confidence in their identification. This finding underscores the need for caution in interpreting the results and highlights the potential for both false positives (misidentified features) and false negatives (unidentified actual landslides) within the inventory.
4.2 Landslide susceptibility map
Examination of the ROC analysis results show that the LSM supplied good success and prediction rate with AUC values of 0.76 and 0.78, respectively (Fig. 9). Approximately 81.6 % of mapped landslides occurred in areas classified as medium to very high susceptibility, aligning with the assumption that future landslides will occur under similar conditions as past events. This indicates that the FR method is a reliable and robust method for predicting landslide susceptibility within the study area.
The selection of landslide causative factors and their relative importance values significantly impact the accuracy of the susceptibility model. While the influence of predisposing factors on landslide distribution has been extensively studied in terrestrial environments (Alkhasawneh et al., 2013; Genene & Meten, 2021; Islam et al., 2022; Mersha & Meten, 2020; Mirnazari et al., 2014), investigations into submarine landslide susceptibility mapping are less common (Conforti & Letto, 2021; Shan et al., 2021). In this study, the influence of each factor was assessed using the PR as an extension of the FR method. The findings suggest that while all factors positively contributed to the LSM, their relative importance in the model construction varied. Notably, the northward current velocity emerged as the most influential factor, with a PR value of 5.8, followed by depth (PR = 3.7) and eastward current velocity (PR = 3.4).
The results support previous research linking high current velocities to submarine landslide occurrence by promoting slope oversteepening (Nicholson et al., 2020; Du et al., 2022). However, the identification of current velocity as the most influential factor in susceptibility mapping is a novel finding. A plausible explanation lies in the study area’s proximity to the ACC. The South Sandwich Islands are situated near the ACC’s SB, which flows northeastward through the region (Thorpe & Murphy, 2022). The ACC’s strong currents can erode and transport sediments, leading to the accumulation of unstable deposits on over-steepened slopes, pre-conditioning them for failure (Clare et al., 2016; Stoecklin et al., 2017). This process may be exacerbated by seismic activity, which can trigger slope collapse. Notably, Nicholson et al. (2020) demonstrated that the ACC, specifically the subantarctic front, directly influences the location, magnitude, and frequency of landslides in the Falkland Islands, located 1500 km from the present study site. The combination of current velocity data and modeled sediment thickness in this study provides compelling evidence for a similar ACC-driven mechanism governing landslide dynamics in the South Sandwich Islands, and merits further investigation.
Depth was the second most important factor, with nearly all slides occurring above 1000 m, despite more than 90 % of the study area being located below this depth range, which is consistent with the decreasing influence of waves and currents at greater depths and sediment accumulation on upper slopes. This result supports results previously found in submarine landslide studies (Borrell et al., 2016; Dyer, 2022; Du et al., 2022).
Surprisingly, slope, which is typically a crucial factor in both terrestrial and submarine studies (e.g., Reichenbach et al., 2018; Innocenti et al., 2020), was among the least significant. While the correlation between susceptibility and slope is site-specific, depending on the unique variables present in a given study area, a greater occurrence of landslides is generally expected with increasing slope angle. In this study, the highest susceptibility occurred on slopes between 15-20°, decreasing for steeper slopes. A similar outcome was reported by Avdievitch & Coe (2022), who suggested two possible explanations: either there is truly a lower frequency of landslides on steeper slopes, or the apparent decrease in susceptibility is due to undetected landslides, resulting from a lack of observable scarps or limited spatial coverage. Prancevic et al. (2020) theorized that smaller-scale landslides tend to occur on steep slopes, limiting the number of larger-scale, and thus more detectable, landslides that would otherwise be expected.
The resolution of the input datasets used for the causative factor maps has a direct impact on the quality and accuracy of the resulting landslide susceptibility model. In this study, all the modelled causative factor layers had coarse resolutions, ranging from 5–10 km (Table 1). These coarse resolutions can introduce inaccuracies into the LSM. For example, the LSM exhibits rectangular patterns in certain areas that correspond to the spatial distribution of the sediment thickness layer, suggesting the model may have assigned excessive weight to this parameter. Similarly, the current velocity layers, while still providing valuable information, may not fully capture localized flow patterns and seafloor interactions that could influence landslide susceptibility. Ideally, higher resolution data would be used for all causative factors to better represent the complex interactions and terrain variability within the study area, however, primary data collection in this remote region can be difficult and costly.
Overall, this study has successfully created a reliable and accurate landslide susceptibility map for the spatial prediction of future landslides in the South Sandwich Islands. While comparisons to other LSM studies can be challenging due to differences in time scales, data resolution and availability, and predisposing factors (Conforti & Letto, 2021), this study achieves AUC values (0.76 and 0.78) consistent with the typical range of 0.7 – 0.9 reported for other submarine landslide studies (Innocenti et al., 2020; Dyer et al., 2022). Terrestrial LSM studies often achieve higher AUC values (>0.80), likely due to greater data availability and resolution (Acharya & Lee, 2018; Amaliah et al., 2021; Genene & Meten, 2021; Rasyid, Bhandary & Yatabe, 2016). An advantage of this study is the use of PR values to indicate the significance of each causative factor, an approach employed by few other FR studies.
4.3 Limitations of the study
Despite the advantages of this study, these results must be interpreted with caution and some limitations should be acknowledged. Firstly, regarding landslide identification, the resolution of the multibeam bathymetric data (100 m) is sufficient for identifying large-scale landslides but may have prevented the detection of smaller-scale events. This limitation could be a contributing factor to the relatively low significance of the slope factor in the susceptibility model, as explained previously.
Furthermore, the landslide inventory does not distinguish between failure mechanisms or source and deposit areas. Different failure types may be influenced by varying factors, and there could be considerable differences in environmental conditions between source points and deposits, which the LSM does not account for (Collico et al., 2020).
The varying resolutions of causative factor layers, particularly the coarse modelled data for Bouguer gravity anomaly and magnetic anomaly (5 km), current velocity (7 km) and sediment thickness (10 km) data, introduce uncertainties and decrease model accuracy by failing to capture localized patterns. Additionally, the absence of lithology data, a highly significant factor in many studies, is a limitation of this research.
These limitations highlight the need for higher-resolution data, a deeper understanding of failure mechanisms and sediment characteristics. Addressing these limitations could significantly improve the accuracy and reliability of landslide susceptibility assessments in the South Sandwich Islands region.
5 Conclusion
This study represents the first comprehensive assessment of submarine landslide susceptibility in the remote South Sandwich Islands region of the Southern Atlantic Ocean. By integrating a detailed landslide inventory map with various geomorphic, geophysical, and oceanographic causative factors, a landslide susceptibility model was developed using the FR statistical approach. The resulting LSM provides valuable insights into the spatial distribution of landslide hazards in this understudied volcanic arc environment.
The key findings of this research highlight the critical influence of current velocity, depth, and seismicity on slope instability in the South Sandwich Islands. Notably, northward current velocity emerged as the most significant causative factor, likely attributed to the region’s proximity to the Antarctic Circumpolar Current. This finding emphasizes the importance of considering regional oceanographic patterns in assessing submarine landslide susceptibility.
While the LSM demonstrated good performance, with AUC values of 0.76 and 0.78 for success and prediction rates respectively, several limitations must be acknowledged. The coarse resolutions of certain input datasets, such as current velocity, sediment thickness, and gravity/magnetic anomalies, introduced uncertainties and potential biases in the model output. Additionally, the lack of distinction between failure mechanisms and source/deposit areas in the landslide inventory may have impacted the model’s accuracy. Despite these limitations, the LSM provides a valuable baseline for understanding landslide dynamics and susceptibility in this remote region. The findings of this study can inform future research efforts, hazard assessments, and risk mitigation strategies related to landslide-induced tsunamis in the South Sandwich Islands and other similar volcanic arc settings.
References
Acharya, T. D. and Lee, D. H. (2018). Landslide Susceptibility Mapping Using Relative Frequency and Predictor Rate along Araniko Highway. KSCE Journal of Civil Engineering, 23(2), pp. 763–776. https://doi.org/10.1007/s12205-018-0156-x
Alkhasawneh, M. Sh., Ngah, U. K., Tay, L. T., Mat Isa, N. A. and Al-batah, M. S. (2013). Determination of Important Topographic Factors for Landslide Mapping Analysis Using MLP Network. The Scientific World Journal, pp. 1–12. https://doi.org/10.1155/2013/415023
Allen, C. S. and Smellie, J. L. (2008). Volcanic Features and the Hydrological Setting of Southern Thule, South Sandwich Islands. Antarctic Science, 20(3), pp. 301–308. https://doi.org/10.1017/s0954102008001156
Amaliah, R., Soma, A. S., Mappangaja, B. and Mambela, F. (2021). Analysis of the Landslide Susceptibility Map Using Frequency Ratio Method in sub-sub-Watershed Mamasa. IOP Conference Series: Earth and Environmental Science, 886(1), pp. 012088–012088. https://doi.org/10.1088/1755-1315/886/1/012088
Avdievitch, N. N. and Coe, J. A. (2022). Submarine Landslide Susceptibility Mapping in Recently Deglaciated Terrain, Glacier Bay, Alaska. Frontiers in Earth Science, 10. https://doi.org/10.3389/feart.2022.821188
Borrell, N., Somoza, L., León, R., Medialdea, T., Gonzalez, F. J. and Gimenez-Moreno, C. J. (2016). GIS Catalogue of Submarine Landslides in the Spanish Continental Shelf: Potential and Difficulties for Susceptibility Assessment. Advances in Natural and Technological Hazards Research, pp. 499–508. https://doi.org/10.1007/978-3-319-20979-1_50
Chang, Y., Mitchell, N. C. and Quartau, R. (2021). Landslides in the Upper Submarine Slopes of Volcanic Islands: The Central Azores. Geochemistry, Geophysics, Geosystems, 22(10). https://doi.org/10.1029/2021gc009833
Chen, J., Yang, S. T., Li, H. W., Zhang, B. and Lv, J. R. (2013). Research on Geographical Environment Unit Division Based on the Method of Natural Breaks (Jenks). ISPRS – International Archives of the Photogrammetry, Remote Sensing and Spatial Information Sciences, XL-4/W3, pp. 47–50. https://doi.org/10.5194/isprsarchives-xl-4-w3-47-2013
Chiba, T., Suzuki, Y. and Hiramatsu, T. (2007). Digital Terrain Representation Methods and Red Relief Image Map, a New Visualization Approach. Map, Journal of the Japan Cartographers Association, 45(1), pp. 27–36. https://doi.org/10.11212/jjca1963.45.27
Choi, Y., Dyment, J., Lesur, V., Garcia Reyes, Catalan, M., Ishihara, T., Litvinova, T., Hamoudi, M., the WDMAM Task Force*, and the WDMAM Data Providers** (n.d.) World Digital Magnetic Anomaly Map. Version 2.1. http://www.wdmam.org (accessed 25 February 2025).
Clare, M. A., Hughes Clarke, J. E., Talling, P. J., Cartigny, M. J. B. and Pratomo, D. G. (2016). Preconditioning and Triggering of Offshore Slope Failures and Turbidity Currents Revealed by Most Detailed Monitoring yet at a fjord-head Delta. Earth and Planetary Science Letters, 450(450), pp. 208–220. https://doi.org/10.1016/j.epsl.2016.06.021
Collico, S., Arroyo, M., Urgeles, R., Gràcia, E., Devincenzi, M. and Peréz, N. (2020). Probabilistic Mapping of earthquake-induced Submarine Landslide Susceptibility in the South-West Iberian Margin. Marine Geology, 429, p.106296. https://doi.org/10.1016/j.margeo.2020.106296 References
Collins, M. A., Hart, T., Hogg, O. T., Collins, M. A., Hollyman, P. R., Liszka, C. M., Stewart, H. A. and Trathan, P. N. (2022). South Sandwich Islands – An understudied isolated Southern Ocean archipelago. Deep Sea Research Part II: Topical Studies in Oceanography, 201, pp. 105121–105121. https://doi.org/10.1016/j.dsr2.2022.105121
Conforti, M. and Letto, F. (2021). Modeling Shallow Landslide Susceptibility and Assessment of the Relative Importance of Predisposing Factors, through a GIS-Based Statistical Analysis. Geosciences, 11(8), p. 333. https://doi.org/10.3390/geosciences11080333
Dragani, W. C., D’Onofrio, E. E., Grismeyer, W., Fiori, M. M. E., Violante, R. A. and Rovere, E. I. (2008). Vulnerability of the Atlantic Patagonian coast to tsunamis generated by submarine earthquakes located in the Scotia Arc region. Some numerical experiments. Natural Hazards, 49(3), pp. 437–458. https://doi.org/10.1007/s11069-008-9289-4
Du, X., Sun, Y., Song, Y., Xiu, Z. and Su, Z. (2022). Submarine Landslide Susceptibility and Spatial Distribution Using Different Unsupervised Machine Learning Models. Applied sciences, 12(20), pp. 10544–10544. https://doi.org/10.3390/app122010544
Dyer, A. S., Mark-Moser, M., Duran, R. and Bauer, J. (2022). Offshore Application of Landslide Susceptibility Mapping Using Gradient Boosted Decision Trees: A Gulf of Mexico Case Study. Research Square. https://doi.org/10.21203/rs.3.rs-2070041/v1
Gallotti, G., Zaniboni, F., Pagnoni, G., Romagnoli, C., Gamberi, F., Marani, M. and Tinti, S. (2020). Tsunamis from Prospected Mass Failure on the Marsili Submarine Volcano Flanks and Hints for Tsunami Hazard Evaluation. Bulletin of Volcanology, 83(1). https://doi.org/10.1007/s00445-020-01425-0
GEBCO (2023). The GEBCO_2023 – Grid a continuous terrain model of the global oceans and land. NERC EDS British Oceanographic Data Centre NOC. https://doi.org/10.5285/f98b053b-0cbc-6c23-e053-6c86abc0af7b
CMEMS (2023). Global Ocean Physics Reanalysis. E.U. Copernicus Marine Service Information (CMEMS), Marine Data Store (MDS). https://doi.org/10.48670/moi-00021
Genene, A. and Meten, M. (2021). Landslide Susceptibility Mapping Using GIS-based Information Value and Frequency Ratio Methods in Gindeberet area, West Shewa Zone, Oromia Region, Ethiopia. Research Square. https://doi.org/10.21203/rs.3.rs-219331/v1
Getachew, N. and Meten, M. (2021). Weights of Evidence Modeling for Landslide Susceptibility Mapping of Kabi-Gebro locality, Gundomeskel area, Central Ethiopia. Geoenvironmental Disasters, 8(1). https://doi.org/10.1186/s40677-021-00177-z
Hogg, O. T., Downie, A.-L., Vieira, R. P. and Darby, C. (2021). Macrobenthic Assessment of the South Sandwich Islands Reveals a Biogeographically Distinct Polar Archipelago. Frontiers in Marine Science, 8. https://doi.org/10.3389/fmars.2021.650241
Innocenti, C., Battaglini, L., D’Angelo, S. and Fiorentino, A. (2020). Submarine landslides: mapping the susceptibility in European seas. Quarterly Journal of Engineering Geology and Hydrogeology, 54(1). https://doi.org/10.1144/qjegh2020-027
Islam, F., Riaz, S., Ghaffar, B., Tariq, A., Shah, S. U., Nawaz, M., Hussain, M. L., Amin, N. U., Li, Q., Lu, L., Shah, M. and Aslam, M. (2022). Landslide susceptibility mapping (LSM) of Swat District, Hindu Kush Himalayan region of Pakistan, using GIS-based bivariate modeling. Frontiers in Environmental Science, 10. https://doi.org/10.3389/fenvs.2022.1027423
Jia, Z., Zhan, Z. and Kanamori, H. (2022). The 2021 South Sandwich Island M w 8.2 Earthquake: A Slow Event Sandwiched Between Regular Ruptures. Geophysical Research Letters, 49(3). https://doi.org/10.1029/2021gl097104
Karstens, J., Kelfoun, K., Watt, S. F. L. and Berndt, C. (2020). Combining 3D seismics, eyewitness accounts and numerical simulations to reconstruct the 1888 Ritter Island sector collapse and tsunami. International Journal of Earth Sciences, 109(8), pp. 2659–2677. https://doi.org/10.1007/s00531-020-01854-4
Leat, P. T., Day, S. J., Tate, A. J., Martin, T. J., Owen, M. J. and Tappin, D. R. (2013). Volcanic Evolution of the South Sandwich Volcanic arc, South Atlantic, from Multibeam Bathymetry. Journal of Volcanology and Geothermal Research, 265, pp. 60–77. https://doi.org/10.1016/j.jvolgeores.2013.08.013
Leat, P. T., Fretwell, P. T., Tate, A. J., Larter, R. D., Martin, T. J., Smellie, J. L., Jokat, W. and Bohrmann, G. (2014). Bathymetry and Geological Setting of the South Sandwich Islands Volcanic Arc. Antarctic Science, 28(4), pp. 293–303. https://doi.org/10.1017/s0954102016000043
Leat, P. T., Smellie, J. L., Millar, I. L. and Larter, R. D. (2003). Magmatism in the South Sandwich Arc. Geological Society, London, Special Publications, 219(1), pp. 285–313. https://doi.org/10.1144/gsl.sp.2003.219.01.14
Lee, S. and Pradhan, B. (2006). Landslide Hazard Mapping at Selangor, Malaysia Using Frequency Ratio and Logistic Regression Models. Landslides, 4(1), pp. 33–41. https://doi.org/10.1007/s10346-006-0047-y
Lee, S. and Talib, J. A. (2005). Probabilistic Landslide Susceptibility and Factor Effect Analysis. Environmental Geology, 47(7), pp. 982–990. https://doi.org/10.1007/s00254-005-1228-z
Masson, D. G., Harbitz, C. B., Wynn, R. B., Pedersen, G. and Løvholt, F. (2006). Submarine landslides: processes, triggers and hazard prediction. Philosophical Transactions of the Royal Society A: Mathematical, Physical and Engineering Sciences, 364(1845), pp. 2009–2039. https://doi.org/10.1098/rsta.2006.1810
Mersha, T. and Meten, M. (2020). GIS-based Landslide Susceptibility Mapping and Assessment Using Bivariate Statistical Methods in Simada area, Northwestern Ethiopia. Geoenvironmental Disasters, 7(1). https://doi.org/10.1186/s40677-020-00155-x
Mirnazari, M., Javad, J., Ahmad, A., Baharin, B., Mojaradi, M., Barat, B., Sattari, S. and Farshid, F. (2014). Using Frequency Ratio Method for Spatial Landslide Prediction. Research Journal of Applied Sciences, Engineering and Technology, 7(15), pp. 3174–3180. https://doi.org/10.19026/rjaset.7.658
Nicholson, U., Libby, S., Tappin, D. R. and McCarthy, D. (2020). The Subantarctic Front as a Sedimentary Conveyor Belt for Tsunamigenic Submarine Landslides. Marine Geology, 424, p. 106161. https://doi.org/10.1016/j.margeo.2020.106161
Oh, H.-J., Lee, S. and Hong, S.-M. (2017). Landslide Susceptibility Assessment Using Frequency Ratio Technique with Iterative Random Sampling. Journal of Sensors, pp. 1–21. https://doi.org/10.1155/2017/3730913
Orsi, A. H. and Harris, U. (2019). Fronts of the Antarctic Circumpolar Current – GIS data. Ver. 1, Australian Antarctic Data Centre. https://data.aad.gov.au/metadata/antarctic_circumpolar_current_fronts (accessed 25 February 2025).
Prancevic, J. P., Lamb, M. P., McArdell, B. W., Rickli, C. and Kirchner, J. W. (2020). Decreasing Landslide Erosion on Steeper Slopes in Soil-Mantled Landscapes. Geophysical Research Letters, 47(10). https://doi.org/10.1029/2020gl087505
Rahman, G., Rahman, A. U., Bacha, A. S., Mahmood, S., Moazzam, M. F. U and Lee, G. L. (2020). Assessment of Landslide Susceptibility Using Weight of Evidence and Frequency Ratio Model in Shahpur valley, Eastern Hindu Kush. Natural Hazards and Earth System Sciences Discussions, pp. 1–19. https://doi.org/10.5194/nhess-2020-167
Rasyid, A. R., Bhandary, N. P. and Yatabe, R. (2016). Performance of Frequency Ratio and Logistic Regression Model in Creating GIS Based Landslides Susceptibility Map at Lompobattang Mountain, Indonesia. Geoenvironmental Disasters, 3(1). https://doi.org/10.1186/s40677-016-0053-x
Reichenbach, P., Rossi, M., Malamud, B. D., Mihir, M. and Guzzetti, F. (2018). A review of statistically-based landslide susceptibility models. Earth-Science Reviews, 180, pp. 60–91. https://doi.org/10.1016/j.earscirev.2018.03.001
Shan, Z., Guo, F., Lai, X. and Xiao, J. (2021). Assessment of Submarine Landslide Susceptibility in the Sea Area of Zhoushan. IOP Conference Series: Earth and Environmental Science, 734(1), pp. 012023–012023. https://doi.org/10.1088/1755-1315/734/1/012023
Silalahi, F. E. S., Pamela, Arifianti, Y. and Hidayat, F. (2019). Landslide susceptibility assessment using frequency ratio model in Bogor, West Java, Indonesia. Geoscience Letters, 6(1). https://doi.org/10.1186/s40562-019-0140-4
Stoecklin, A., Friedli, B. and Puzrin, A. M. (2017). Sedimentation as a Control for Large Submarine Landslides: Mechanical Modeling and Analysis of the Santa Barbara Basin. Journal of Geophysical Research, Solid Earth, 122(11), pp. 8645–8663. https://doi.org/10.1002/2017jb014752
Straume, E. O., Gaina, C., Medvedev, S., Hochmuth, K., Gohl, K., Whittaker, J. M., Abdul Fattah, R., Doornenbal, J. C. and Hopper, J. R. (2019). GlobSed: Updated Total Sediment Thickness in the World’s Oceans. Geochemistry, Geophysics, Geosystems, 20(4), pp. 1756–1772. https://doi.org/10.1029/2018gc008115
Thapa, D. and Bhandari, B. P. (2019). GIS-Based Frequency Ratio Method for Identification of Potential Landslide Susceptible Area in the Siwalik Zone of Chatara-Barahakshetra Section, Nepal. Open Journal of Geology, 9(12), pp. 873–896. https://doi.org/10.4236/ojg.2019.912096
Thorpe, S. E. and Murphy, E. J. (2022). Spatial and Temporal Variability and Connectivity of the Marine Environment of the South Sandwich Islands, Southern Ocean. Deep Sea Research Part II: Topical Studies in Oceanography, 198, p.105057. https://doi.org/10.1016/j.dsr2.2022.105057
USGS (2017). Advanced National Seismic System (ANSS) Comprehensive Catalog. U.S. Geological Survey. https://doi.org/10.5066/F7MS3QZH
Youssef, B., Bouskri, I., Brahim, B., Kader, S., Brahim, I., Abdelkrim, B. and Spalevi V. (2023). The Contribution of the Frequency Ratio Model and the Prediction Rate for the Analysis of Landslide Risk in the Tizi N’tichka Area on the National Road (RN9) Linking Marrakech and Ouarzazate. CATENA, 232, pp. 107464–107464. https://doi.org/10.1016/j.catena.2023.107464
Appendix


Author’s biography

Julia Swedenklef earned her Bachelor’s degree in Ocean Exploration and Surveying from the University of Plymouth in 2024. Throughout her studies, she developed an interest in the process of combining bathymetric data with geological datasets, which led to her dissertation on landslide susceptibility mapping for the South Sandwich Islands. Currently, Julia works at Jan De Nul, where she conducts hydrographic and topographic surveys to support dredging and land reclamation projects. In this position she is further expanding her practical knowledge of survey equipment and reinforcing her passion for processing and analyzing unique datasets.