


Abstract
1 Introduction
Maintaining ports as critical components of the goods transportation network and primary gateways for passenger transport is essential, placing them as pivotal elements of the blue economy (Tajfirouz et al., 2022; Motallebi Korbekandi & Zare Zardeyni, 2022). In this regard, ensuring sufficient navigational depth in ports and waterways for the safe passage of vessels remains a key priority for the relevant authorities. Consequently, the routine monitoring of seabed alterations in ports and maritime channels has become a major focus for planners in national port management and navigation. Accurately identifying waterways and measuring seabed depth and its fluctuations (bathymetry) through the use of advanced tools to update seabed maps is a globally accepted practice (Saeidi et al., 2023). While optical remote sensing tools and satellite imagery have facilitated depth estimation, the effectiveness of this technology is highly dependent on favorable weather conditions, image clarity, and is constrained to shallow, clear (non-turbid) waters (Bandini et al., 2018). Despite advancements in remote sensing technologies, including machine learning algorithms for hydrographic mapping, the accuracy of these depth measurements remains inferior to that achieved using acoustic equipment (Saeidi et al., 2023; Pike et al., 2019). Among acoustic devices, the multi-beam echo sounder (MBES) has gained significant attention in national ports over the last decade. The volume of data captured by MBES is exponentially higher than that of single-beam echo sounders (SBES), providing continuous seabed coverage, which accelerates depth measurement and reduces field operation times (Costa et al., 2009). However, the accuracy of MBES measurements is not uniform, varying based on multiple factors. In particular, at the edges of survey swaths, refraction errors and other inaccuracies must be addressed. Given that depth data is costly, scarce and considering the dynamic nature of the seabed, detailed analysis and comparison of data from SBES and MBES in existing areas can help clarify the errors in MBES measurements. Notably, limited research has been conducted on comparing SBES and MBES data, largely due to the high costs and difficulty of obtaining such data from two different sensors within a reasonable timeframe. In their thesis, Shamai Gahfarokhi explored various methods for sorting MBES data and different interpolation techniques for surface point elevations, ultimately developing an optimal model for aligning data from MBES and SBES while enhancing the accuracy of surveyed edges (Ghahfarokhi, 2020). A 2021 study in Indonesia evaluated the quality and discrepancies between MBES and SBES data in relation to the IHO S-44 standard (Pratomo & Saputro, 2021). Another study in Australia focused on creating maps of seabed biological habitats using the return energy from both MBES and SBES, though it did not address depth measurement or its accuracy (Parnum et al., 2009). Similarly, a separate study classified seabed materials based on the return energy from MBES devices (Zhi et al., 2014). However, no comprehensive investigation has yet examined the statistical differences, correlations, and three-dimensional surface information derived from MBES and SBES data in Iranian ports. Therefore, this study aims to compare MBES and SBES data in the port of Bushehr.
The primary objectives of the current research are outlined as follows:
- To evaluate the accuracy of processed MBES data in the Port of Bushehr concerning compliance with the IHO S-44 standard.
- To compare the processed data from both MBES and SBES concerning adherence to the IHO S-44 standard.
- To assess the digital elevation models (DEMs) derived from MBES and SBES data.
- To develop a model for fitting and correlating the differences observed between the MBES and SBES datasets.
- To analyze the volumetric discrepancies between the two surfaces generated from MBES and SBES data.
Given that the application of MBES in the coastal regions of Iran has only recently commenced, and that the majority of hydrographic activities in the country have historically relied on SBES (INCC, 2020), this research represents a significant advancement in optimizing both costs and time associated with hydrographic operations. Furthermore, the processing and evaluation of MBES performance, including its beam angles and their influence on depth accuracy, will provide valuable insights for other researchers and relevant organizations in the selection and application of this technology in hydrographic projects.
2 Study area
The study area for this research is the Port of Bushehr, situated in the Persian Gulf in southern Iran. This region experiences an average temperature of 25 °C and is characterized by a hot and humid climate, with an annual average precipitation of 206 mm (Sotoudehpour et al., 2020). The Port of Bushehr features a channel and access passage that extends approximately 16 km, facilitating maritime navigation, with continuous and periodic dredging and depth measurements conducted in this channel. The geographical coordinates of the study area range from 28° 57′ 30″ to 29° 01′ 30″ north and from 50° 44′ 30″ to 50° 51′ 30″ east (Fig. 1).
3 Data
Given the size of the basin and access channel of Bushehr Port, this research focuses on the internal channel area, utilizing depth measurements acquired from both MBES and SBES in the waters surrounding Bushehr Port. This selection is motivated by the flat seabed region and the ongoing dredging activities in the outer section of the access channel. The processed data, which accounts for sound speed, tidal influences, and error corrections, were employed in the analysis. In this study, the reference elevation surface for depth measurements is established based on chart datum, which is closely aligned with the Lowest Astronomical Tide.

4 Methodology
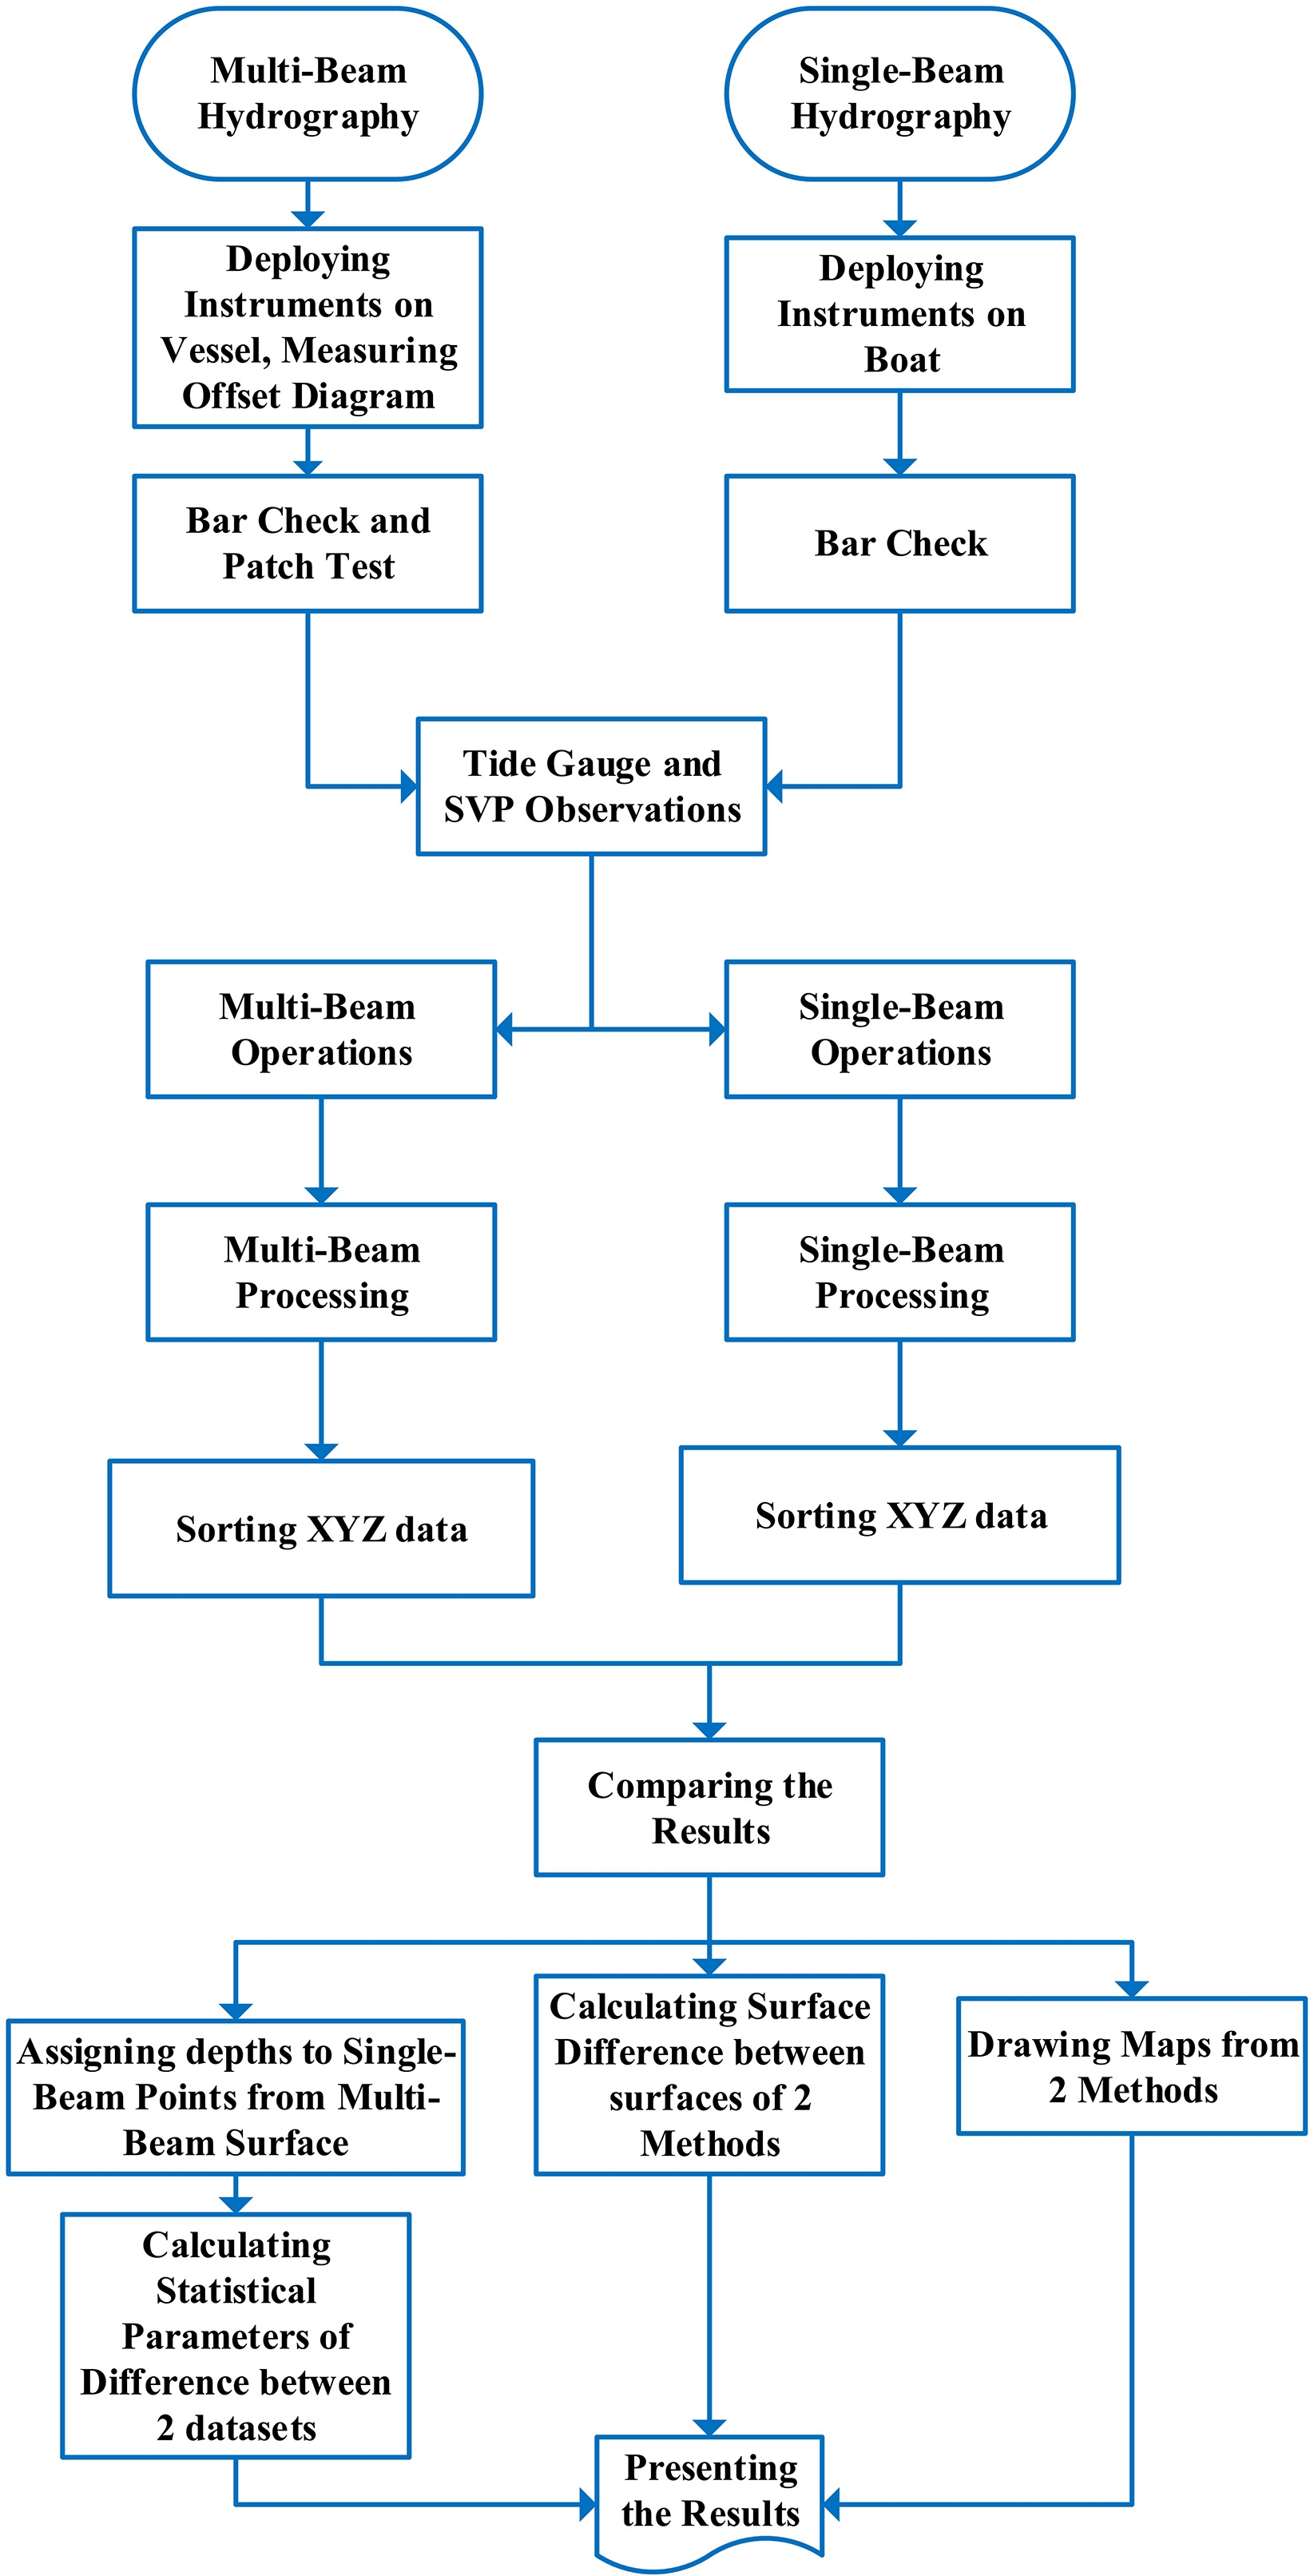
The MBES depth data were processed utilizing average sorting methods in the Hypack Software (version 2017), which were modeled as mathematical procedures. Following this, the depths of SBES data points were linearly interpolated onto these surfaces to derive corresponding depth values. The next phase involved a statistical comparison of these estimates to evaluate the differences between elevation values modeled and those determined in Section 5.6. Subsequently, the selected model was applied to the SB depth data, assessing its compliance with the nominal accuracy as defined by the IHO S-44 standard. Ultimately, a comparison was made between the depth data acquired from both SBES and MBES at Bushehr Port, and maps of the region were generated and analyzed using both datasets. Furthermore, the volumetric difference between the two DEMs was calculated and compared. Fig. 2 presents a flowchart illustrating the research process.
4.1 Corrections and calibration of instruments
4.1.1 Tidal corrections
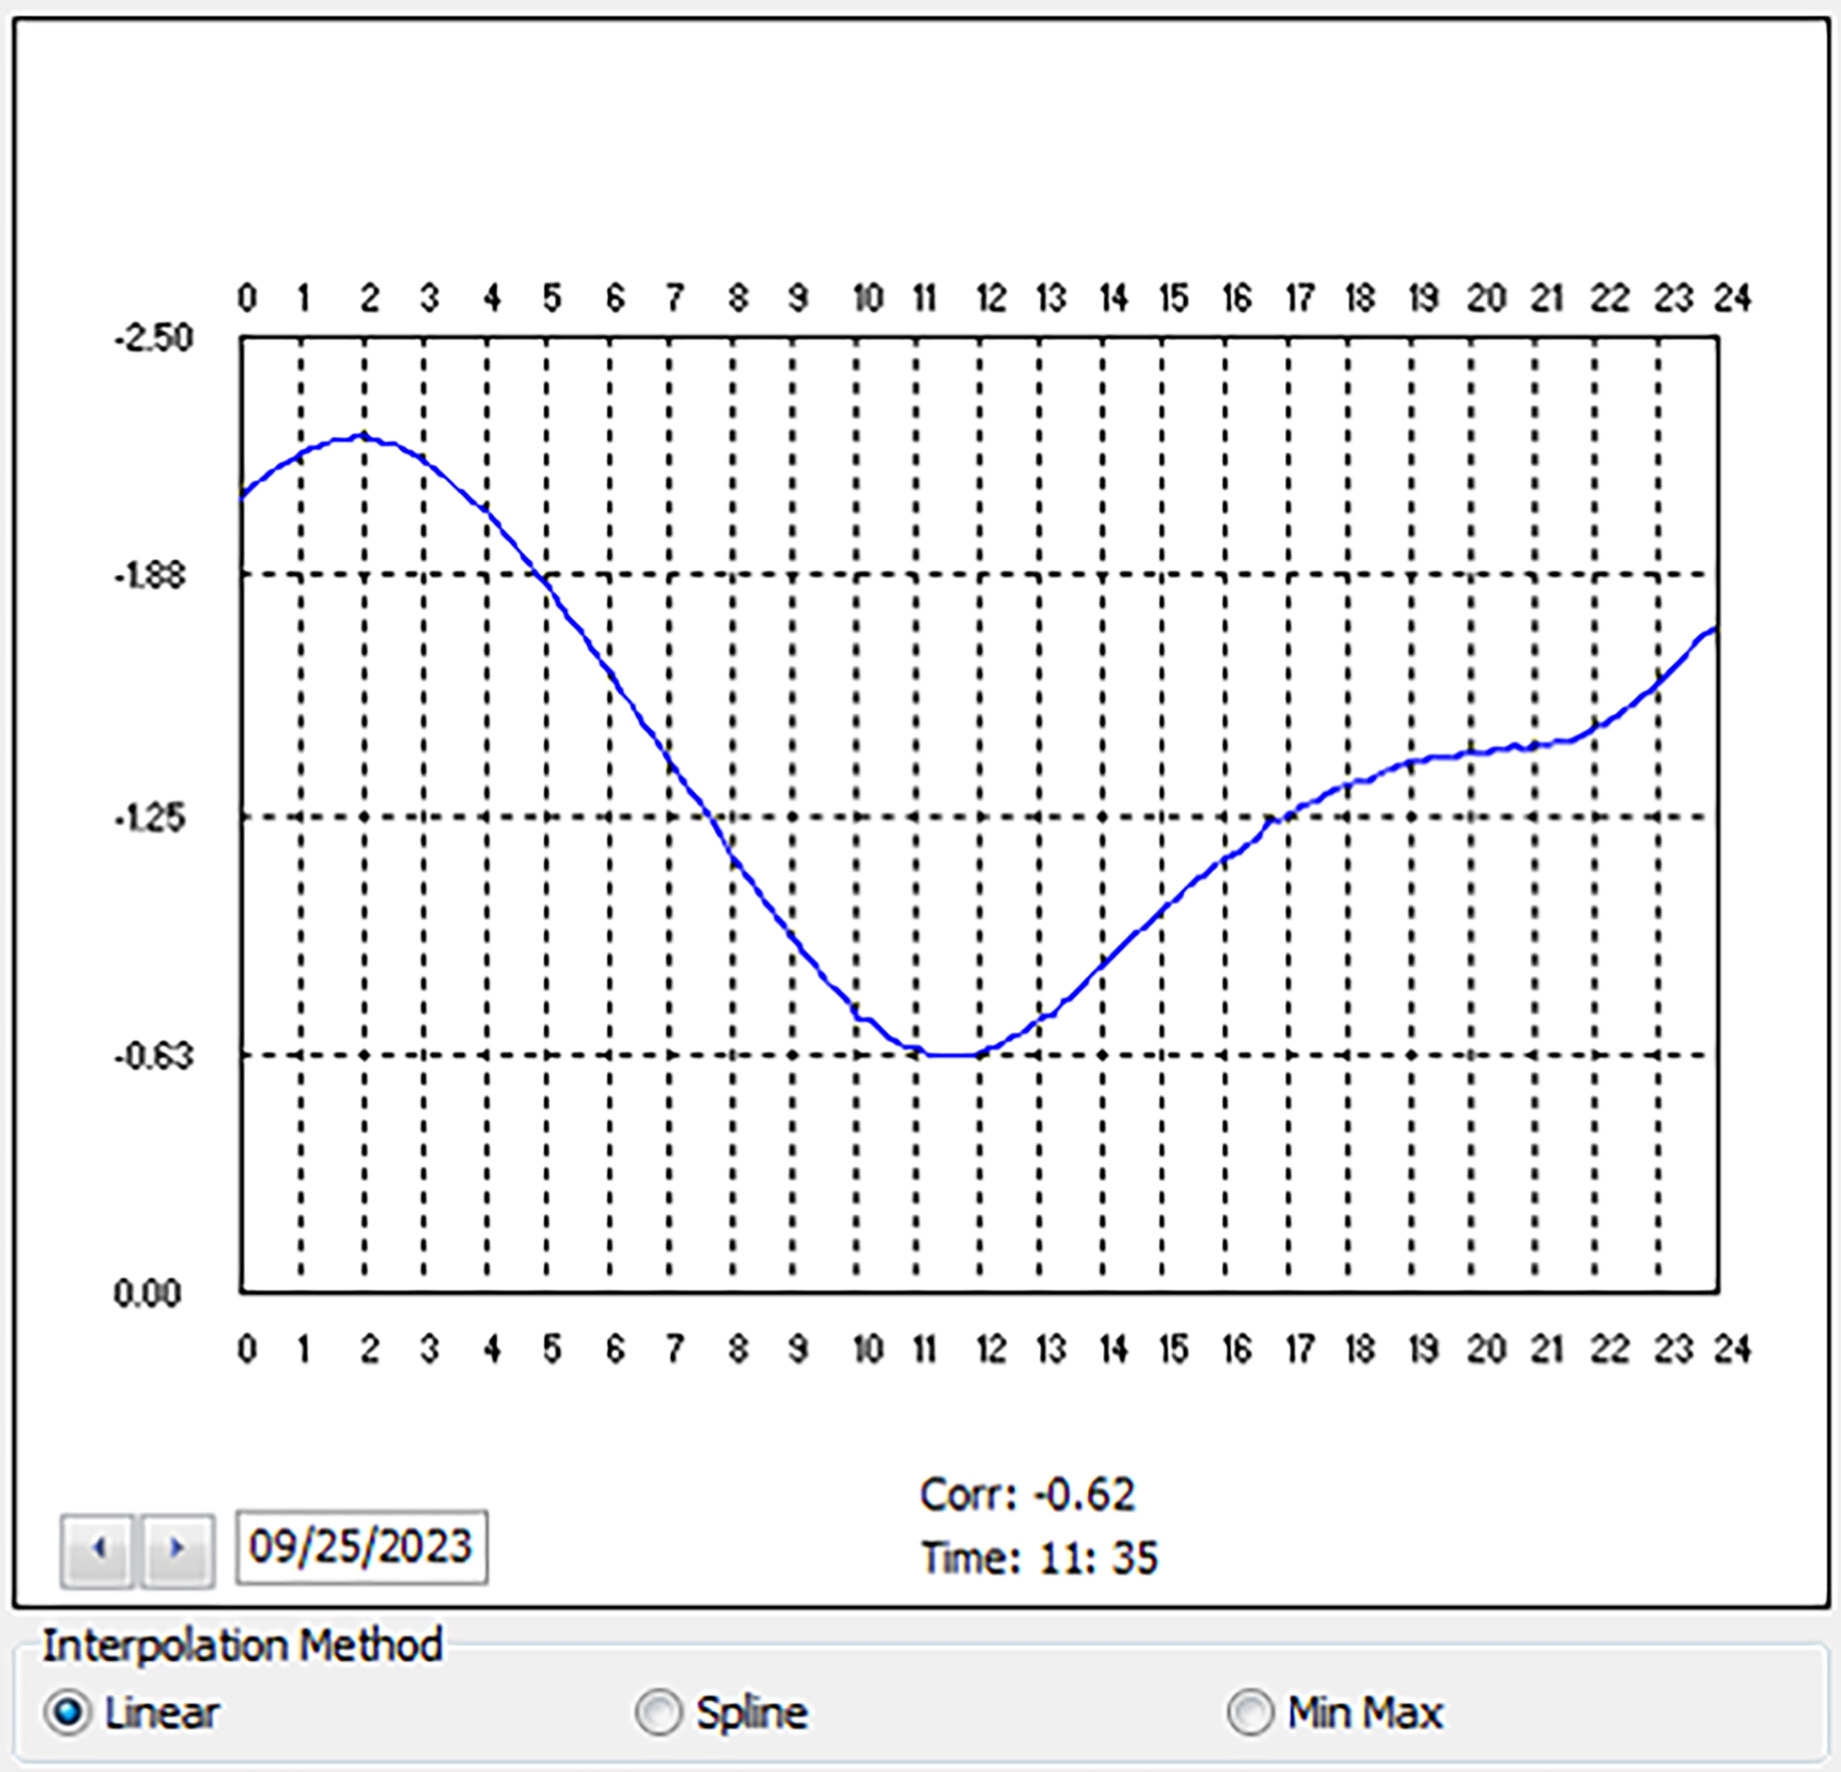
In both MBES and SBES depth sounding methods, it is essential to concurrently measure the water level in relation to chart datum during hydrographic operations. Figure 3 illustrates the Hypack format used for tide corrections. This simultaneous measurement allows for the determination of elevations at sounding locations on the seabed relative to chart datum using the recorded depths. To achieve this, an automatic tide gauge from the Ports and Maritime Organization, positioned at Bushehr Port, was utilized. The zero level of the tidal staff was calibrated to the benchmark BM-CYDS1014, which has a known elevation above chart datum. The elevation of this benchmark in relation to the chart datum is 4.141 m, establishing the zero level of the tidal staff at 0.75 m above the chart datum. The automatic tide gauge recorded tidal levels every 10 minutes, which were subsequently converted to elevations relative to chart datum during the post-processing phase.
4.1.2 Measuring sound speed in water
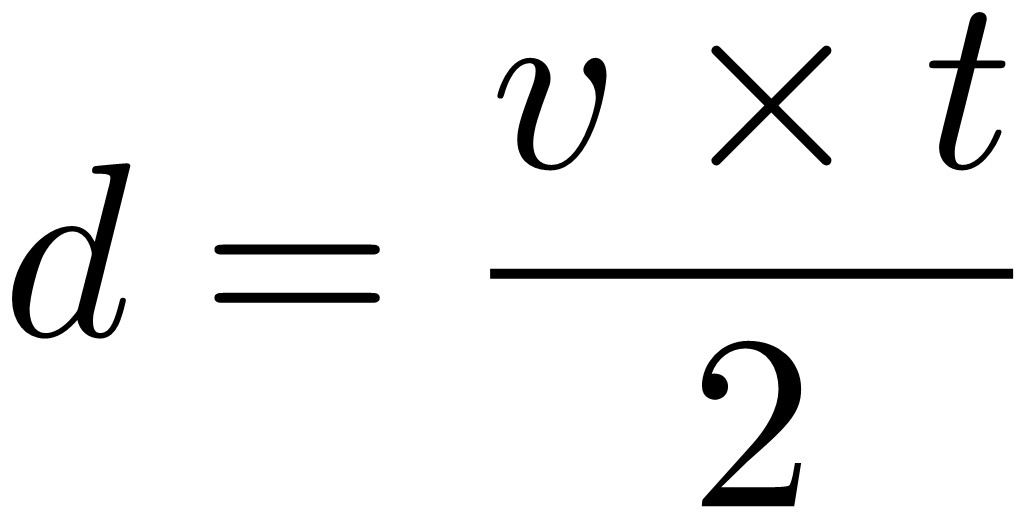
Both SBES and MBES operate based on the same physical principles for measuring water depth (Pratomo & Saputro, 2021). The echo sounder emits electrical signals, which are converted into sound waves through a transducer and transmitted into the water. When these sound waves encounter the seabed, they are reflected back to the device. By measuring the time taken for the waves to travel to the seabed and return, the depth d in meter, or the distance from the transducer to the seabed can be calculated using the following Eq. 1:
 |
(1) |
In Eq. 1, the time t, measured in seconds, is recorded by the echo sounder, while v denotes the speed of sound in water, expressed in m/s. The sound speed varies based on three parameters: the electrical conductivity of seawater (salinity), temperature, and the hydrostatic pressure of the water column (depth). Consequently, it is essential to calibrate the echo sounder at least twice or more per day according to the sound velocity variations using a sound velocity profiler device.
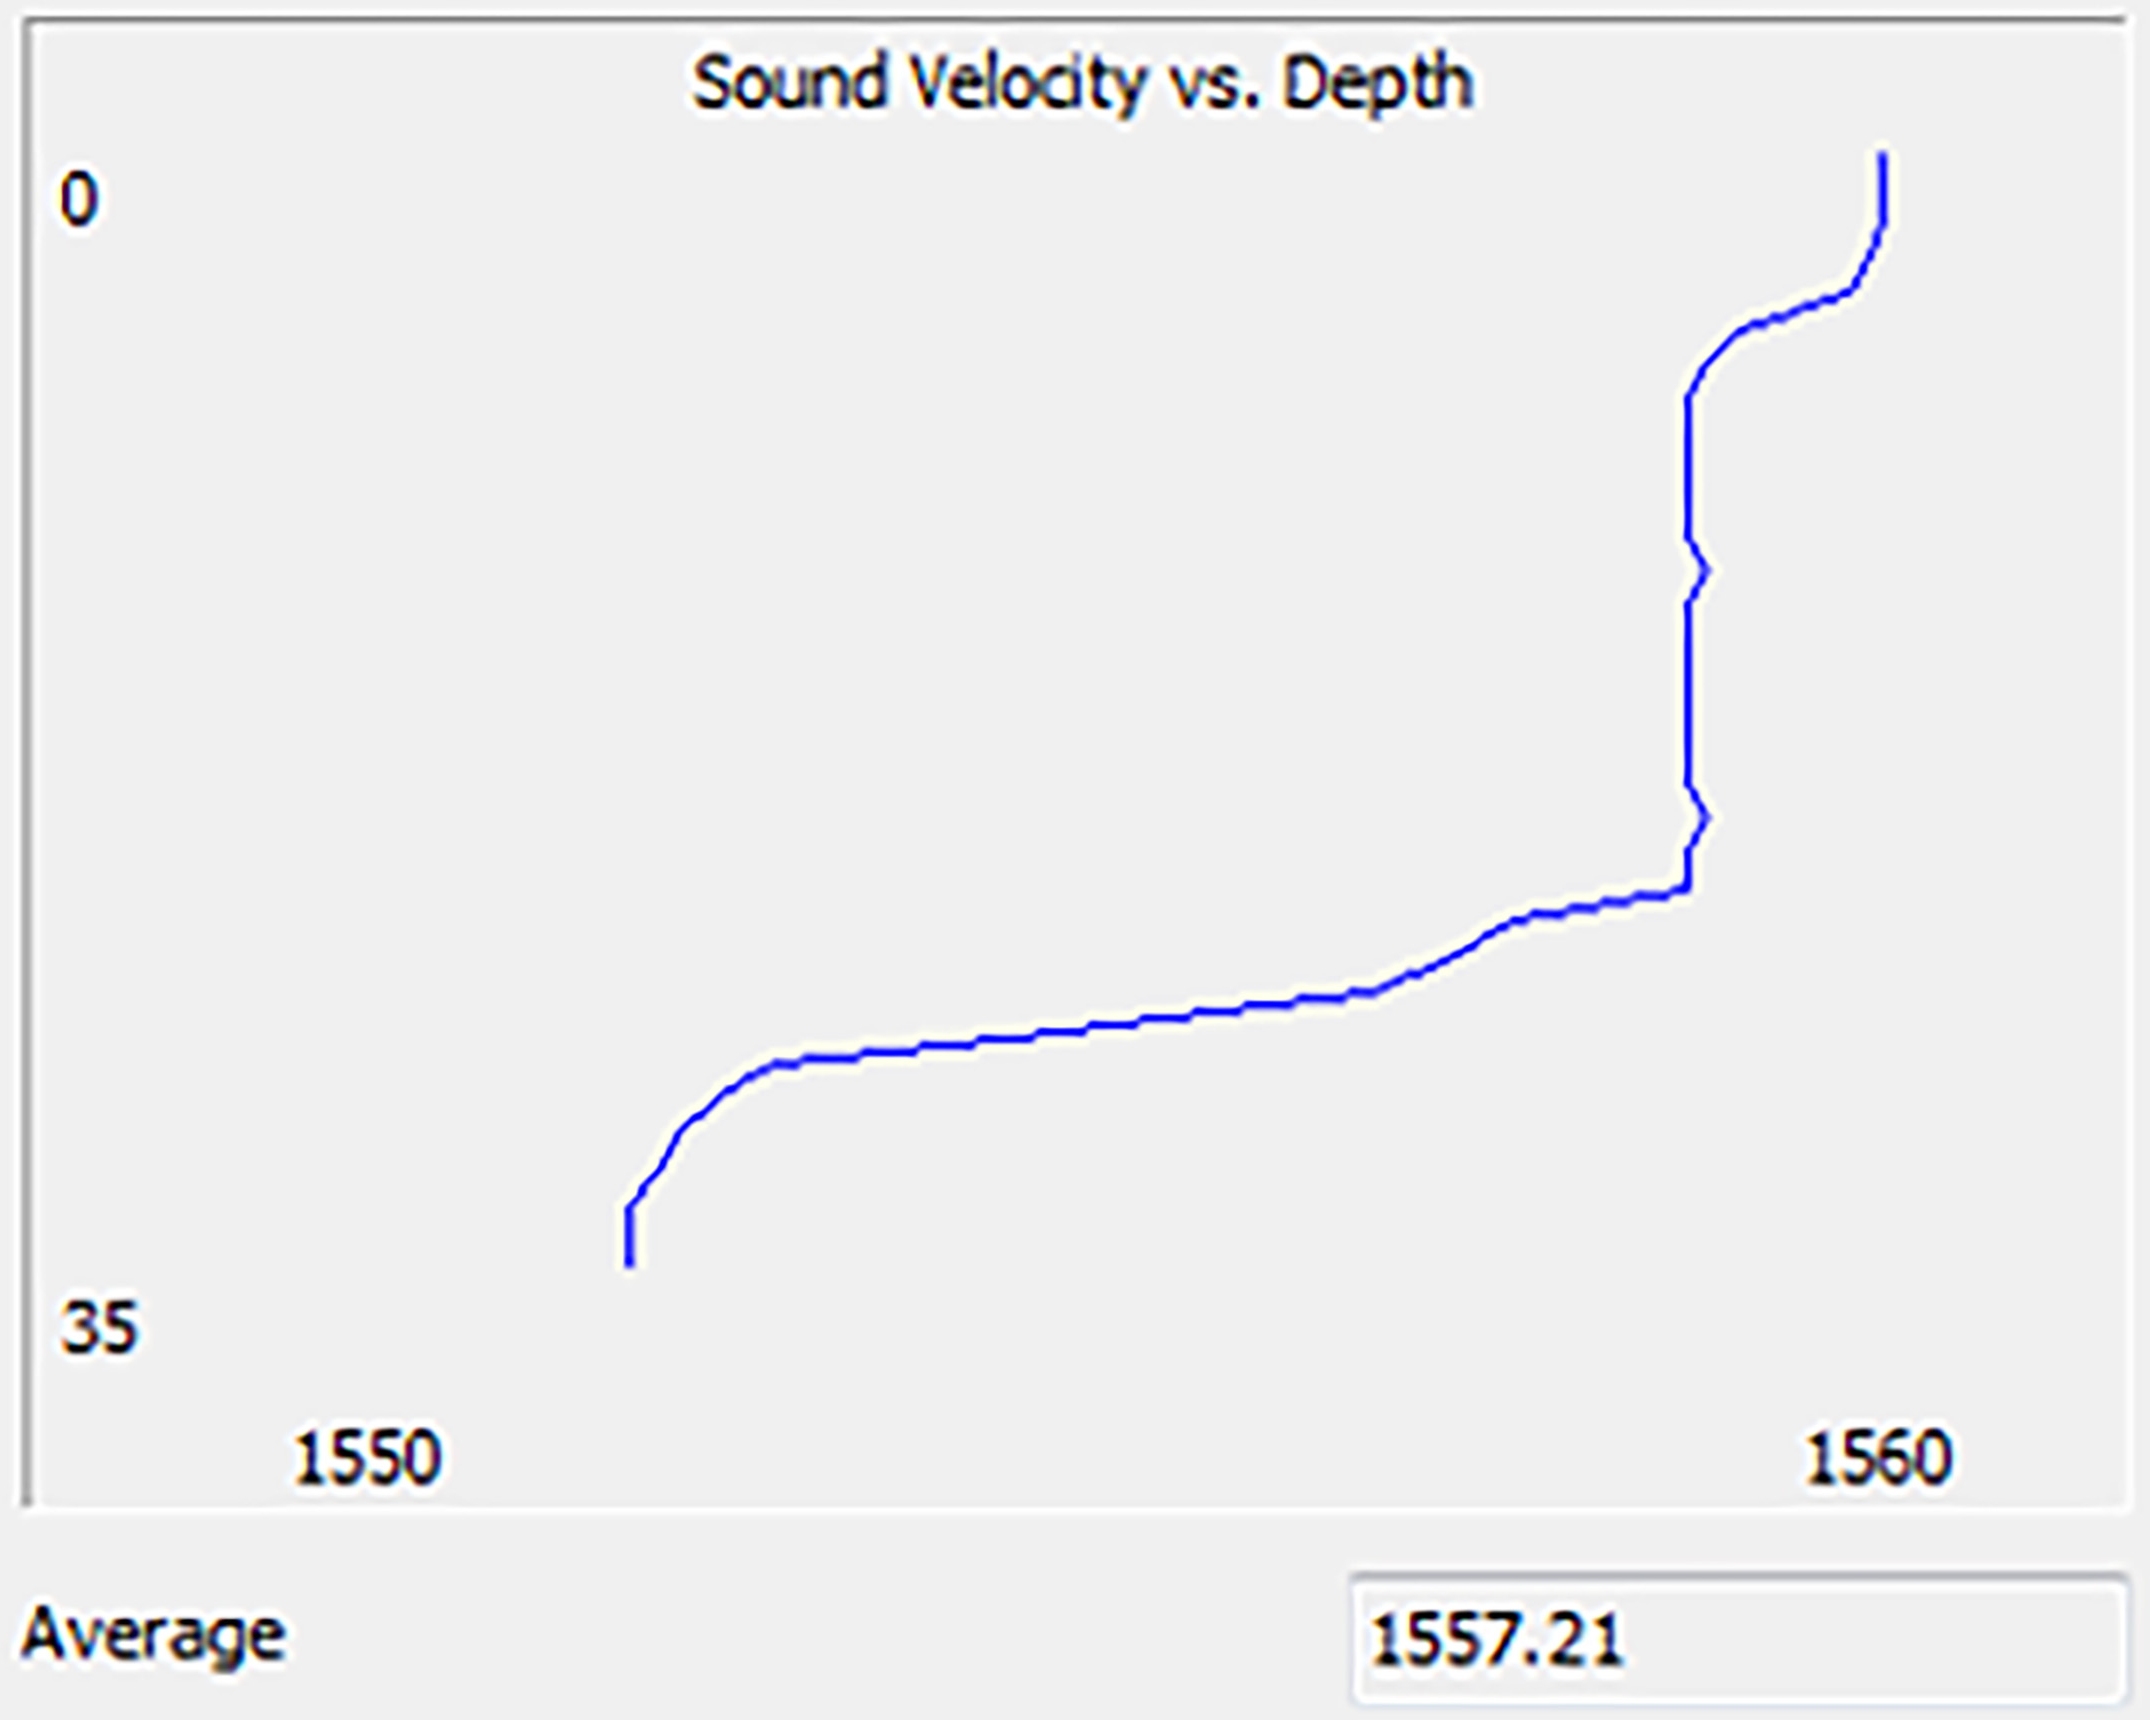
This procedure entails entering the desired sound velocity into the depth sounder during hydrographic surveys. Following this, a sound velocity profile is obtained at different locations over several days (Fig. 4), and adjustments for variations in sound velocity relative to the entered value are applied to the depth measurements during the post-processing phase. Figure 4 illustrates the Hypack format used for sound speed corrections.
4.1.3 Patch test
In the MBES depth sounding method, it is crucial to accurately calculate the static settings of the transducer along the three rotational axes (roll, pitch, and yaw) and the latency between receiving position data from the satellite positioning receiver and the depth sounder to avoid bias errors in the true three-dimensional coordinates of each beam (Gueriot et al., 2000). To compute each of these rotations, data collection must be performed using a specific methodology, which will be detailed subsequently, followed by rotation calculations using the patch test module of the hydrographic software.
Roll refers to the misalignment of the vessel’s vertical axis in the left-right direction between the transducer and the motion sensor (Xiao, 2003).
Pitch indicates the vertical misalignment of the vessel in the forward-backward direction between the transducer and the motion sensor.
Yaw rotation denotes the horizontal misalignment of the vessel concerning the position of the transducer and the GNSS antenna relative to the vessel’s direction of movement.
Latency refers to the misalignment error between the coordinates of the surveyed position and the depth recorded by the echo sounder, arising from a lack of synchronization between the corresponding data received from the transducer and the precise satellite positioning provided by the GNSS receiver.
4.2 SBES depth sounding
In single-beam (SB) depth sounding, the spacing between survey lines in the direction perpendicular to the coastline is established at 10 m, while control lines perpendicular to the main survey lines are set at intervals of 50 m. This method employs a small motorboat equipped with radio systems and differential positioning systems to determine Real-Time Kinematic (RTK) locations. The equipment includes a sound velocity probe, a precise hydrographic echo sounder, and data collection, logging, and processing software. The echo sounders utilized in this study were the Ceeducer Pro and Hydrotrac Odom, operating at a frequency of 200 kHz, with a beam angle of 8 deg and a resolution of 1 cm.
During echo-sounding operations in calm sea conditions, the transducer’s index error was addressed in the echo sounders through a bar-check test, and adjustments for sound velocity and water level fluctuations were implemented as part of the post-processing phase. Additionally, the RTK positioning system, provided by the national Continuously Operating Reference Stations (CORS) geodetic service, was employed to enhance the accuracy of positioning data.
4.3 MBES depth sounding
For the collection of MBES data, hydrographic sounding lines were strategically designed along the channel axis to accommodate the approximate depth of the area, ensuring a 30–40 % overlap between adjacent strips. A pilot vessel, named Hamyar 3, from Bushehr Port, was utilized to carry out the MB hydrographic operations.
The hardware employed in this study included the WASSP S3i MBES, with a transducer operating at a frequency of 160 kHz and a beam angle of 120 degrees, as well as a motion sensor (Advanced Navigation), GNSS heading system (Hemisphere), precise satellite positioning system (RTK), SVP-Digi Bar Pro sound velocity meter, and CTD-CastAway environmental sensor.
Upon installation of all equipment on the vessel, their relative positions to one another and the vessel’s axis were measured using a total station. The separation values of the sensors were then set into the MBES. To address errors stemming from the rotation and misalignment of the transducer axis, the satellite receiver antenna, and the motion sensor in relation to the survey vessel’s center of gravity, a patch test was conducted, and the measured corrections were applied to the MBES through the corresponding software (Whittaker et al., 2011). Furthermore, two quality control tests were incorporated into the MB depth sounding processing using hydrographic software, Hypack: (1) a beam angle test and (2) a statistical comparison of check lines, which are elaborated in Sections 4.3.1 and 4.3.2, respectively.
4.3.1 Beam angle test
The beam angle test assesses the depth-sounding accuracy of the MBES across various angles of incidence (beams) by utilizing a reference surface. In this context, the reference surface consists of SB depth soundings that are perpendicular to one or more multi-beam (MB) hydrographic lines. This procedure enhances the quality and accuracy of the data collected while optimizing the overall volume of data. In the MB surveys, data points corresponding to beam angles less than 45 degrees were considered for analysis. Data from multibeam sonar systems is generally more accurate at angles below 45 degrees compared to wider angles due to factors such as beam spreading, signal-to-noise ratio (SNR), refraction, scattering, and beam angle resolution and ect. For these reasons, data collected at angles below 45 degrees is typically more reliable and accurate for bathymetric mapping and seafloor characterization.
Subsequently, the results from this test were applied to angles ranging from 5 to 45 degrees, using the data obtained from the SB soundings as the reference surface.
4.3.2 Statistical comparison of check lines
Statistical comparison enables the evaluation of MB data against SB depth soundings (check lines). Initially, several MB sounding lines are selected in a flat area with a gentle slope, located near a tide gauge. Perpendicular to these selected lines, SB sounding lines are designed, and hydrographic surveys are conducted separately using the respective systems. Additionally, patch testing and sound velocity profile measurements are performed to apply necessary corrections to the measured depths. This operation is executed using a motorboat and a diesel pilot vessel equipped with various instruments.
Following data collection, the information gathered by the depth-sounding devices is processed using hydrographic software, transforming it into XYZ files within the software environment. After implementing necessary corrections, such as removing outlier data and accounting for tidal influences, all information is entered as final coordinates into the QGIS (ver.3.40) Environment. The data is then converted into maps at the horizontal reference level (WGS84 – 1984 World Geodetic System) and projected in the UTM-39 system. To estimate the elevation corresponding to a point on a map, linear interpolation is calculated.
To evaluate accuracy, it is essential to have data that reflects actual values for which comparison criteria can be established to determine optimal accuracy. Thus, check points must be defined. The SB depth information obtained under comparable conditions in a similar area serves as a representation of the true depth. Assuming that the output of this device is completely reliable, and that the depth recorded for each location accurately reflects the true depth, these coordinates are treated as check points. Given that the ray in SBES depth measurement is directed nearly vertically to the seabed, in an ideal scenario, it would not be affected by refraction and would exhibit no refractive error. In shallow water conditions, where the sea is calm and nearly ideal, the assumption that the data obtained from SBES depth measurement is entirely reliable is accepted for the purposes of this research.
4.3.3 Quality assessment of data
To assess the quality of data acquired from the MBES mapping of the Bushehr harbor channel according to the criteria set forth by the International Hydrographic Organization (IHO) and publication S-44, tools available within hydrographic software were employed. The evaluation of accuracy utilizes the uncertainty criterion, a non-negative value that delineates the range of values within which the correct parameter estimates are likely to fall at a specified confidence level (IHO, 2022). Position uncertainties should be articulated at a confidence level of 95 %. The overall uncertainty (encompassing both random and systematic components) associated with depth measurement surveys is represented by the total propagation uncertainty (TPU), which consists of two parts: horizontal uncertainty (THU) and vertical uncertainty (TVU). The horizontal component serves as a two-dimensional metric capturing all uncertainties pertaining to measurements within the horizontal plane, whereas the vertical component constitutes a one-dimensional metric that accounts for all uncertainties associated with vertical measurements (IHO, 2022).
The errors contributing to an increase in THU can be categorized as follows (Hare et al., 2011):
- Positioning system uncertainty
- Range and beam angle uncertainties
- The uncertainty associated with the ray path model (including the sound speed profile for sonars) and the beam pointing angle
- The uncertainty in platform heading
- System pointing uncertainties resulting from sensor misalignment
- Sensor location
- Platform motion sensor uncertainties, e.g. roll and pitch
- Sensor position offset uncertainties
- Time synchronisation / latency
Furthermore, the factors that lead to an increase in TVU can be enumerated as follows (Hare et al., 2011):
- Vertical datum uncertainty
- Vertical positioning system uncertainties
- Water level measurement uncertainties, including co-tidal uncertainties where relevant
- Instrument uncertainties
- Sound speed uncertainties (for sonars)
- Ellipsoidal / vertical datum separation model uncertainties
- Platform motion uncertainties, i.e. roll, pitch and heave
- Vessel draught, settlement and squat (for sonars)
- Seabed slope (bathymetry systems)
- Time synchronisation / latency
The mathematical modeling of each of these errors and their impact on overall error has been conducted by Hare (1995). The IHO classifies five orders of accuracy for hydrographic surveys in the 6.1.0 edition of the S-44 standard, providing maximum allowable values for THU and TVU for each order, along with the capability to detect features, as shown in Table 1. The maximum value of TVU is derived from Equation 2.
 |
(2) |
where
a denotes a portion of height uncertainty that remains independent of depth,
b signifies a coefficient that reflects a portion of height uncertainty that varies with depth,
d represents the depth.
In coastal regions, the Special Order referenced in Table 1 is employed (IHO, 2022).
4.4 Root mean square error
The root mean square error (RMSE) is defined as the difference between the values predicted by a model and the actual observed values, serving to quantify the error between two datasets. Given that the RMSE represents an average of the existing errors, it serves as a crucial metric for evaluating the overall accuracy of the data. The RMSE for depth is computed using the following equation:
 |
(3) |
In Eq. 3, z denotes the actual depth value, z̄ signifies the estimated depth value, and n indicates the total number of models. Ultimately, the achieved accuracy was compared against the IHO global standard for the nominal accuracy necessary in hydrographic work, ensuring adherence to the required order and the safe navigation of vessels. The differences between the two interpolation methods and the discrepancies between the two digital models derived from MB and SB depth measurements were subsequently evaluated.

5 Results and discussion
This section presents the outcomes of the quality control test for depth sounding, the digital models obtained from SB and MB depth soundings, and the differences between the two digital elevation models (DEMs) derived from these distinct depth sounding methods.
5.1 Quality control test and removal of data with lower confidence levels
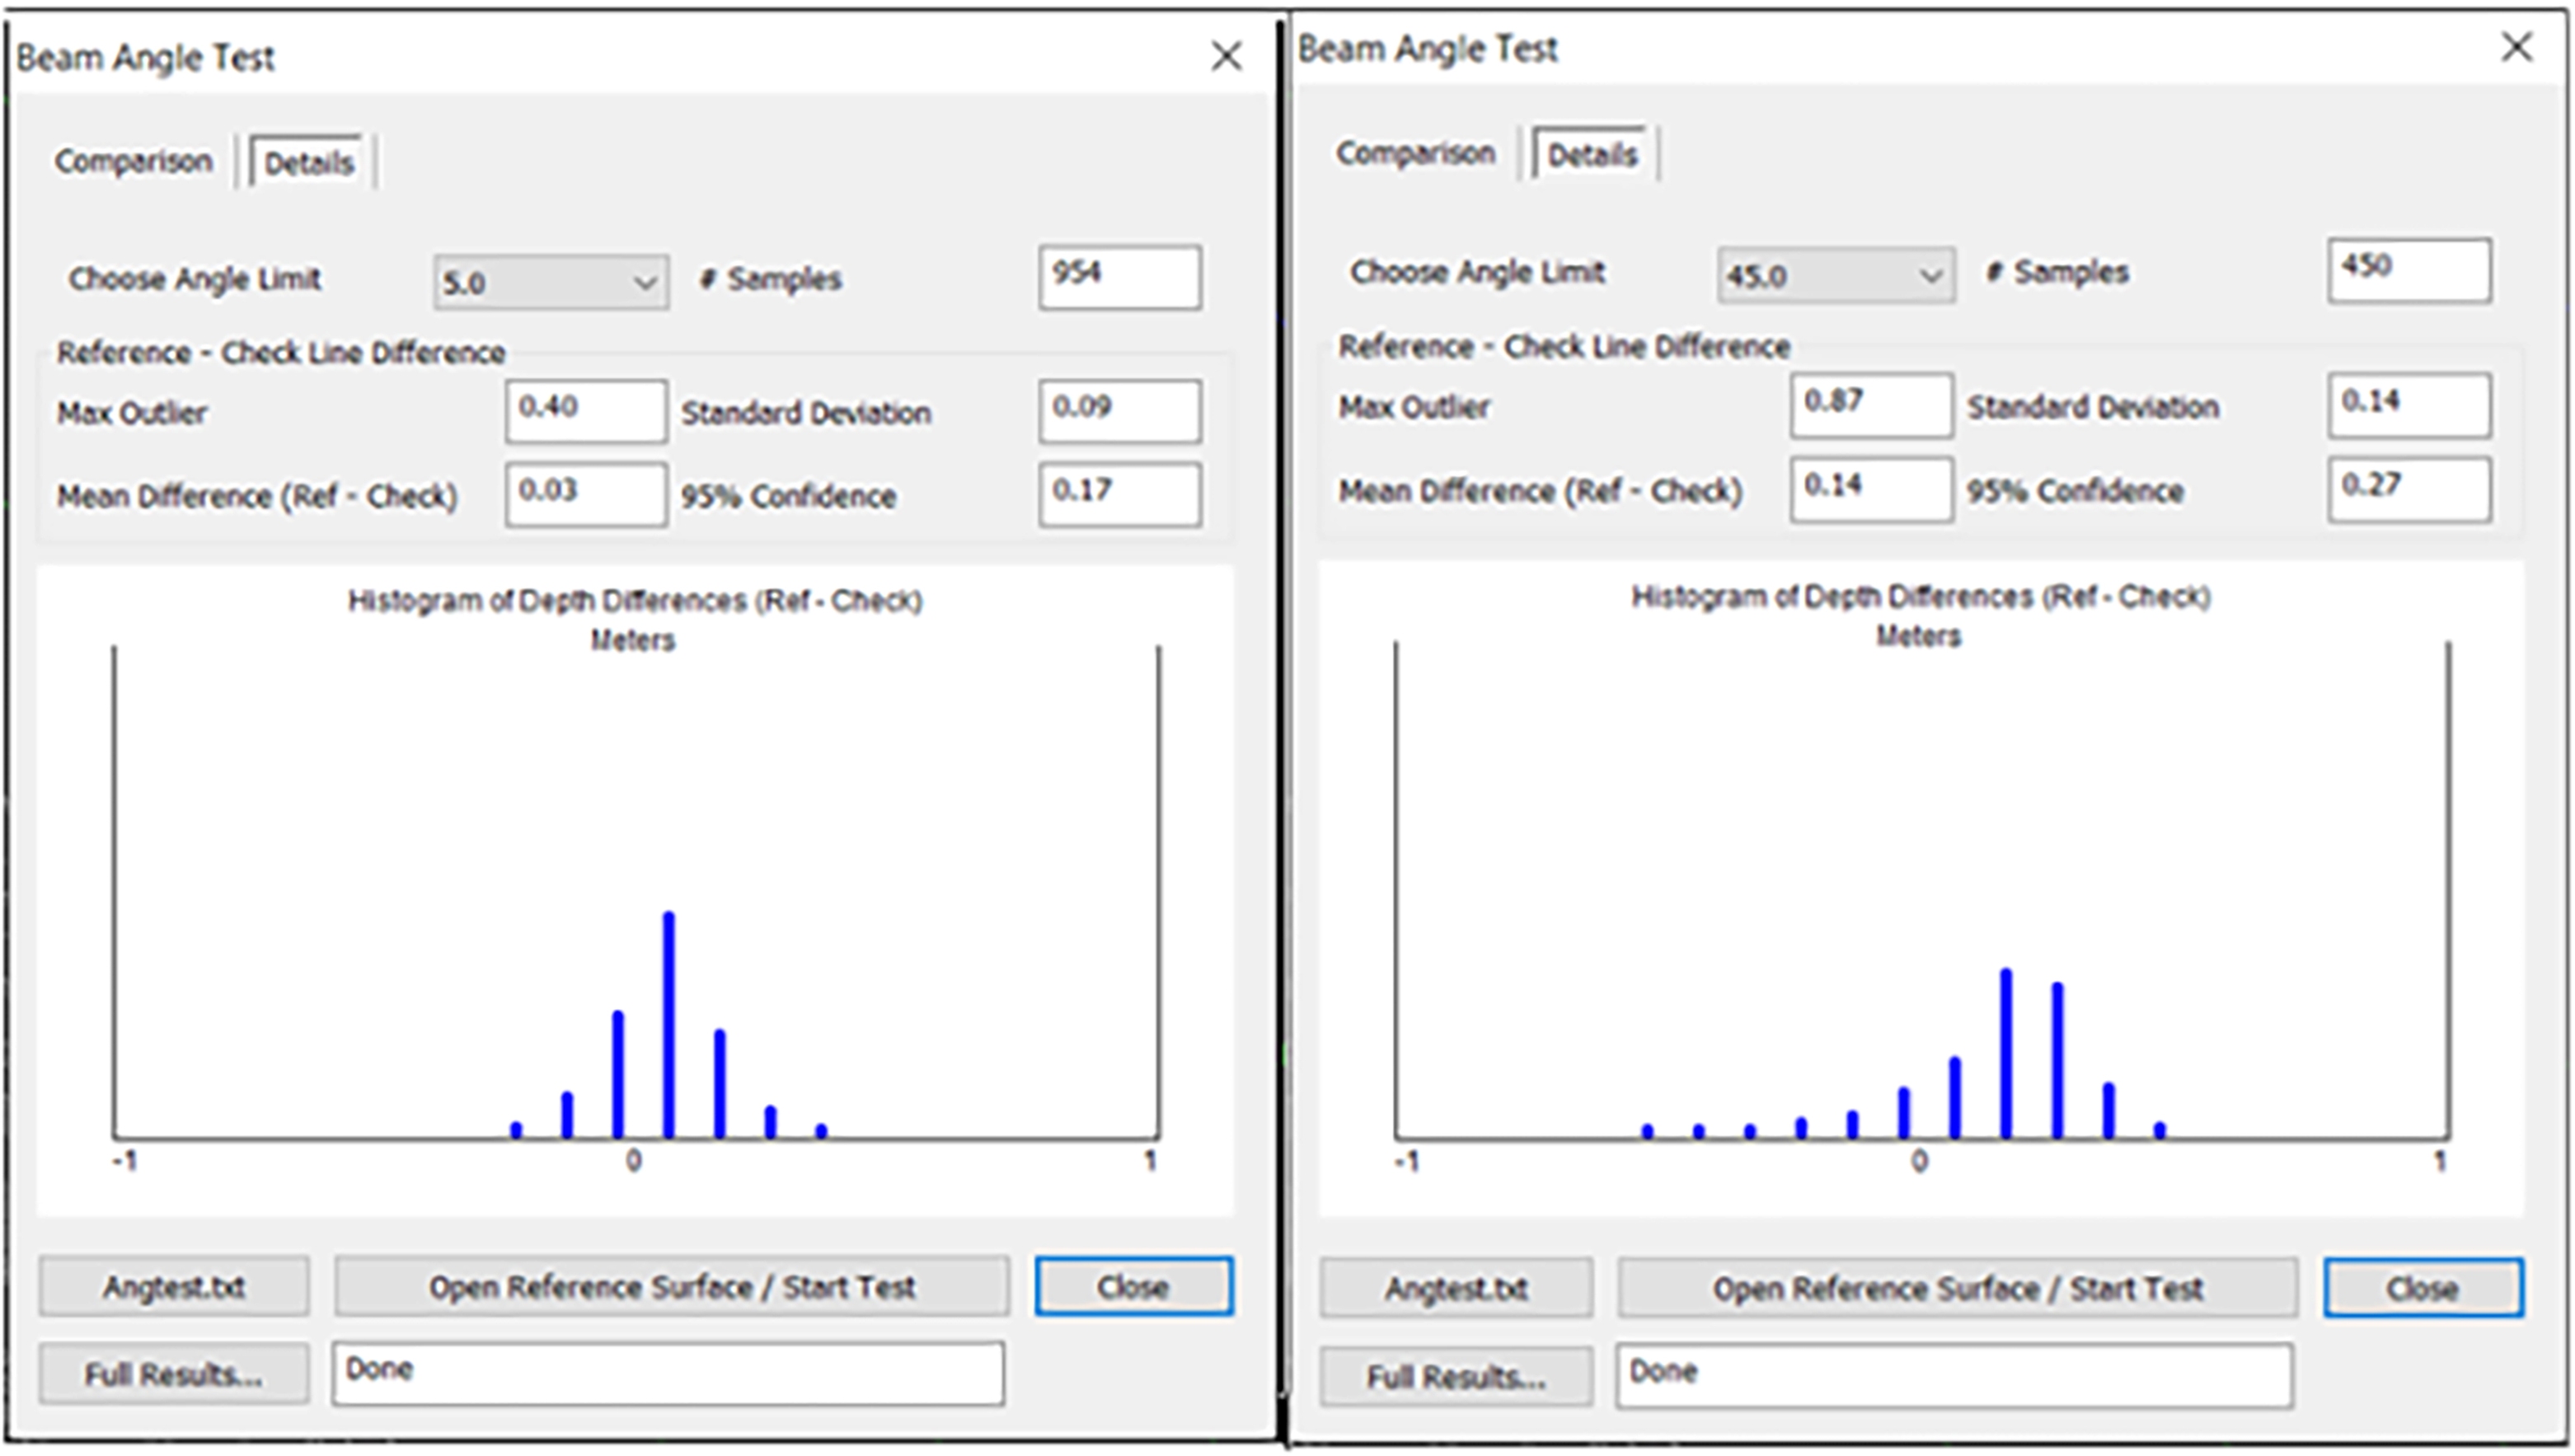
The results pertaining to the accuracy test of MB depth sounding at various beam angles, using a reference level, are summarized in Table 2. This table displays the statistical output for beam angles ranging from 0 to 45 degrees on both sides. Assuming the maximum measured depth (accounting for tidal influences) is 15 m, the statistical accuracy across all beam angles up to 45 degrees, at a confidence level of 95 %, varies between 0.17–0.27 m, which complies with the Special Order outlined in the IHO S-44 standard. Consequently, to enhance data quality and minimize the excessive volume of data, the information associated with outside beams, which exhibited lower confidence levels, was excluded. This approach effectively reduces outlier data and accelerates the process of map production and other spatial analyses. Fig. 5 illustrates the statistical test results of the MBES data at a 95 % confidence level in comparison to the SB data. Additionally, as a case in point, the normal probability distribution curves for the test angles of 5 and 45 degrees are depicted in Fig. 6.
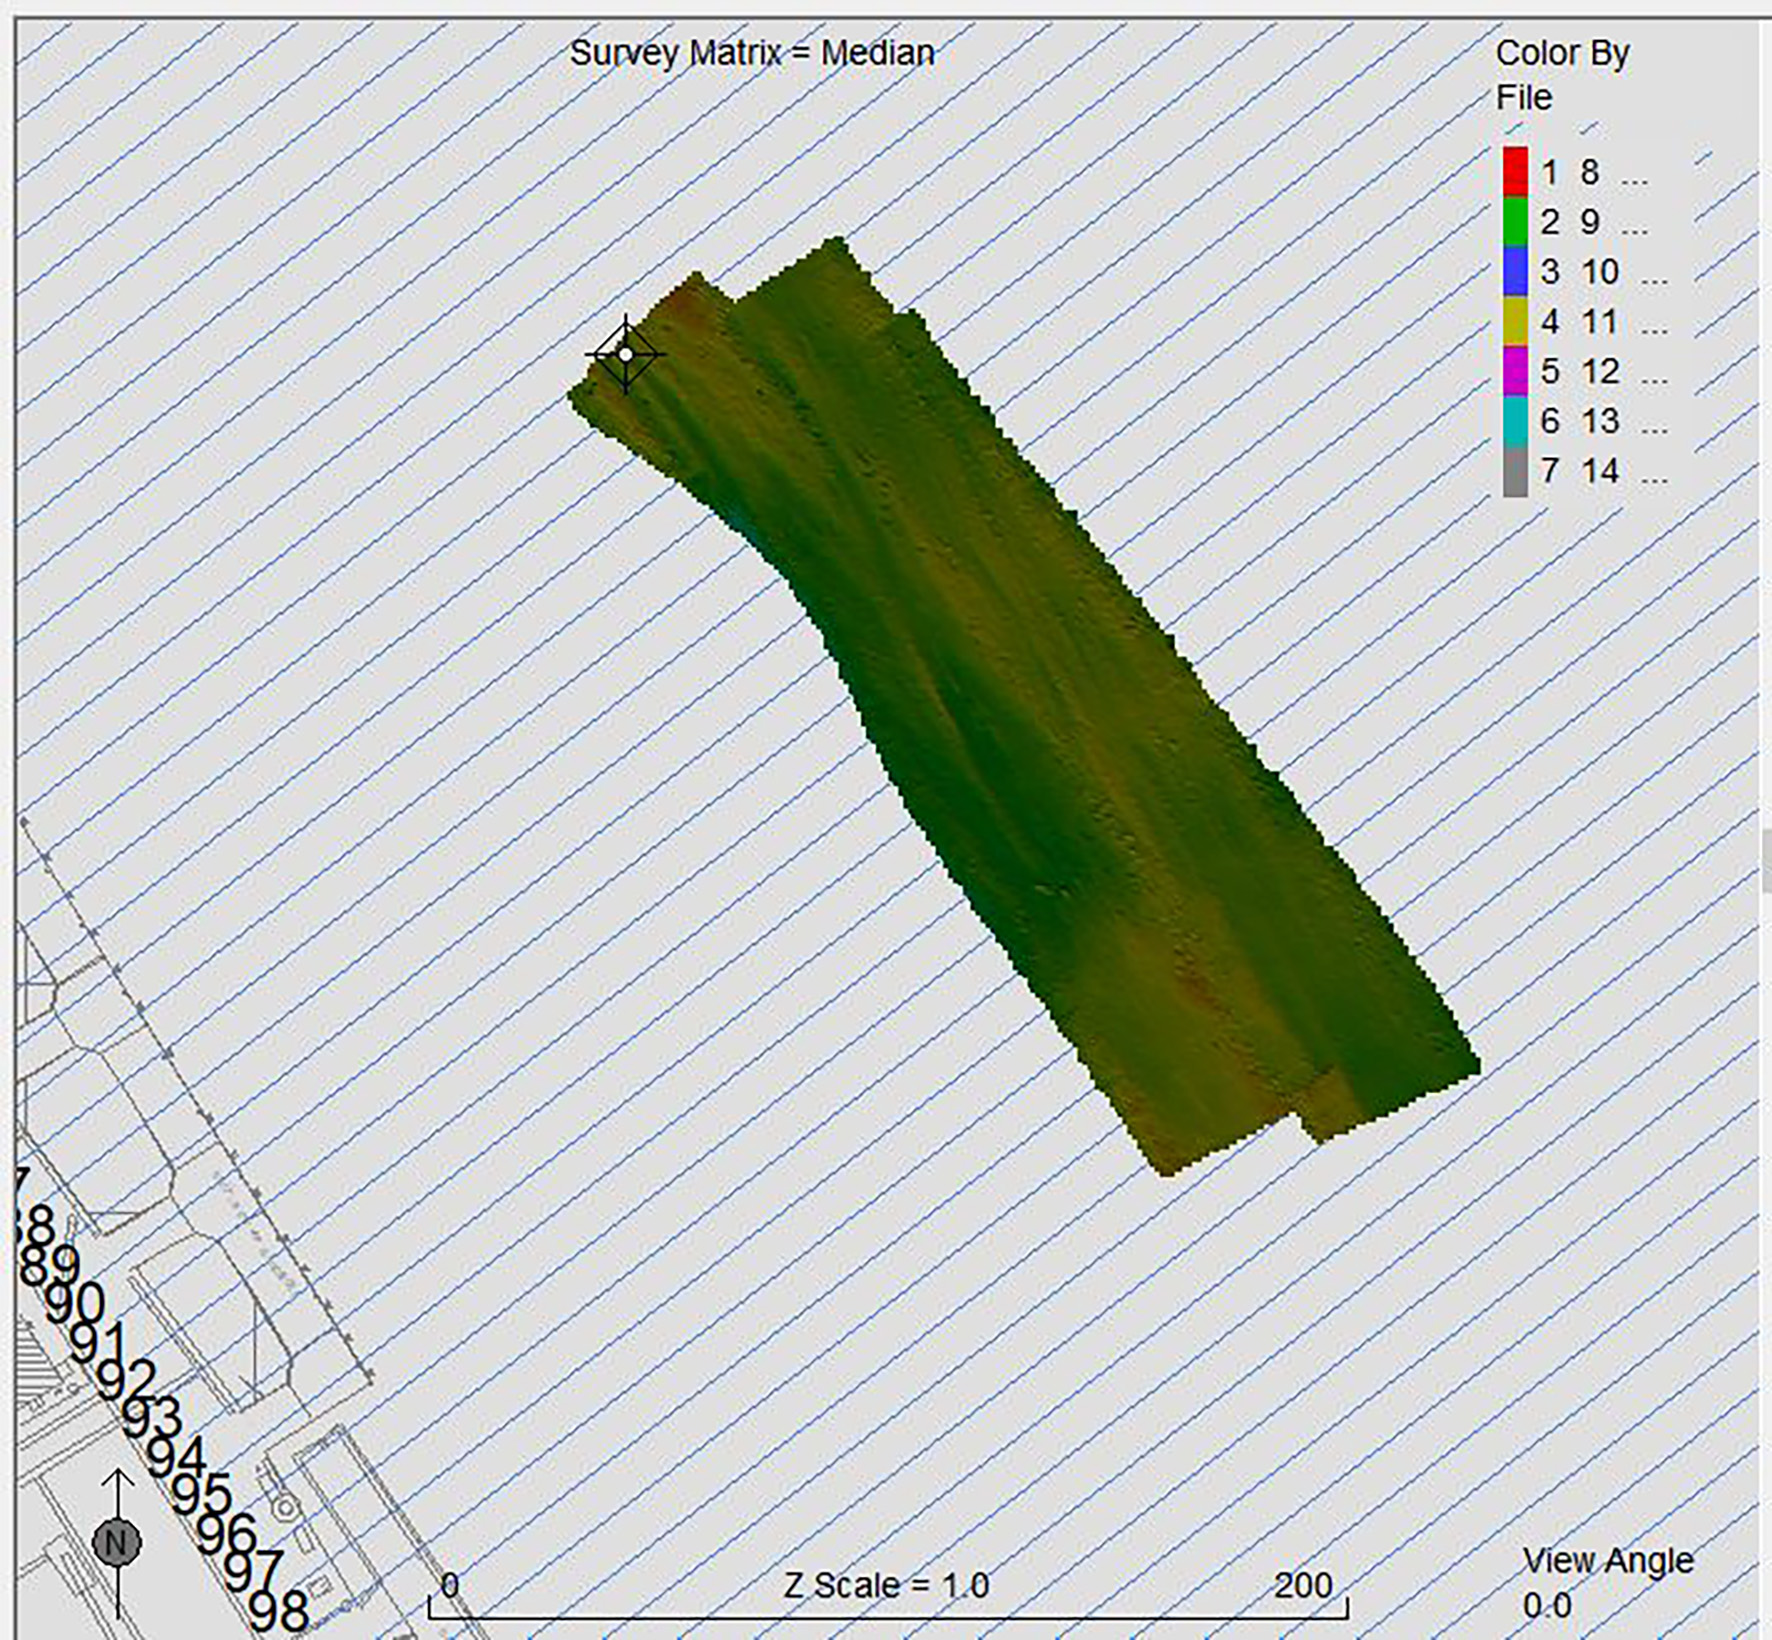
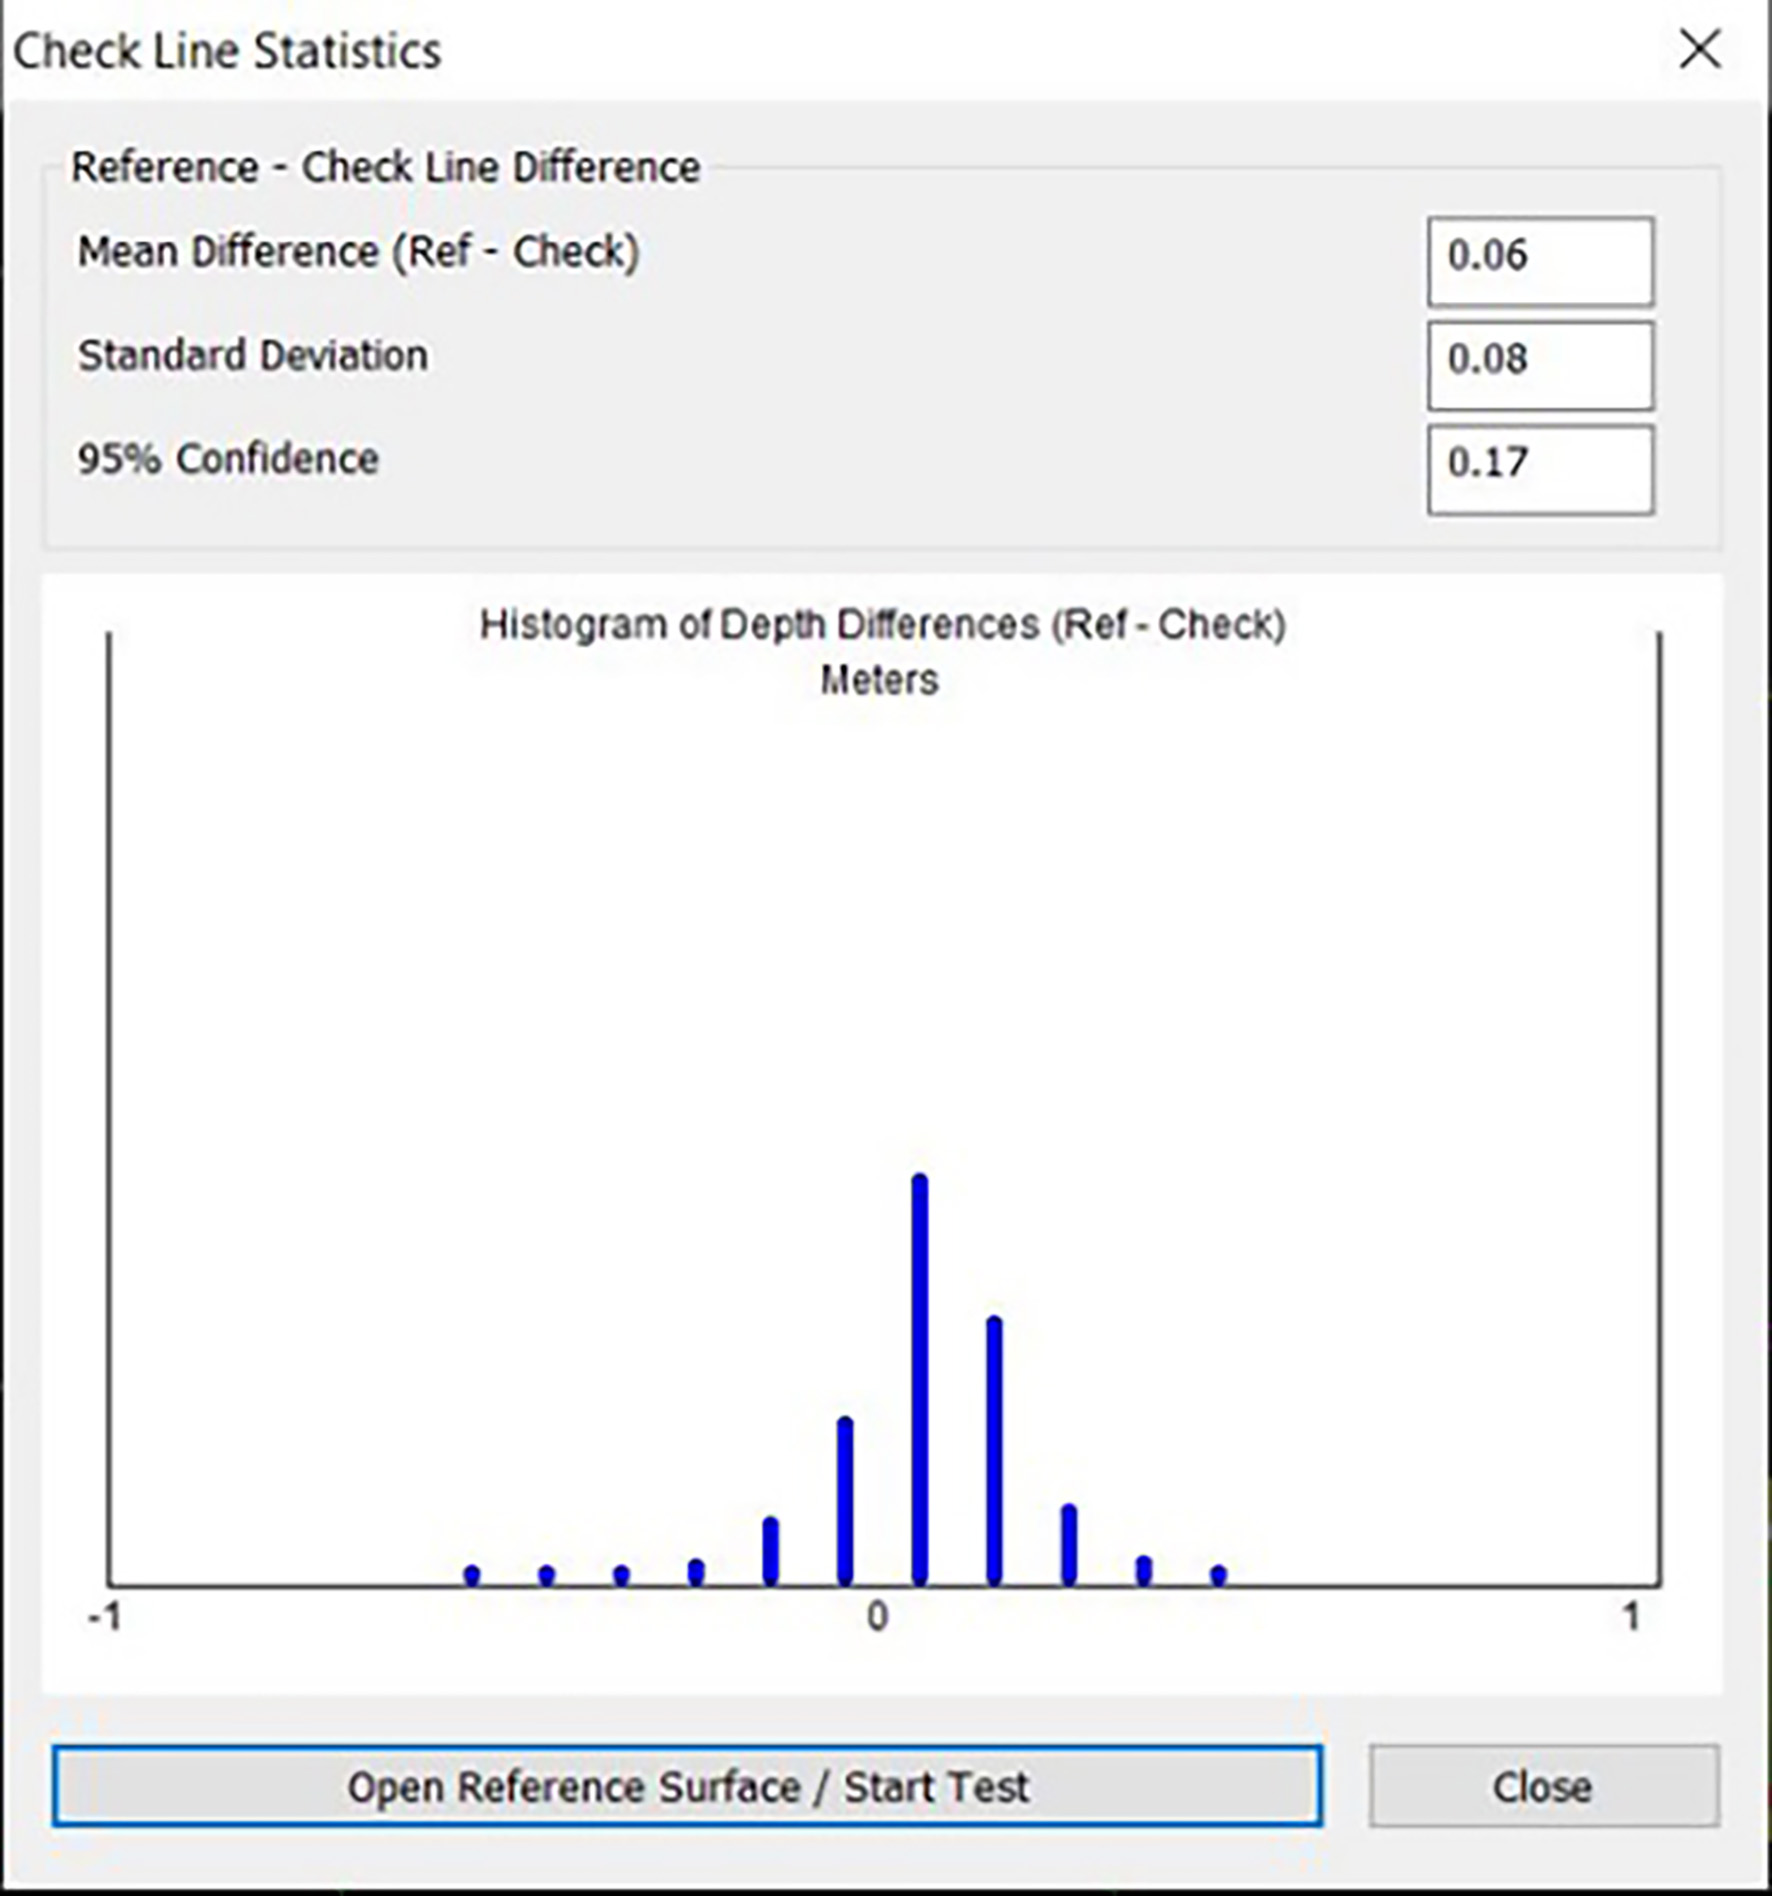
Fig. 7 shows the location of quality control tests conducted within the port of Bushehr. Furthermore, Fig. 8 presents the results obtained from several statistical comparisons in hydrographic software across different areas of the project scope.


5.2 Horizontal and vertical uncertainties and object detection
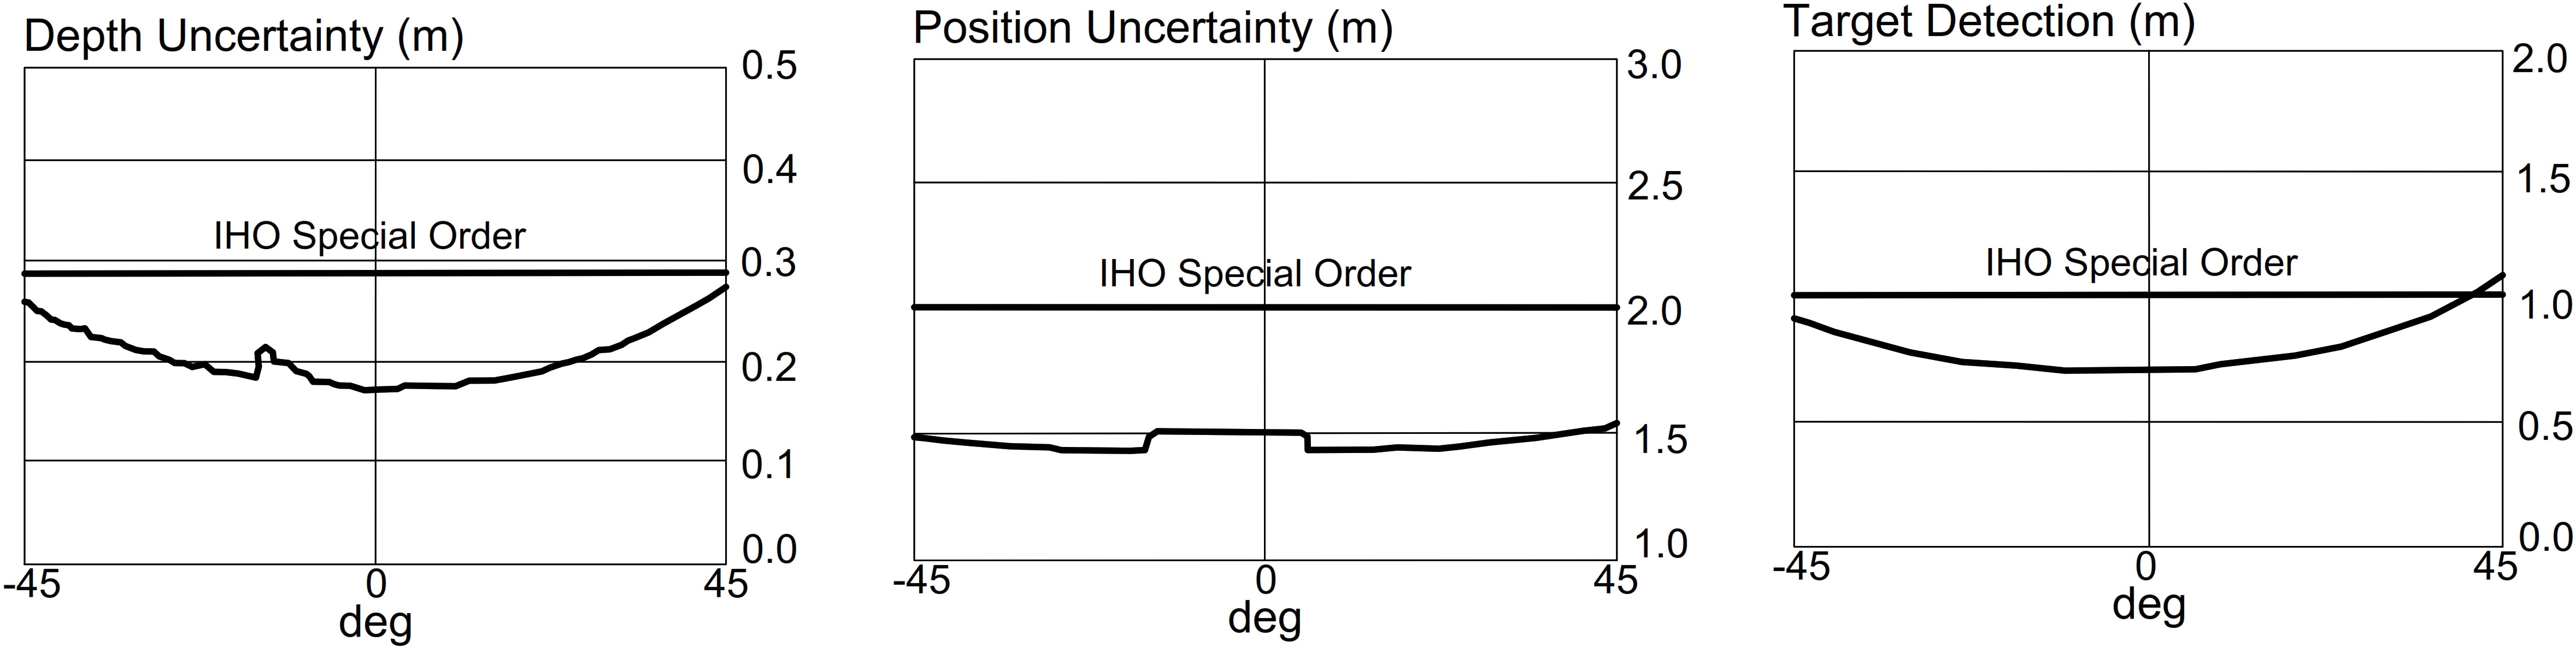
Fig. 9 presents a graphical representation of the two-dimensional horizontal uncertainties, one-dimensional vertical uncertainties, and object detection uncertainties for the MB survey conducted in the Bushehr port channel. These figures illustrate the typical error performance of an MBES system in shallow water. The graphs demonstrate the MB performance using GNSS-RTK for positioning and attitude sensors at a target depth of 15 m. In order to enhance the accuracy of the side beams, depth data within a 90-degree range of the MBES system was employed. Ultimately, based on the initial parameters provided to the hydrographic software, the results from the MB depth measurement are anticipated to meet the criteria for special order accuracy.
5.3 Digital models obtained from two depth measurement methods
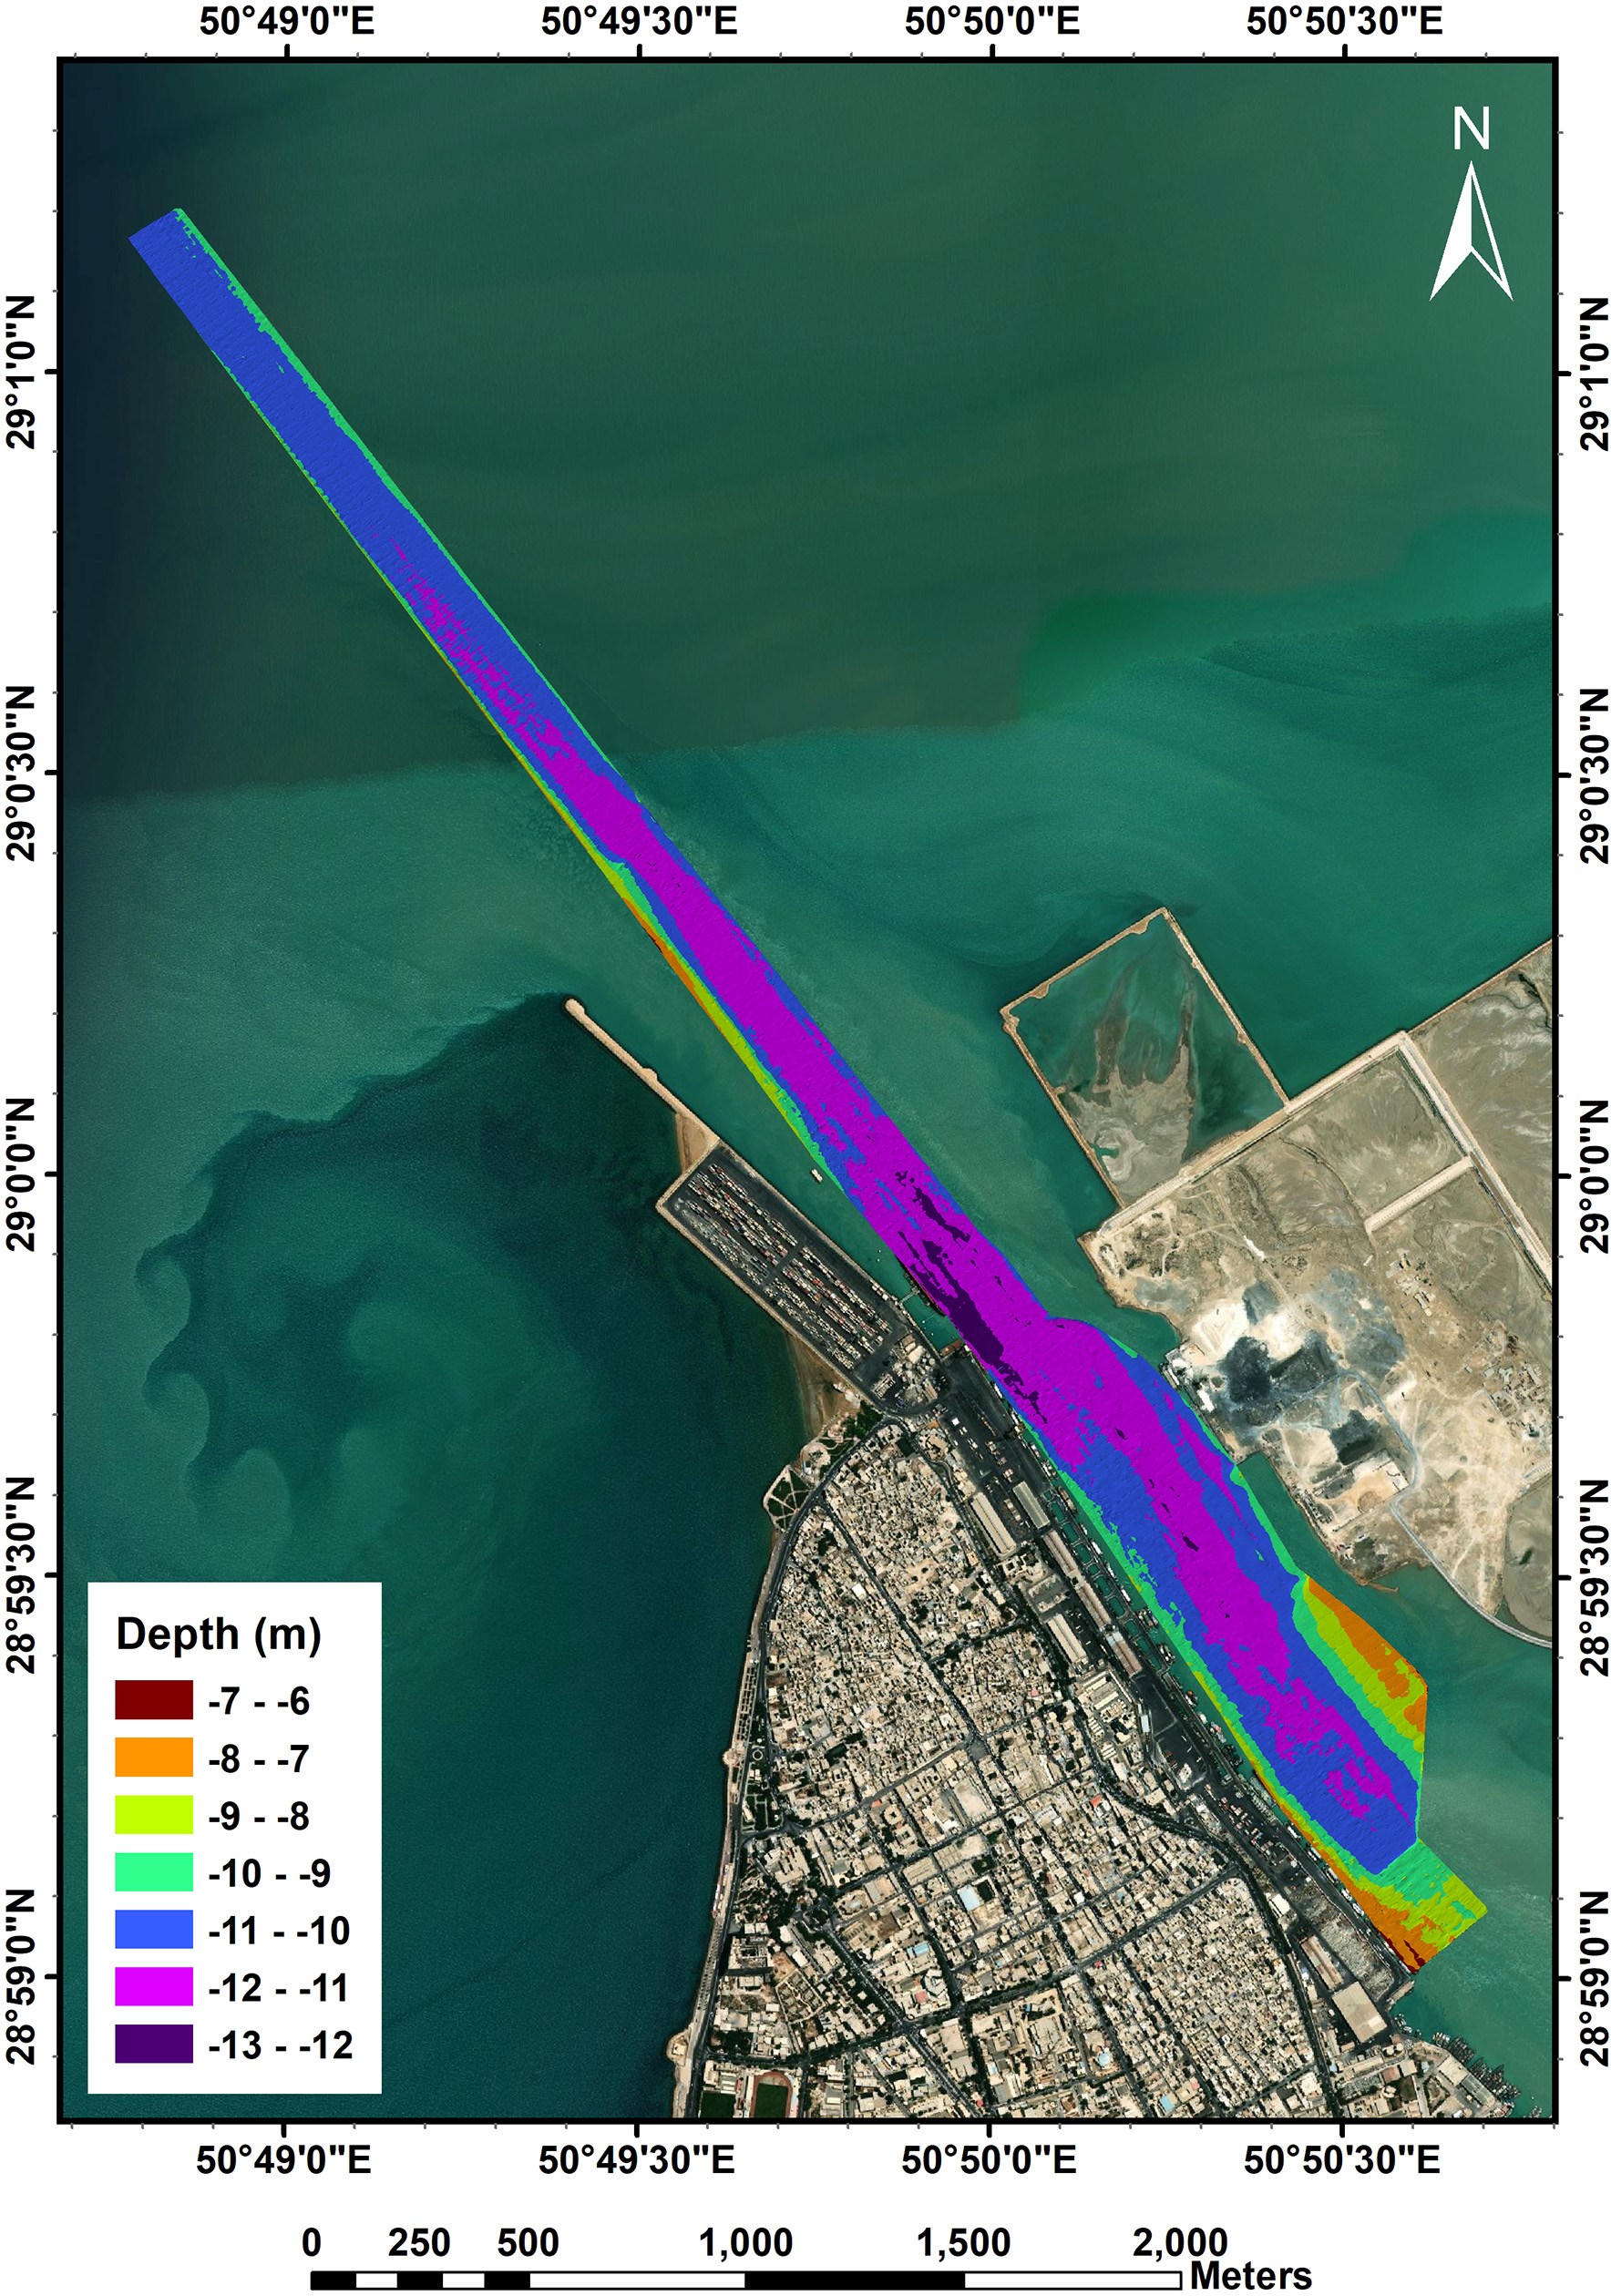
The map produced from the SB depth measurements is illustrated in Fig. 10. The data depicted in this figure indicates that the maximum and minimum depths recorded in Bushehr Port are 13.27 m and 6.05 m, respectively, with the channel’s center generally exhibiting depths ranging from 10.5–13.3 m. The length and width of this channel are 6 km and 250 m, respectively. The southern part of the channel is enclosed by berthing areas an artificial island formed from dredged materials. As shown in the figure, the island is currently under development.
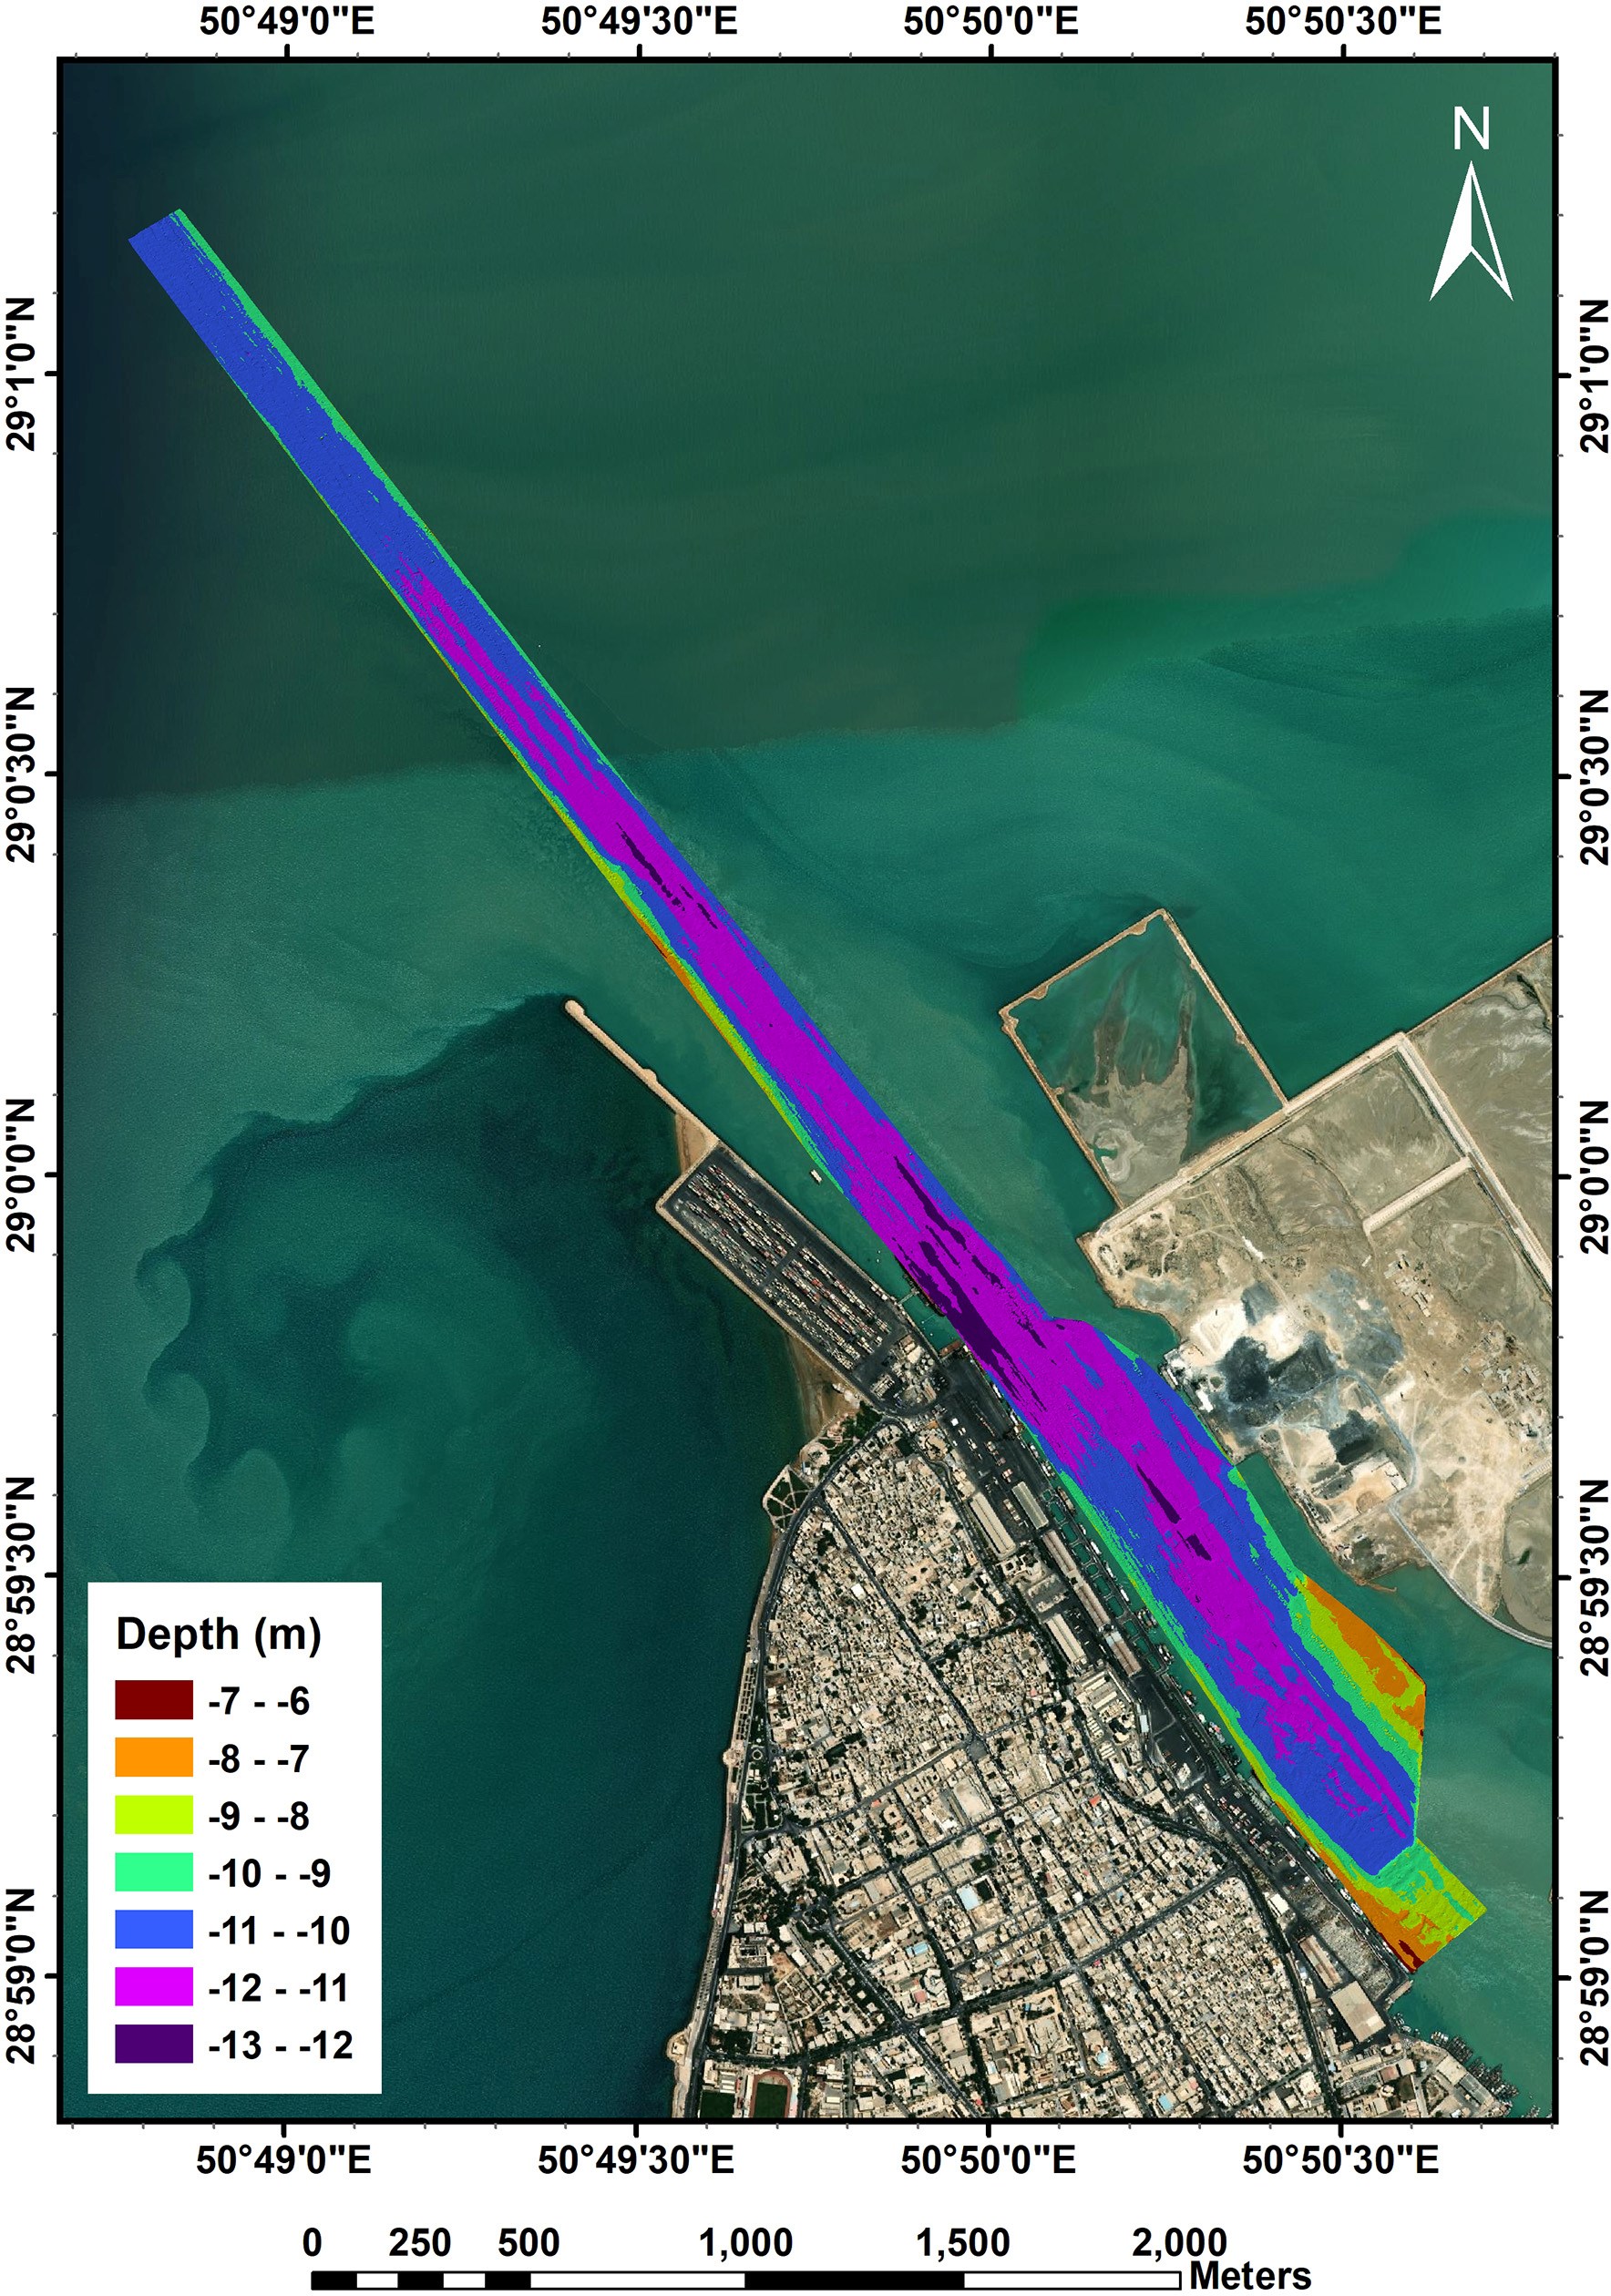
In contrast, Fig. 11 showcases the map derived from the MBES measurements. This figure reveals that the maximum and minimum depths recorded are 13 m and 6.11 m, respectively, while the center of the channel typically displays depths between 10.5–13 m.
5.4 Average depth measurement differences
To determine the differences in spot depth measurements within the designated area, a comparison was made between the data collected from SBES and MBES measurements using linear interpolation. This approach involved interpolating the depths measured by the SB method onto the denser surface generated from the MB method, allowing for the assessment of elevation differences at corresponding locations. The average difference observed in the Port of Bushehr is calculated to be 0.03 m.
5.5 Calculation of the difference between two digital surfaces
Following the calculation of point height differences between the two bathymetric methods, we will proceed to evaluate the three-dimensional surface discrepancies resulting from SBES and MBES in the Port of Bushehr. The three-dimensional surface (digital terrain model), was generated through interpolation of surrounding points using QGIS software.
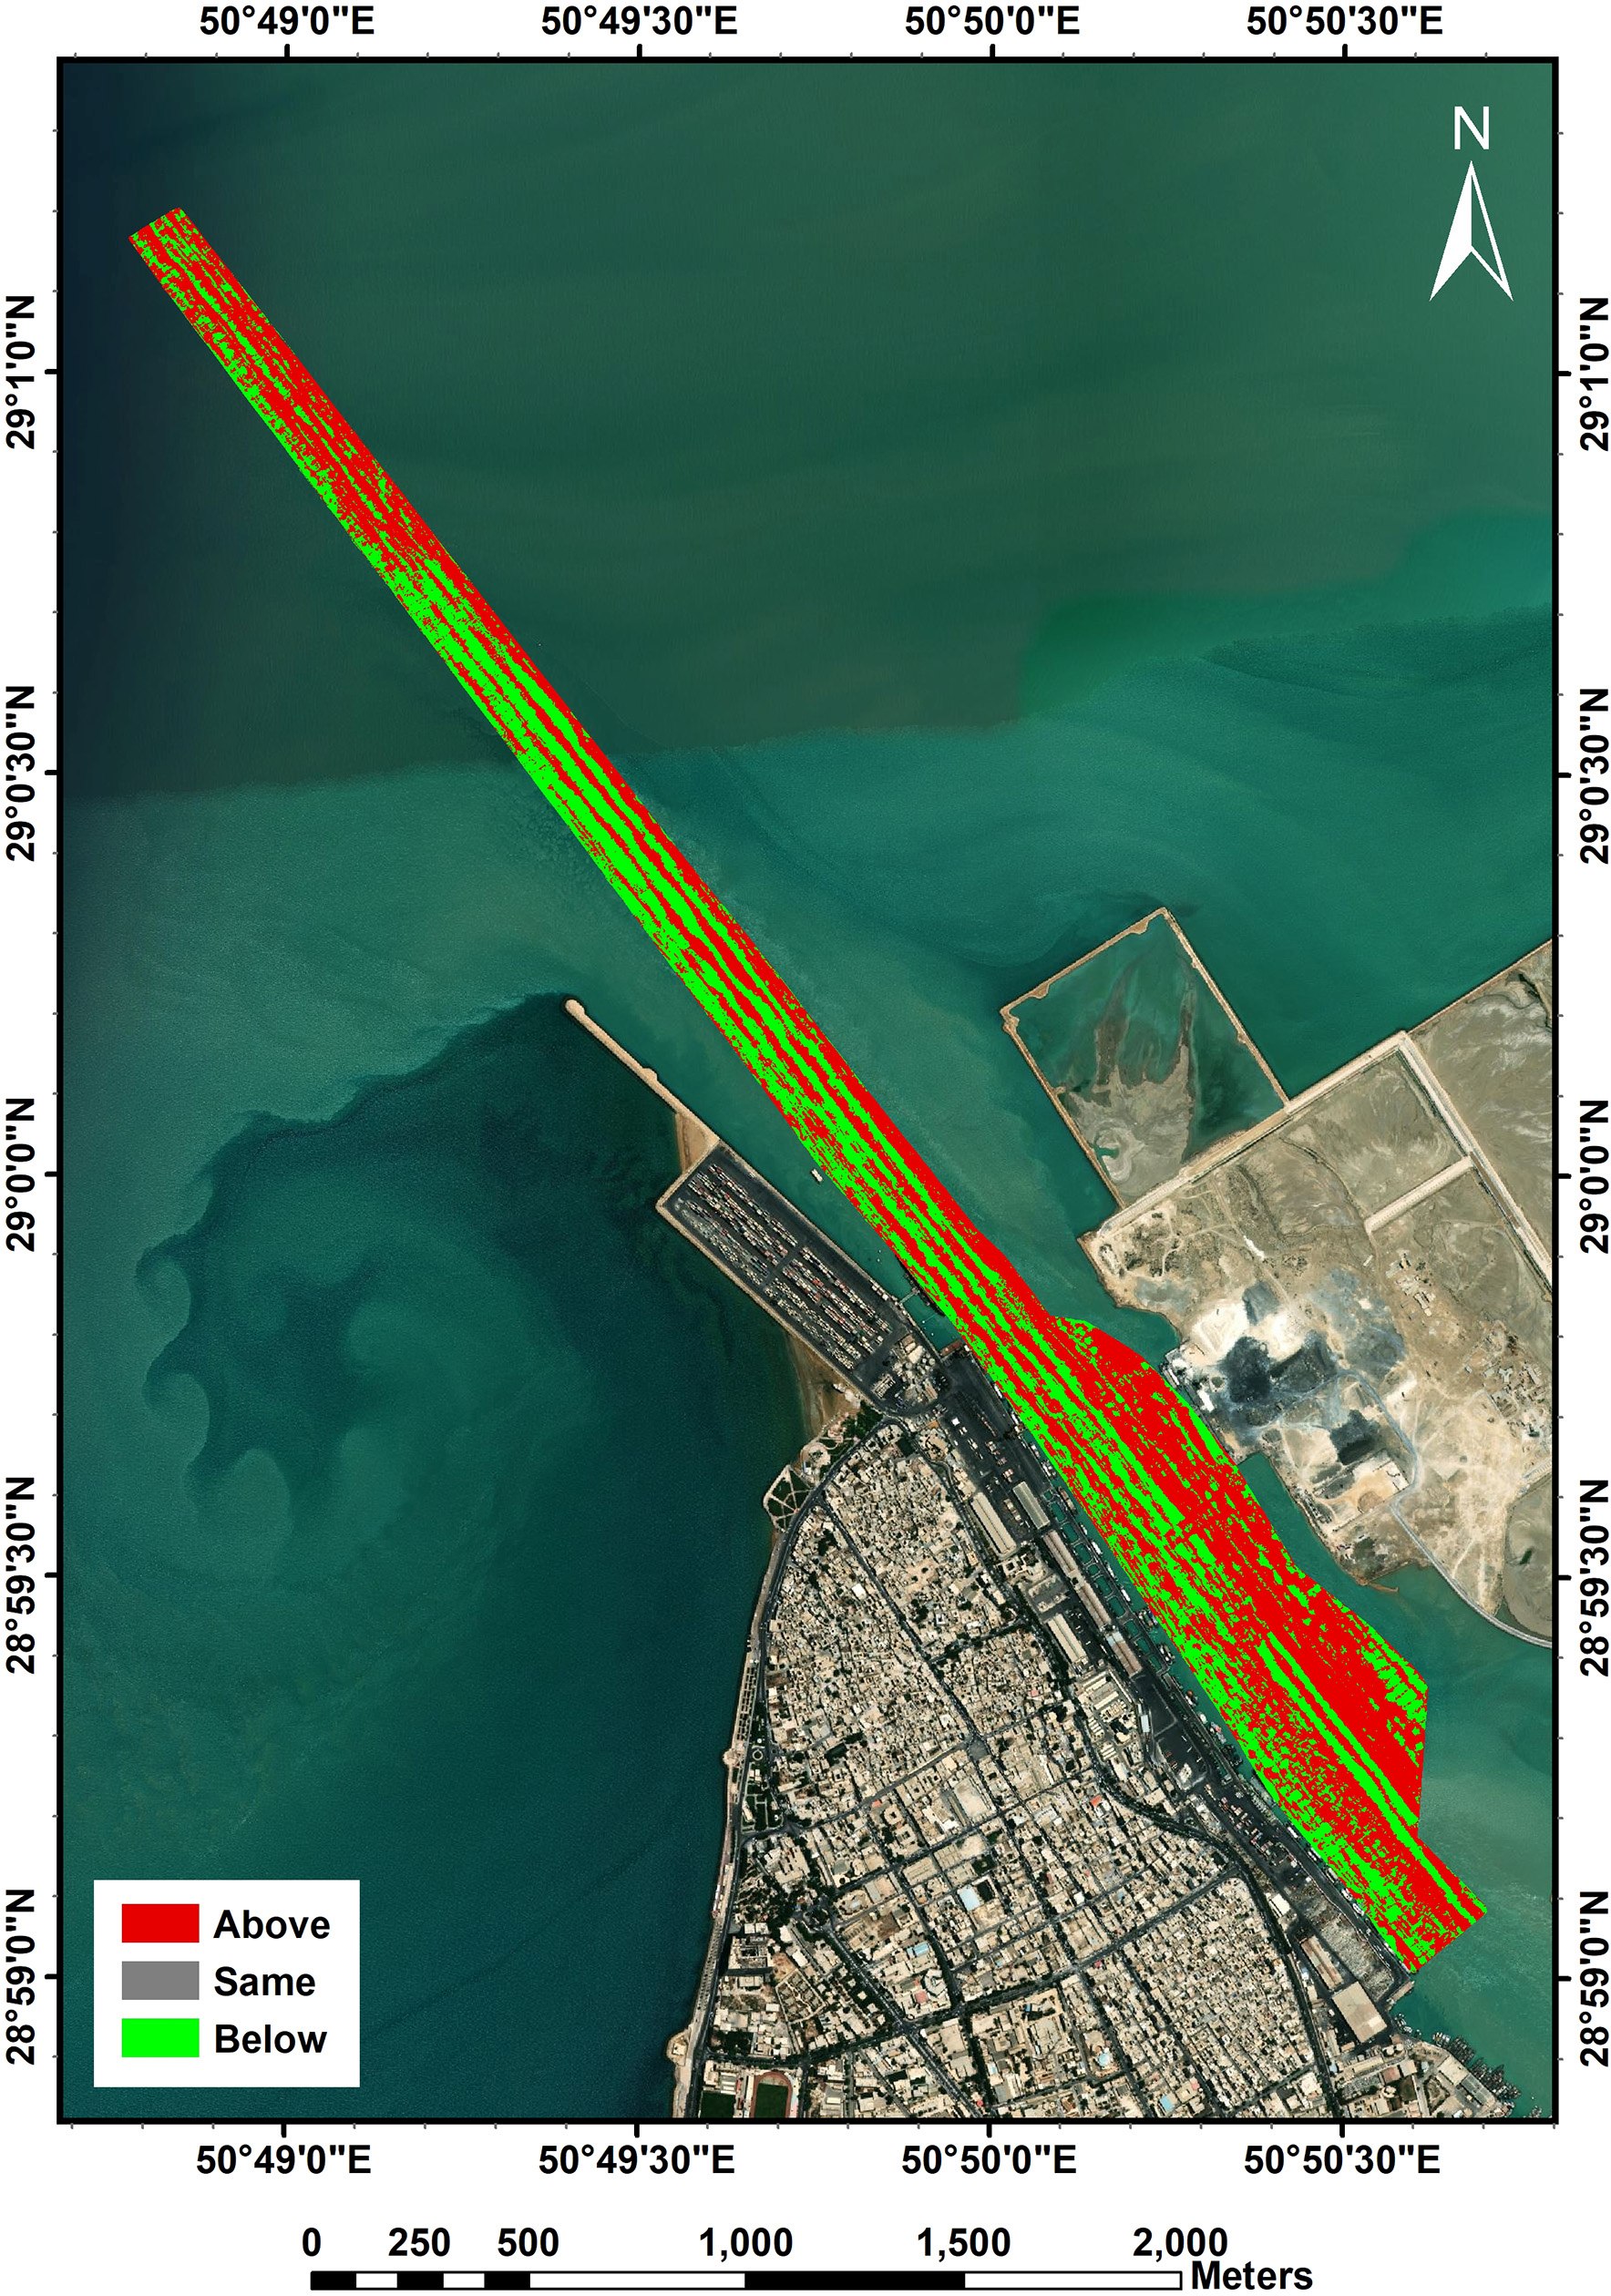
As depicted in Fig. 12, the volume difference between the surfaces obtained from SBES and MBES is found to be 77,835 m3 over an area of 464,511 m2, alongside a settled sediment volume of 98,321 m3 across 641,219 m2. Specifically, in the 464,511 m2 area, the MBES depths are deeper (lower) compared to those measured by SBES, while in the 641,219 m2 area, MBES depths are shallower (higher). Consequently, the elevation coordinates derived from SBES are generally deeper than those from MBES, due to the larger volume and area of settled sediment.
In contrast, the study referenced in (Pratomo & Saputro, 2021) indicated that, overall, the elevation coordinates obtained from SBES are shallower than those from MBES. This discrepancy suggests that it is not possible to definitively conclude which method measures depth values more accurately; such outcomes can vary significantly from one region to another. By calculating the volume of the grid – representing the difference between sediment deposition and erosion—and dividing it by the total area, we derive a volume difference of 0.04 m3 per meter, which aligns with the findings of the aforementioned research (Pratomo & Saputro, 2021), indicating the insignificance of this difference.
5.6 Statistical characteristics of the difference between two depth-sounding data
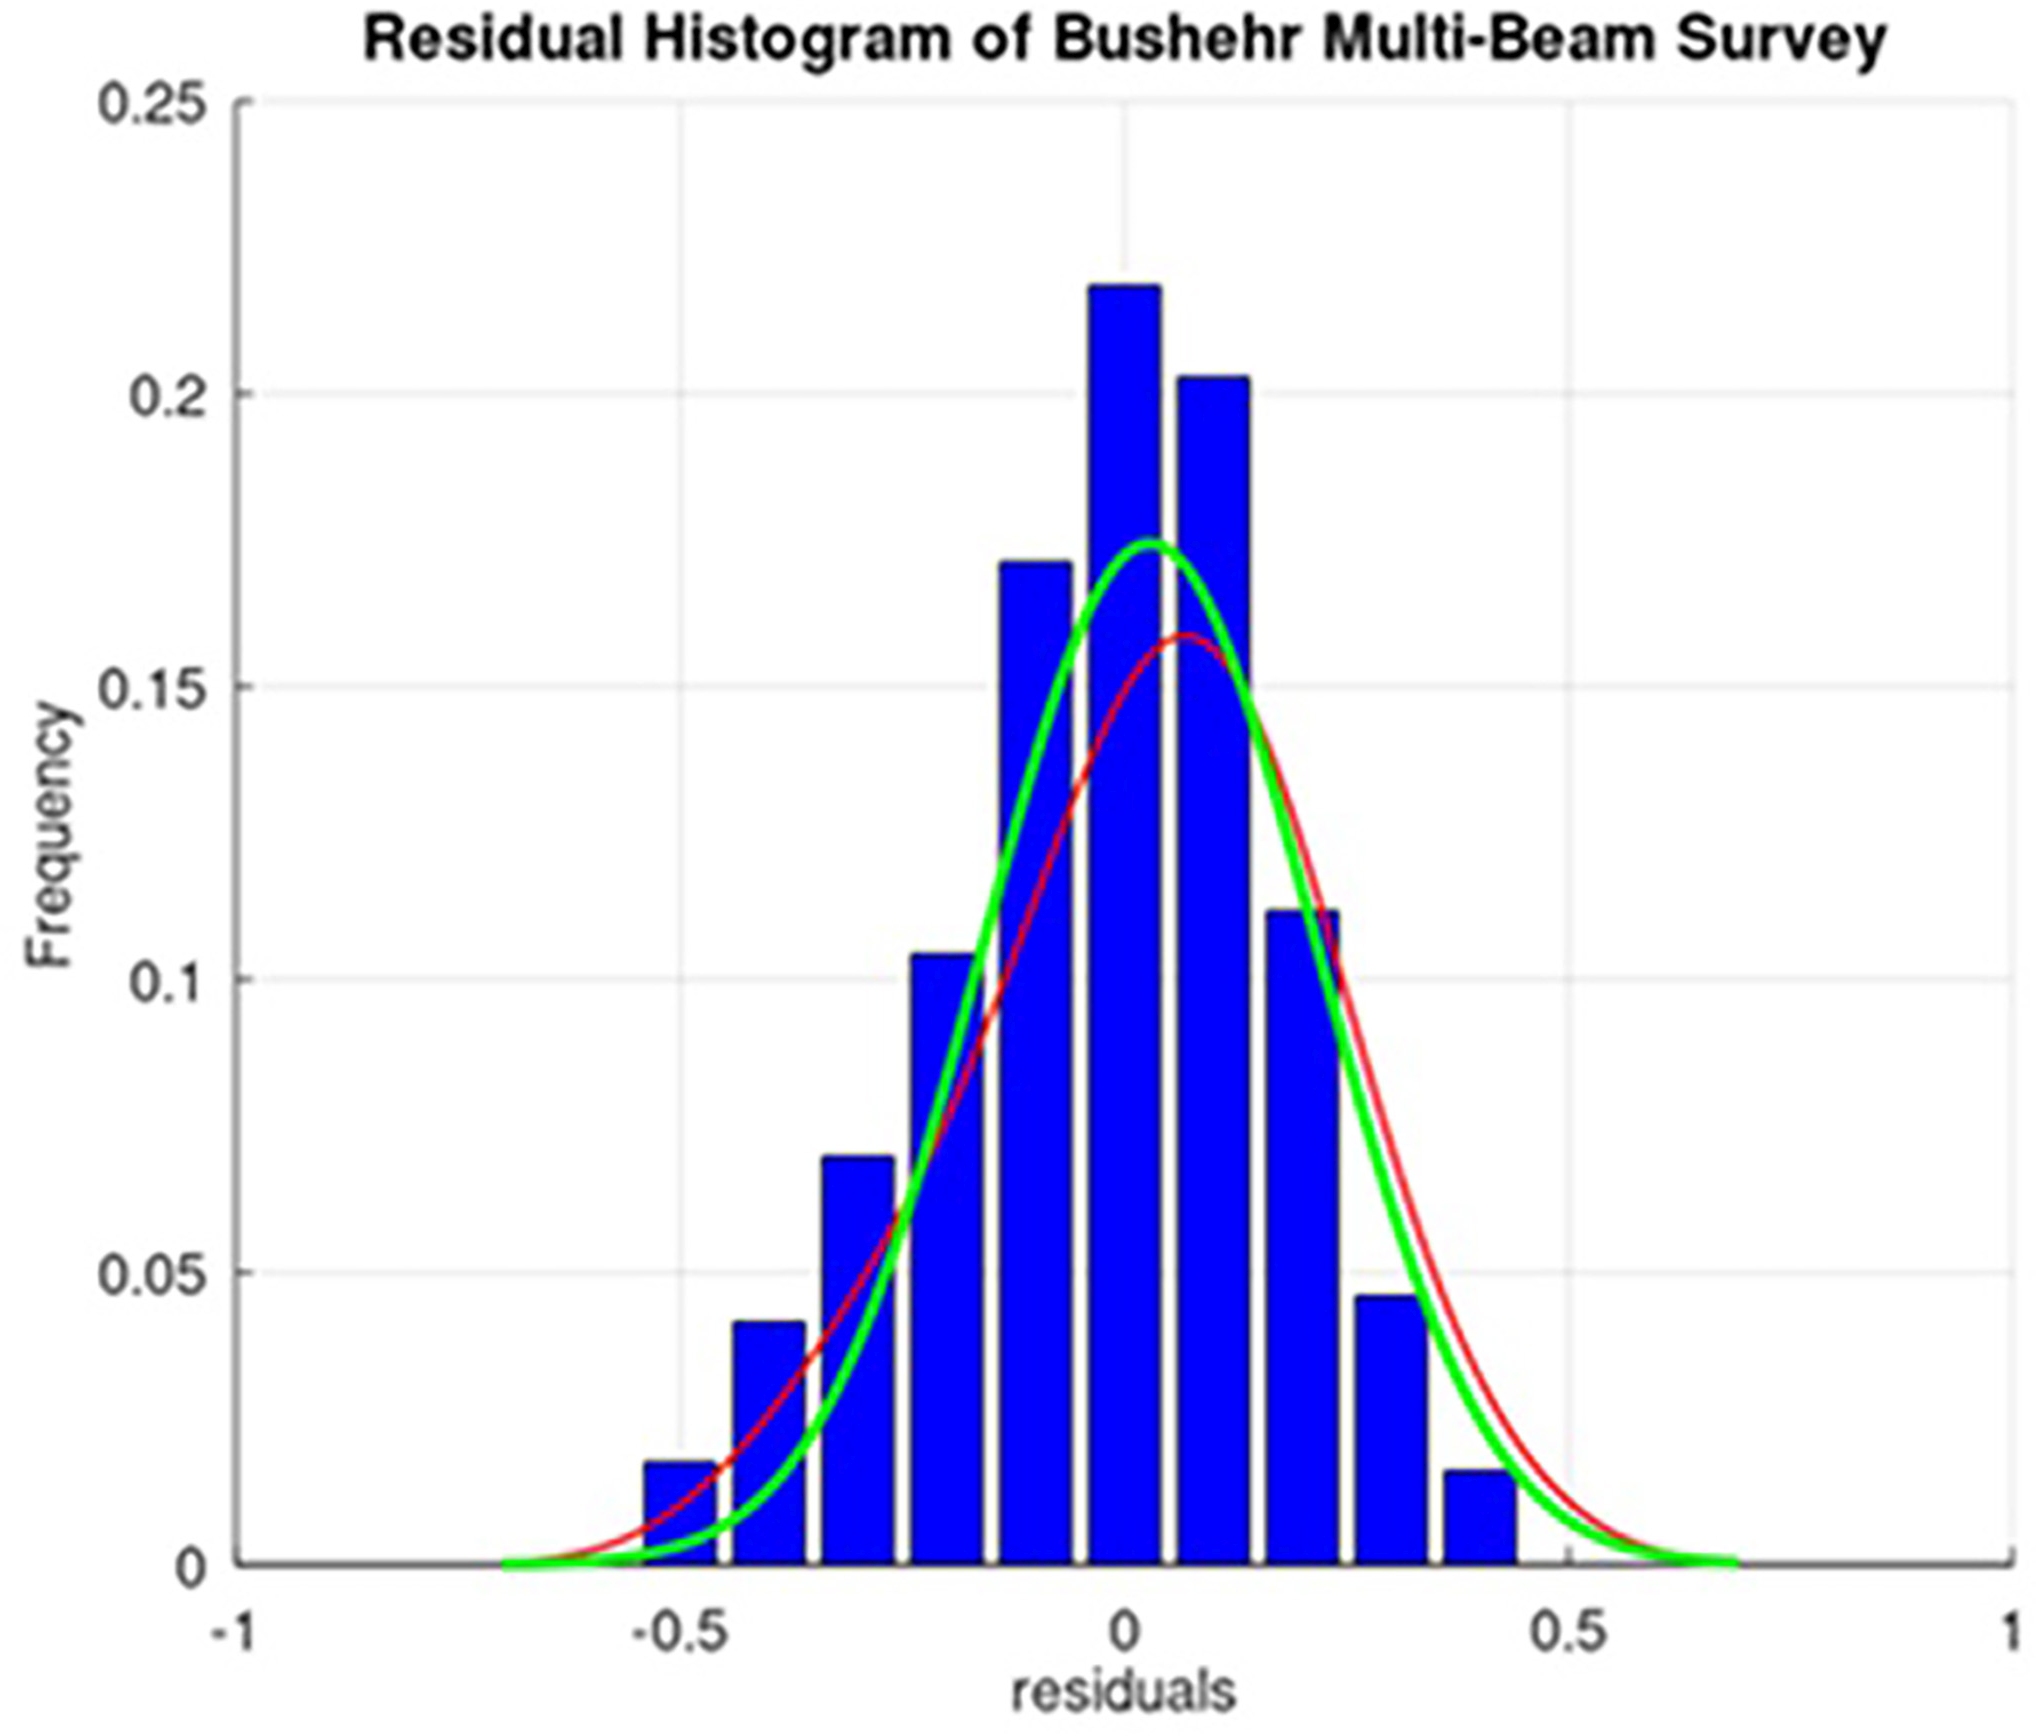
To analyze the statistical characteristics of the differences between the depth-sounding data obtained from the MBES and SBES systems, outlier data were eliminated, and the optimal normal distribution function for the remaining data was identified. In Fig. 13, the red curve illustrates the fitted distribution function, while the green curve represents the theoretical normal distribution. Therefore, it can be stated that the residuals or the difference between two depth soundings closely approximates a normal distribution and lacks significant systematic errors. It is evident that normal distribution function, characterized by a mean of 3 cm and a standard deviation of 8 cm, provides the best approximation for the differences between the depths measured by MBES and SBES, achieving a 98 % confidence interval.
6 Conclusion and recommendations
Ensuring a safe navigation environment in ports and along coastlines is a critical aspect of maritime transportation in the country. In this study, we demonstrated that implementation of advanced depth sounding equipment, such as MBES, can significantly reduce the volume of field operations by up to 50 %, depending on seabed conditions and topography.
Furthermore, establishing a unified and continuous procedure for seabed mapping using data from MBES – rather than relying on interpolation methods and depth estimation between sounding lines in SB surveys – significantly enhances the accuracy of dredging calculations, sedimentation assessments, and coastal maintenance efforts. Nevertheless, this approach necessitates meticulous control and review of guidelines to mitigate errors and confidence intervals associated with surveys using wider beam angles in MBES.
In the studied area, it was observed that depths obtained from SB surveys are generally deeper than those from MB surveys. However, considering the continuous changes in the seabed, the discrepancies in the measured depths are minimal. Given the ongoing need for periodic sedimentation assessments in Iran’s critical ports and channels, future research could concentrate on calculating sedimentation rates utilizing MBES to achieve extensive and continuous seabed coverage.
Acknowledgments
This article is based on the contract for conducting hydrographic surveys in the ports of Bushehr Province, signed between the Marine Affairs Department of the Ports and Maritime Organization and Darya Tarsim Consulting Engineers. The authors would like to express their gratitude to the Marine Affairs Department for their support in facilitating this research. In addition, they express their sincere gratitude to the esteemed anonymous reviewers whose valuable insights and comments have significantly contributed to improving the quality of this study.
References
Bandini, F., Olesen, D., Jakobsen, J., Kittel, C. M. M., Wang, S., Garcia, M. and Bauer-Gottwein, P. (2018). Technical note: Bathymetry observations of inland water bodies using a tethered single-beam sonar controlled by an unmanned aerial vehicle. Hydrol. Earth Syst. Sci., 22, 4165–4181.
Costa, B. M., Battista, T. A. and Pittman, S. J. (2009). Comparative evaluation of airborne LiDAR and ship-based multibeam SoNAR bathymetry and intensity for mapping coral reef ecosystems. Remote Sensing of Environment, 113, 1082–1100.
Ghahfarokhi, S. S. 2020. Studying Methods for Improving the Quality of Multi-Beam Echo Sounder Data (Master’s thesis). University of Tehran, Iran.
Gueriot, D., Chedru, J., Daniel, S. and Maillard, E. (2000). The patch test: a comprehensive calibration tool for multibeam echosounders. OCEANS 2000 MTS/IEEE Conference and Exhibition. Conference Proceedings (Cat. No. 00CH37158), IEEE, 1655–1661.
Hare, R. (1995). Depth and Position Error Budgets for Mulitbeam Echosounding. The International Hydrographic Review, 72(2), https://journals.lib.unb.ca/index.php/ihr/article/view/23178 (last accessed 4 May 2025).
Hare, Rob, Eakins, B. W. and Amante, C. J. (2011). Modelling Bathymetric Uncertainty. The International Hydrographic Review, 6. https://journals.lib.unb.ca/index.php/ihr/article/view/20888 (last accessed 4 May 2025).
IHO (2022). Standards for Hydrographic Surveys (ed. 6.1). IHO Special Publication S-44, International Hydrographic Organization, Monaco. https://iho.int/uploads/user/pubs/standards/s-44/S-44_Edition_6.1.0.pdf (last accessed 4 May 2025).
INCC (2020). Hydrographic Surveying Practices in Iran: Transition from SBES to MBES. INCC Publications, Iranian National Cartographic Center, Tehran, Iran.
Motallebi Korbekandi, M. A. and Zare Zardeyni, A. 2022. Strategies for the Development of Maritime Economy in line with the Goals of a Resistive Economy. Defense Economics, 6, pp. 53–81.
Parnum, I., Siwabessy, J., Gavrilov, A. and Parsons, M. (2009). A comparison of single beam and multibeam sonar systems in seafloor habitat mapping. Proc. 3rd Int. Conf. and Exhibition of Underwater Acoustic Measurements: Technologies and Results, Nafplion, Greece, pp. 155–162.
Pike, S., Traganos, D., Poursanidis, D., Williams, J., Medcalf, K., Reinartz, P. and Chrysoulakis, N. 2019. Leveraging Commercial High-Resolution Multispectral Satellite and Multibeam Sonar Data to Estimate Bathymetry: The Case Study of the Caribbean Sea. Remote Sensing, 11, 1830.
Pratomo, D. and Saputro, I. (2021). Comparative analysis of singlebeam and multibeam echosounder bathymetric data. IOP Conference Series: Materials Science and Engineering. IOP Publishing, 012015.
Saeidi, V., Seydi, S. T., Kalantar, B., Ueda, N., Tajfirooz, B. and Shabani, F. 2023. Water depth estimation from Sentinel-2 imagery using advanced machine learning methods and explainable artificial intelligence. Geomatics, Natural Hazards and Risk, 14, 2225691.
Sotoudehpour, A., Madadi, A. and Asghari Saraskanrood, S. (2020). Geomorphological Monitoring of Bushehr Port Coastline. Geographical Researches, 35, pp. 177–187.
Tajfirouz, B., Saeidi, V., Khalili, H. and Nemati, M. H. (2022). Volume and Rate Estimations of Sedimentation in Amirabad Port During Period 2018-2021. Journal of Geomatics Science and Technology, 11, pp. 115–123.
Whittaker, C., Sebastian, S. and Fabre, D. (2011). Multibeam sonar performance analysis value and use of statistical techniques. The International Hydrographic Review, 5. https://journals.lib.unb.ca/index.php/ihr/article/view/20878 (last accessed 4 May 2025).
Xiao, S. (2003). Effects of Vessel Motion on Echo Sounding in Fisheries. University of Victoria.
Zhi, H., Siwabessy, J., Nichol, S. L. and Brooke, B. P. (2014). Predictive mapping of seabed substrata using high-resolution multibeam sonar data: A case study from a shelf with complex geomorphology. Marine Geology, 357, pp. 37–52.