


Abstract
1. Introduction
Hydrographic surveying comprises three major measurement criteria: geodetic position, bathy-metric depth and water level control (Liu Y, 2003; Zhao, 2007; Xiao et al., 2016). Monitoring of water level control involves installing tide stations, using tidal harmonic predictions and includes non-tide depth determination based on GNSS techniques (Ke, 2012; Zhao et al., 2008; Zhao et al., 2015). When monitoring water level, the length of the observing period for a tide station can be divided into long-term, medium-term and short-term classifications. Long-term station obser-vations are essential for marine environmental monitoring, harbor design and navigation chart-ing. Detecting and correcting gross and systematic errors of long-term tide gauge stations is achieved using tidal harmonic analysis, probability theory and mathematical statistics (Zhao et al., 2007). For medium-term and short-term tide gauge stations, the water level observation time period is much shorter.
A pressure tide gauge positioned at a fixed-point layout has the advantage of being flexible and of high precision for water level determination when applied to coastal depth measurements. This technology is a common tide measurement method for ocean depth measurement (Liu Y, 2003; Zhao, 2007; Xiao et al., 2016). When installed, the gauge and its housing can be affected by the instrument housing engineering, the settlement of the device on a potentially unstable seabed and other physical effects. Due to these factors, the pressure gauge can produce an irregular jitter that is difficult to eliminate, and will directly affect the tide analysis precision, ulti-mately affecting the quality of water depth measurement correction (Xiao et al., 2016; Ke, 2012). The Manual on Hydrography (IHO, 2005) attaches great importance to this issue, for this can also lead to serious errors in subsequent benchmark conversions. The drift in the zero point of the pressure gauge cannot be monitored and corrected in real time during the tide ob-servation. It can only be analyzed when the data is returned after the tide observations are fin-ished. Drift in the zero point cannot be adequately determined on medium and short-term tide station data. It should be detected though, based on the strong correlation with the daily mean sea level measured at adjacent long-term tide stations. Such measurements can then be sub-jected to a method (i.e. sliding mean sea level for each 24 hour) to calculate the average daily sea surface of two tide stations to check how the outcomes can be practical applied (Liu L et al., 2007).
The time synchronization between two stations should be controlled within 24 hours after study-ing the time varying law of the parameters of the least square water level fitting model (Xu et al., 2007). The method of least squares fitting and the number method are combined to deter-mine the zero point settlement, the specific time of settlement, the efficiency of detection and the accuracy of the correction to be improved (Ke et al., 2013). According to the IHO (2005), if irregularities are found in the quality check of the tide data from the adjacent two tide stations, it is necessary to study whether the difference is caused by the tide gauge malfunction, the sen-sor drift or other abnormal height changes. The similarity of daily mean sea level can be used to solve it, but does not explicitly express how to calculate the daily mean sea level. It is also known that, for the problem of irregular drift of tide zero point, it is detected and corrected by calculating the difference between daily mean sea level based on the premise of daily mean sea level similarity in the domestic and international hydrographic field. The effect of short-period tidal data will exist if the daily mean sea level is calculated by the mid-range method, which will affect the detection and correction of the irregular drift of the tide zero point (Huang C et al., 2013).
In view of the uncontrollable occurrence of irregular drift in the tide data acquisition processing when using a pressure tide gauge, as well as the lack of published research on precision and detection of these issues, the authors’ first analyze the formation mechanism of irregular drift at the zero tide. They then put forward the corresponding precise processing model for drift detection and correction. This can then determine a precise time and quantified settlement of the tide zero point and achieve the precise processing of the correction and detection of the zero point irregular drift.
2. Precise processing for the irregular drift of tide zero point
2.1 Establishing a processing model for irregular drift of tide zero point
The pressure tide gauge is a device with a pressure sensor for measuring water level. The pressure value at a fixed depth position underwater is measured in real time, and then the air pressure value is subtracted. The pressure difference between the two values is converted to the height from the pressure sensor to the instantaneous sea surface, to provide a real-time wa-ter level observation. The parameters of the tide gauge will be fixed once in the water, and will not change as external environmental factors change, so the collected data should be corrected by the pressure and density data as soon as the gauge is taken out of the water (Xiao et al., 2016). After the correction of the air pressure and density, the systematic bias of the tide data in the vertical direction is mainly due to the linear and non-linear drift of the tide zero point. This includes the internal drift of the instrument and the irregular drift caused by many external environmental factors.
The first correction principle is relatively simple, and can be accurately calibrated with equipment in a controlled environment such as a laboratory. The second correction can only be analyzed and corrected after the tide observation is over.
This paper focuses on how to solve the second type of irregular zero point drift.
The hourly tide values ( ), starting from the tide zero point of the pressure tide gauge, can be expressed as:

Where, MSL is the long-term mean sea level,  and
and  are amplitude and phase lag constitutes,
  and
and  are the nodal factor and nodal angle, m is the number of constituents,
  is the angular velocity,
  is the astronomical initial phase angle,
  is increasing or decrea-sing water,
  is the hourly drift of the tide zero point (Liu Y, 2003; Zhao J, 2007; Xiao et al., 2016).
Assuming that the long-term tide gauge station is A, and the medium-term and short-term tide gauge station with the pressure gauge is B, normally,  is 0, thus the difference in the daily mean sea level between the two stations, A and B can be expressed as:

Where  ,
,  ,
, are astronomical tide, the increase and decrease of water and the average drift of the B station during the observation period, respectively.
Considering the requirements of the hydrographic survey, the distance between the two tidal stations A and B is generally small. Due to the strong correlation between the increase and decrease of water in a certain spatial scale ,  thus
thus  (Ke, 2013, Liu L et al., 2007; Huang C et al. 2007; Huang C et al., 2013; Pei et al., 2007). Equation (2) can be re-written as:

The daily mean sea level of the adjacent tide stations is strongly correlated. Hence the trend of the two stations should be similar and the magnitude should be close to the value. If the tide zero point of the A and B stations are stable,  should be a constant and
  . The difference in the daily mean sea level between the two stations (
  ) reflects the regular tidal variation caused by the effects of different harmonic constituents. Hence
  magnitude should be at the cm level (Huang C et al., 2007; Huang C et al., 2013).
If the zero point of the B station is unstable for the tide gauge which has been calibrated indoors, the tide zero point drift will be added to and  . The magnitude may be dm or even larger. This will seriously affect the subsequent analysis and use of the tide gauge data. Therefore, in a practical engineering application, the error analysis and detection of the observation data of the medium-term and short-term tide gauge stations should be conducted in advance to determine whether irregular drift exists at the tide zero point. If the value
  is much larger, further corrective action should be taken.
The  should dominate the value and hence
  . The tidal observation of station B can be calibrated by the following formula:

This paper establishes a precise model for the irregular drift of the tide zero point. Compared with the reference writing by Ke (2012), the model can ensure the precise time and the value of the tide zero point settlement in one effort.
2.2 Selection of an optimal model for calculating daily mean sea level
If the tidal observation period is long enough to be greater than 1 year, the data from the two tide gauge stations can be analyzed for long-term harmonic analysis based on equation (1) and  and
and  can be calculated accurately. This method can accurately detect and correct the specific time and magnitude of the irregular drift of the B station tide gauge zero point. However, the observation period of the medium-term and short-term tide gauge stations is generally shorter than 1 year or even shorter than 6 months, which does not have the fine tidal harmonic analysis conditions mentioned above.
The key to using formula (4) is how to weaken the tidal vibration caused by the inconsistency in the astronomical tide at the two tide stations, being . The drift of the zero point of the B tide gauge station is presented as 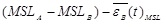 . Therefore, this section focuses on how to improve the calculation accuracy of the daily mean sea level.
Daily mean sea level determination predominantly uses the Mean Method (Ke et al., 2012; Liu L et al., 2010), and the mathematical model is:

The corresponding filter spectrum  is,
is,

An alternative mathematical model for calculating the daily mean sea level is the Godin Method (Huang C et al., 2013; Huang Z et al., 2005) expressed as:


The corresponding filter spectrum  is:
is:

The parameter  in equations (6) and (10) represents the angular velocity of a tidal component. The filter spectrum shows the attenuation factor of the tidal constituent. The magnitude of the absolute value correlates to the filtering ability of the tide (Liu Y, 2003). According to equations (6) and (10), the spectral values of several years, six months, months, half months, days, half days and shorter periods are calculated respectively. The weakening effect of equations (5) and (7) on is quantified and Q1, O1, P1, K1, N2, M2, S2, K2, M4, MS4, M6, Sa and SSa are the 13 main constituents that dominate the change of tidal motion in tidal harmonic analysis whilst the amplitude of the remaining constituents is smaller. The spectral values of different periods are calculated using the Mean and Godin methods and are shown in Table 1.
Table 1. Spectrum of Tidal Components about different Cycle between Mean and Godin methods.
As shown in Table 1, the Godin method reduces the effect of Q1 constituent in  from 11.76% to 0.07%. When compared with the Mean method, the effect of weakening the P1 constituent reduces from 11.18% to 0.05%, and the effect of weakening the O1 constituent reduces from 7.53% to near 0.00%. The effect of weakening the M2 constituent reduces from 3.52% to nearly 0.00%. If the Mean method is adopted, the amplitude of the diurnal constituents and semidiurnal constituents are always dm levels and the effect of the short period constituents in can also be dm level. If the Godin method is adopted, the effect of the short period constituents in can be nearly 0.00%. Overall, the Godin method is considered better than the Mean method in weakening the effect of the diurnal, semidiurnal and short period tidal constituents.
The effect of the two methods is basically the same in weakening the annual, semiannual, monthly and semi-monthly period constituents, which reflects that the daily mean sea level has no weakening ability to the tide constituents when the period is over the daily cycle. Generally, the amplitude of the monthly and semi-monthly constituents are at cm level whilst the amplitude of the annual, semi-annual constituents are dm level, so mainly includes the effect of the annual and semi-annual constituents. From tidal harmonic analysis, there is a large spatial scale in the annual and semi-annual constituents and there is no obvious difference between the amplitude and the lag angle over several kilometres between the stations. Therefore, the non-diurnal period of tide in should be at the cm level.
Based on the analysis above, the accuracy of when calculating the daily mean sea level of the tide station could be improved from dm to cm level using the Godin method and formula (3) rather than the Mean method. The outcome being the observation quality of the tidal level of B tide gauge station can be greatly improved after correcting the irregular drift of the zero point.
3. Analysis of Results
3.1 Analysis of Dinghai and Gangxin Station Data
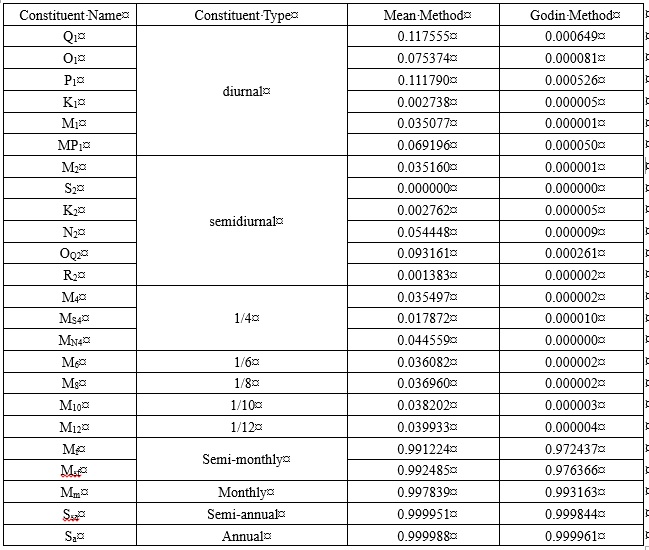
The tidal data collected at the Dinghai long-term station and the Gangxin short-term station near the Zhoushan Islands in Zhejiang Province in the 6 Nov – 7 Dec 2014 synchronization period is used as an example. The linear distance between the two tide gauge stations is about 25km and the tidal properties are all regular semidiurnal tide. A RBR TGR-2050 self-contained pressure tide gauge was used at the Gangxin station and the approximate position of the two stations is shown in Figure 1.
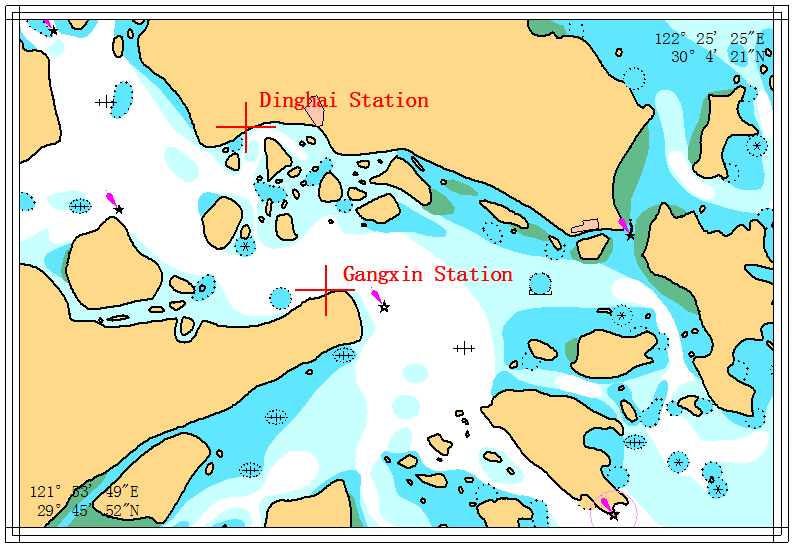
Figure 1. Approximate position of the Dinghai and Gangxin tide stations
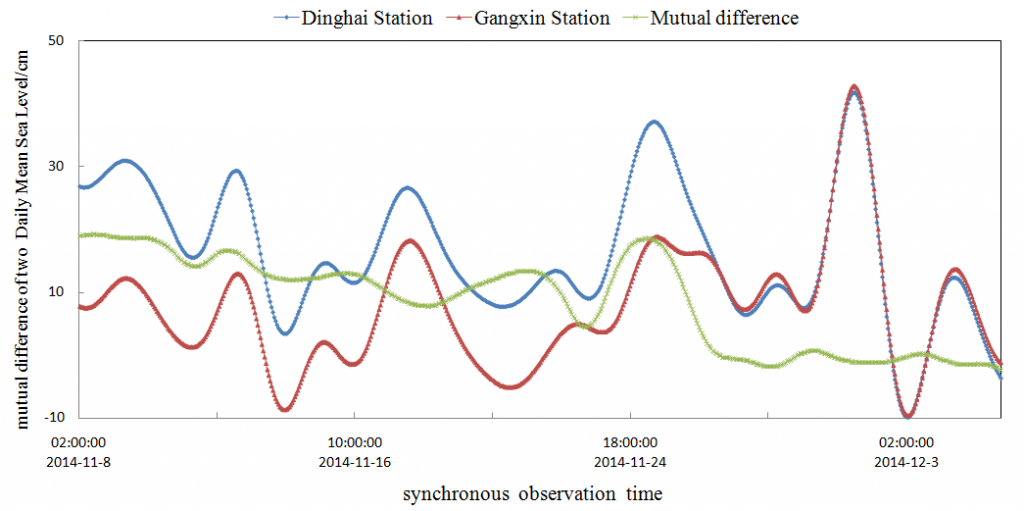
The internal tide zero point drift of the Gangxin station was calibrated prior to deployment. The tidal data collected after the gauge was taken out of the water was corrected by air pressure and density data. First, the tidal data at the same time in Dinghai station are deduced to the long-term average sea level of the station. Since the depth of the zero point of the Gangxin station can be arbitrarily assumed, the tidal observation data of the station is reduced by a constant in order to conveniently compare the tidal data of Dinghai station in the depth direction. As the tidal data in Gangxin station is shifted in the depth direction, the water level observation value curves for the two stations are shown in Figure 2.
It can be seen from Figure 2, that in the period of 11 – 26 Nov 2014, the water level curve (red) of Gangxin station is beneath the water level curve (blue) of Dinghai station, and the difference is not consistent. However, during the 27 Nov – 5 Dec 2014 period, the water level curves of the two stations are basically consistent.
As Dinghai station is a long-term tide station, the tide zero point is stable and reliable, and its data quality is managed through strict controls. Therefore, the water level observation value of the Gangxin station has an irregular zero drift in at least one of the above-mentioned periods, and the maximum value reaches about 30 cm. Hence the specific time and the value of the irregular drift of the tide zero point in Gangxin station should be used for further detailed detection.
3.2 Comparison of calculating daily mean sea level
The Mean Method (formula 5) and the Godin Method (formula 7) were used to calculate the daily mean sea level and the mutual difference. These methods would test whether the accuracy of the calculation can be increased from dm to cm level as discussed in Section 1.2. The results are presented in Figure 3.
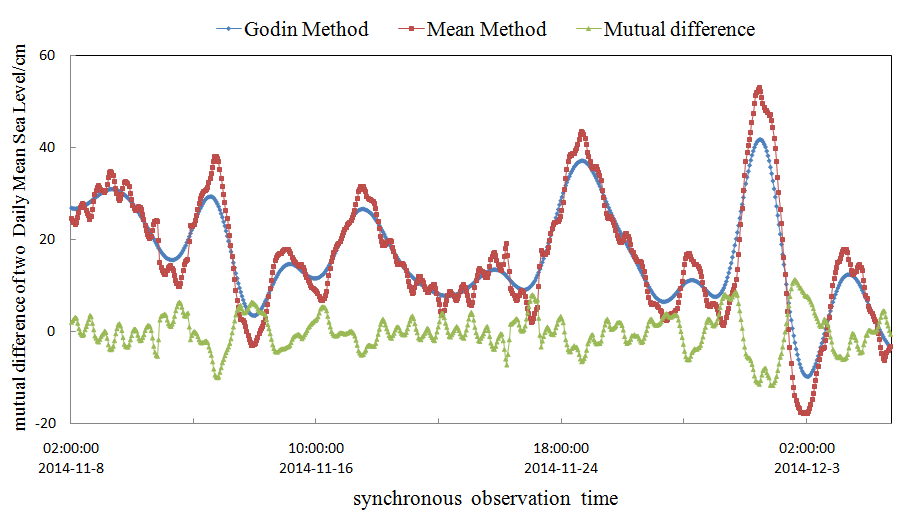
From Figure 3, it can be seen that the jitter in the daily mean sea level calculated by the Mean method is more volatile than that of the Godin method and that shorter periodic disturbances are superimposed. The mutual difference of the mean sea level calculated by the two methods is in the range of -12 to 12cm. This indicates that the calculation results using the Mean method are significantly affected by the daily and even shorter tidal constituents. The daily mean sea level calculated by the Godin method is more stable and is consistent with the theoretical analysis of Section 1.2. Therefore, in engineering practice, the Godin method (formula 7) is preferred to calculate the daily mean sea level.
3.3 Precise processing the irregular drift of tide zero point at Gangxin Station
The daily mean sea level and the mutual difference between the daily mean sea level of Dinghai station and Gangxin station are calculated using the Godin method and the partial results are shown in Figure 4.
As shown in Figure 4, during the period of 8 – 27 Nov 2014, the mutual difference in the daily mean sea level between the two stations ranges from 0 to 20 cm, with continuous and circuitous irregular changes. This shows that the tide zero of the Gangxin station point has circuitous irregular drift. This may be the result of strong ocean currents and the supports of the tide gauge being displaced, overturned or fallen. In this case, a strong irregular jitter at the tide zero point occurs and the drift is significant, requiring the data of this period to be zero point corrected. The phenomenon is more complicated than the simulated data used in the reference writing (Ke, 2012), and the processing is more difficult. In the period of 27 Nov – 27 Dec 2014, the mutual difference between the two mean sea levels ranges between -1.5 to 0.3cm. The drift value is in the cm level, and the tide zero point is considered stable during the period. It can be determined that the data between 27 Nov and 5 Dec 2014 is reliable for the Gangxin station.
To rectify the mutual difference of the daily mean sea level between the Dinghai station and the Gangxin station shown in Figure 4, formula (4) was used to correct the zero point drift of the whole observation data in Gangxin station during the 6 – 27 Nov 2014 period. The daily mean sea level and the mutual difference between the two stations was recalculated using the Godin method to assess the actual effect of tide zero irregular drift correction in Gangxin station. Partial results are shown in Figure 5.
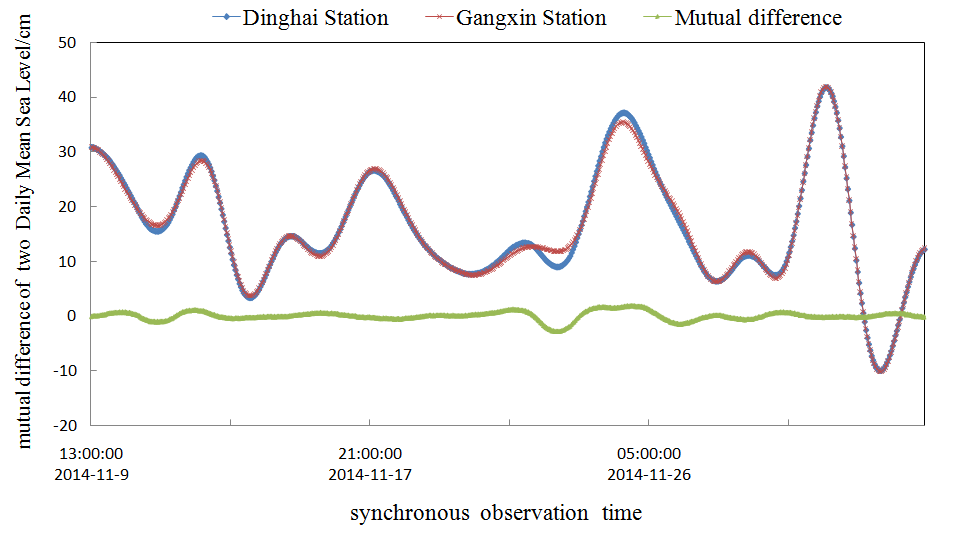
Figure 5. Mutual difference of Amended Daily Mean Sea Level by the Godin Method between Gangxin and Dinghai
Comparing Figures 4 and 5 following the irregular drift correction of the tide zero point in Gangxin station, the mutual difference of the daily mean sea level between the two stations during 6 Nov – 7 Dec 2014 synchronization period is now -2.8 to 1.2cm and the variation range is at the cm level. The difference is mainly caused by the inconsistency of the amplitude and the lag angle of the non-daily period of the two stations of which the magnitude is within the reasonable range. This shows that the tide zero point of the Gangxin station has basically reached a stable state after correction. In this case, the range of zero tidal correction is from 0 to 20cm. From this work, the accuracy of the water level observation data has significantly improved from dm level to cm level after the correction of the tide zero point in Gangxin station.
3.4 Analysis of Jiangsu Dafeng and Sanyazi Station Data
To further validate the precision processing model of the tide zero point proposed in this paper, the hourly data collected between 1 – 31 July 2016 in Jiangsu Dafeng harbour long term tide station and Sanyazi short term station were analyzed.
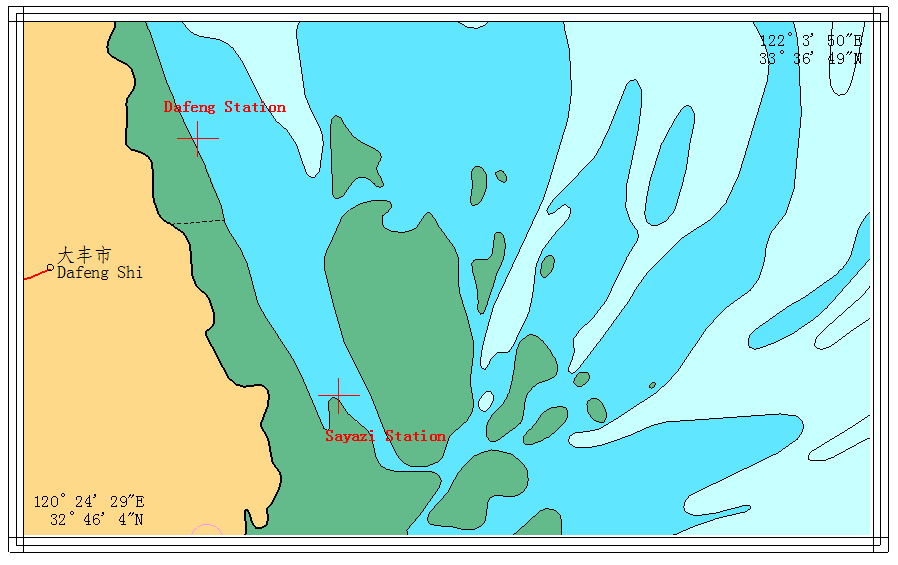
The linear distance between the two tide gauge stations is about 30km. The tidal properties are similar, being regular semidiurnal tide ports and the difference of tidal time between the two stations is about 50 minutes. The Sanyazi station uses the RGB-3050 self-contained pressure tide gauge. The locations of the two stations are shown in Figure 6.
The tide gauge and data pre-processing used in Sanyazi station are the same as those used at Gangxin station. The synchronous water level curve of the two stations is shown in Figure 7.
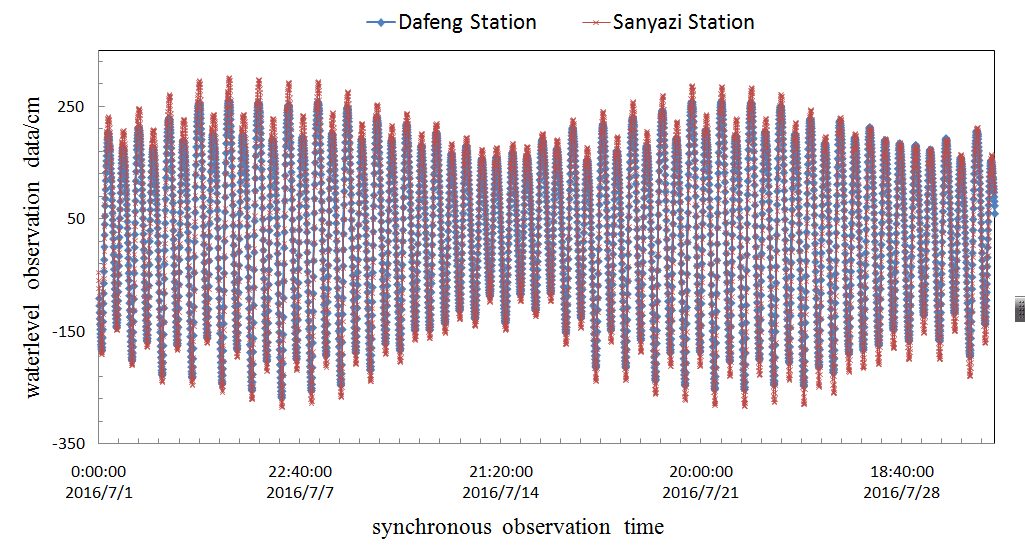
It can be seen from Figure 7, that the water level curve (red) of the Sanyazi station is higher than the water level curve (blue) of Dafeng Station during the period of 1 – 14 July 2016 and the difference is not constant. During the period 21 – 31 July 2016, the water level curve of the Sanyazi station is lower than the Dafeng station and the difference is also not constant. When compared with the water level data of the Gangxin station in Figure 2, the tide zero point of the Sanyazi station in the above-mentioned period has a nearly linear irregular drift, with the drift being more significant than that of the Gangxin station.
The daily mean sea level and the mutual difference between the two stations was recalculated using the Godin method to assess the actual effect of tide zero irregular drift correction in Gangxin station. Partial results are shown in Figure 8.
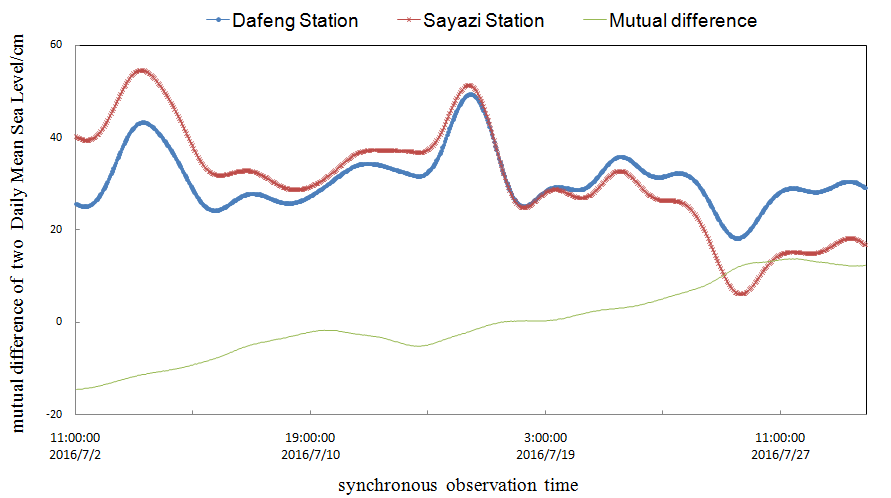
Figure 8 shows that the mutual difference of the daily mean sea level of the two stations is -14 to 13cm during the 1 – 31 July 2016 period, and that the change is continuous and irregular. This indicates that the tide zero point in Sanyazi station has been in an unstable state. Sanyazi station is located in the Subei area where the maximum tidal range can be up to 7m. The tidal trend in the area is rapid with the zero point change irregular. This makes planning temporary tide stations difficult.
To rectify the mutual difference of the daily mean sea level between Dafeng station and Sanyazi station shown in Figure 8, formula (7) was used to correct the zero point drift of the whole Sanyazi station observation data during 1 – 31 July 2016. The daily mean sea level and the mutual difference between the two stations was recalculated using the Godin method to assess the actual effect of tide zero irregular drift correction in Sanyazi station. Partial results are shown in Figure 9.
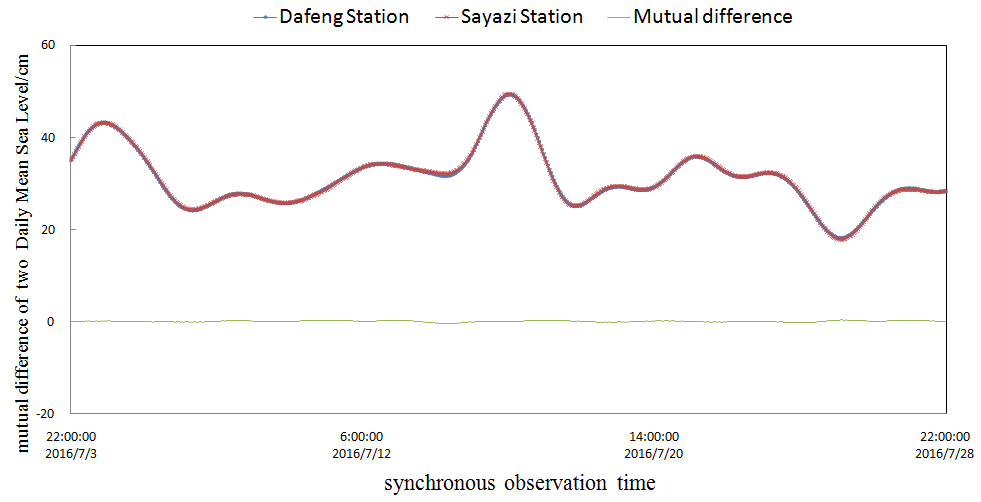
Comparing Figures 8 and 9, following the irregular drift correction of the tide zero point in Sanyazi station, the mutual difference of the daily mean sea level between the two stations during 1 – 31 July 2016 synchronization period is now -0.1 to 0.2cm and the variation range is at the cm level.
Comparing the locations of Dinghai and Gangxin station (Figure 1), there are several island barriers, whilst no island barriers exist between Dafeng and Sanyazi stations (Figure 6). Although the distance between the latter two stations is larger than the former stations, the tidal characteristics are more similar, hence the effect caused by the inconsistencies of amplitude and phase of the non-daily constituents is also smaller. This can be seen in the comparison between the magnitudes of the mutual difference of daily mean sea level in Figures 5 and 9. Figure 9 shows that the tide zero point in Sanyazi station has basically reached a steady state after correction and the zero tidal correction is in the range of -14 to 13 cm.
The accuracy of the observation data has improved from dm level to cm level after the tide zero point correction in Sanyazi station. Although the irregular drift of the Sanyazi station is more significant than that in the Gangxin station, it is simpler to correct the tide zero point, as the tide zero point of Sanyazi station is in a linear drift and the accuracy of the correction is also improved.
4. Conclusion
In this paper, a precise processing model for determining and correcting irregular drift of tide gauge stations in medium-term and short-term tide stations is established, and quantitative analysis is carried out through practical examples. The results show that the new model improves calculation processing, efficiency and accuracy as follows:
- It is feasible and reasonable to adopt the mutual difference of the daily mean sea level as the parameter to detect the tide zero point drift in medium-term and short-term tide stations;
- The daily mean sea level calculated by the Godin method has advantages compared with the Mean method in weakening the influence of diurnal, semidiurnal and even shorter constituents. This is equivalent in weakening the effect of the constituents over diurnal period;
- According to the Godin method, the daily average sea surface is calculated and the detection of tide zero point irregular drift is determined. From field work, the accuracy of the tidal observation data of the Gangxin station is improved from 20cm to cm level. The accuracy of the tidal observation data of the Sanyazi station is improved from 27cm to cm level.
It should be noted that medium-term and short-term tide stations do not have the basic observation periods for accurately determining the astronomical tide level and increasing or decreasing the water using the long-term tidal harmonic analysis. We can however detect and calibrate the random drift of the tidal zero based on the premise of the average sea surface similarity. This is widely practiced in the international hydrographic field.
5. References
Huang, C., Bian, G., Lu, X., Wang, M., Huang, X., and Wang, K. (2017). “Analysis of Error Sources and Quality Assessment for MultiBeam Sounding Products”. International Hydrographic Review, 11: 23-37.
Huang, C., Huang, M., and Miao, S. (2007). “Tide Monitoring and Issuing System of Huanghua Port in China”, China Harbour Engineering, 147(1):51-53.
Huang, C., Wei, G., and Zhai, G. (2013). “Method for Separation of Residual Water Levels in Hydrographic Survey”, Hydrographic Surveying and Charting, 33(6):5-10.
Huang, Z. and Huang, L. (2005). Tidal Theory and Calculation, Qingdao: Publishing House of Ocean University of China.
IHO. (2005). Manual On Hydrography (C-13), International Hydrographic Organization, Monaco.
Ke, H. (2012). Research on the Implementation of Seamless Vertical Reference Surface, Wuhan, Wuhan University.
Ke, H., Zhao, J., and Zhang, H. (2012). “Study on the Detection and Repair Method of the Short-Period Tidal Gauge Observation System Error”, Geomatics and Information Science of Huhan University, 37(7):843-846.
Liu, L., Miao, J., and Li, B. (2010). “Analysis Research on Zero Drift Detection and Correction Method of Pressure-type Tide Gauge”, Hydrographic Surveying and Charting, 30(4):73-75.
Liu, Y. (2003). Space Structure and Data Processing about Hydrographic Surveying. Beijing, Surveying and Mapping Press.
NOS. (2003). Computational techniques for tidal datums handbook, NOAA Special Publication, NOS CO-OPS 2, National Ocean Service, Silver Spring, Maryland.
Pei, W., Niu, G., and Dong, H. (2007). “Residual Water Level and Tide difference Method”, Journal of Waterway and Harbor, 28(6):439-443.
Xiao, F., Liu, Y., and Bao, J. (2016). Introduction for Hydrography. Beijing, Surveying and Mapping Press.
Xu, J., Liu, Y., and Bao J. (2010). “Temporal Variation Law of Parameters of Least Square Fitting Model”, Geomatics and Information Science of Huhan University, 35(12):1418-1421.
Zhao, J. (2007). Modern Marine Surveying and Charting. Wuhan, Wuhan University Press.
Zhao, J., Wang, S., and Zhang, H. (2008). “Long-Distance and On-the-Fly GPS Tidal Level Measurement Based on GPS PPK/PPP”. Geomatics and Information Science of Huhan University, 33(9): 910-913.
Zhao, J., Dong J., and Ke H. (2015). “High Precision GPS Tide Measurement Method in a Far-Distance and Transformation Model for the Vertical Datum”. Geomatics and Information Science of Huhan University, 40(6): 761-766.
Zhao, J., Ke, H., and Zhang, H. (2011). “Comprehensive Detection and Repair Method for Long-Period Tidal Gauge Observation Errors”. Geomatics and Information Science of Huhan University, 36(12): 1490-1494.
6. Author Biographies
Senior Engineer HUANG Chenhu
HUANG Chenhu has been a surveying engineer in the Naval Institute of Hydrographic Surveying and Charting since 2009. He previously worked in the Naval Survey Troop from 2004 to 2009 and was appointed as the substitute captain of the survey unit. He is engaged in hydrographic surveying theory and data processing and has extensive experience in multibeam sounding data processing and tide analysis.
Email: hchhch-1997@163.com
Dr LU Xiuping
LU Xiuping is currently an engineer in the Naval Institute of Hydrographic Surveying and Charting. He was appointed as the Director of the Survey Department. He was engaged in the new technology of hydrographic stereoscopic surveying. He received his Doctor’s degree in Navigation Guidance and Control in 2011 from the Naval University of Engineering.
Email: hchhch-1997@163.com
PH.D SUN Weikang
SUN Weikang is a PHD student at the College of Geomatics in Shandong University of Science and Technology. She also studies in the First Institute of the Oceanography, SOA. Her major is marine survey and her research field is tide data and satellite altimetry data processing and the construction and transformation of the vertical datum.
Email: sunweikang@fio.org.cn
Dr HUANG Xianyuan
HUANG Xianyuan is currently an engineer in the Naval Institute of Hydrographic Surveying and Charting. He is engaged in hydrographic surveying and data processing. He received his Doctor’s degree in Geodesy and Surveying Engineering in 2011 from the Surveying and Mapping Institute of Information Engineering University of PLA.
Email: hchhch-1997@163.com
Dr DENG Kailiang
DENG Kailiang is currently an engineer in the Naval Institute of Hydrographic Surveying and Charting. He was engaged in hydrographic surveying and data processing. He received his Doctor’s degree in the Department of Hydrography and Cartography of Dalian Naval Academy.
Email: hchhch-1997@163.com
PH.D ZHAO Xianghong
ZHAO Xianghong is a PHD student in the Department of Hydrography and Cartography of Dalian Naval Academy. He is engaged in hydrographic surveying and data processing.
Email: hchhch-1997@163.com