

Abstract
1. Background
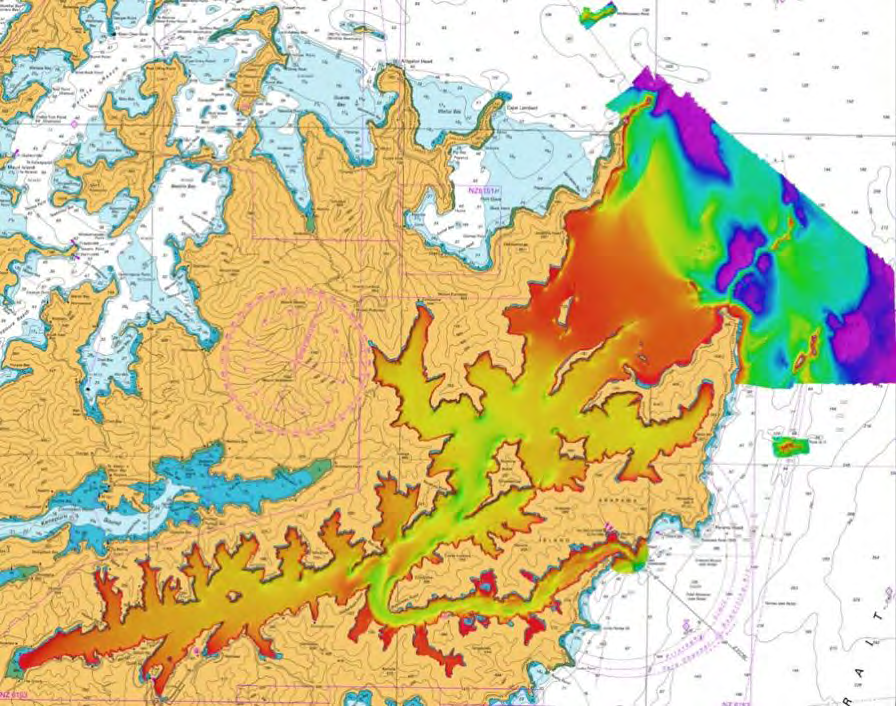
Queen Charlotte Sound / Tōtaranui comprises 320km of deeply indented coastline, formed by a drowned valley system with generally steep sides and a relatively flat seafloor (Figure 1). The northern entrance lies between Cape Jackson and Cape Koamaru, an area which shoals from 380m to 20m depths. It contains shallow banks and rock ridges giving rise to extremely turbulent waters with strong currents, eddies and upwellings. The eastern entrance is through Tory Channel / Kura Te Au where very strong tidal streams enter and exit the Sounds through a narrow passage. The two approaches merge at Dieffenbach Point from where the Sound leads inland to Picton and Anakiwa.
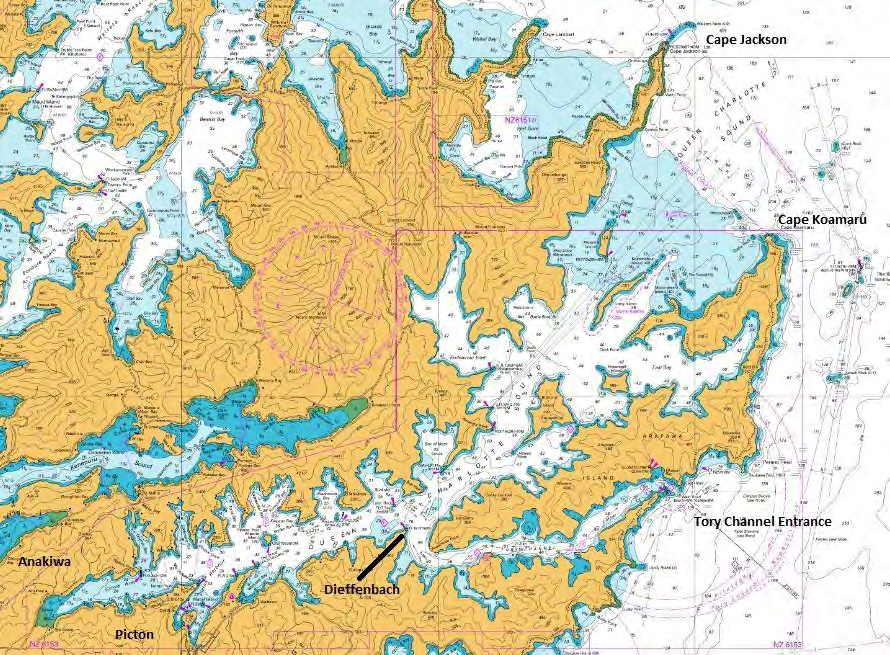
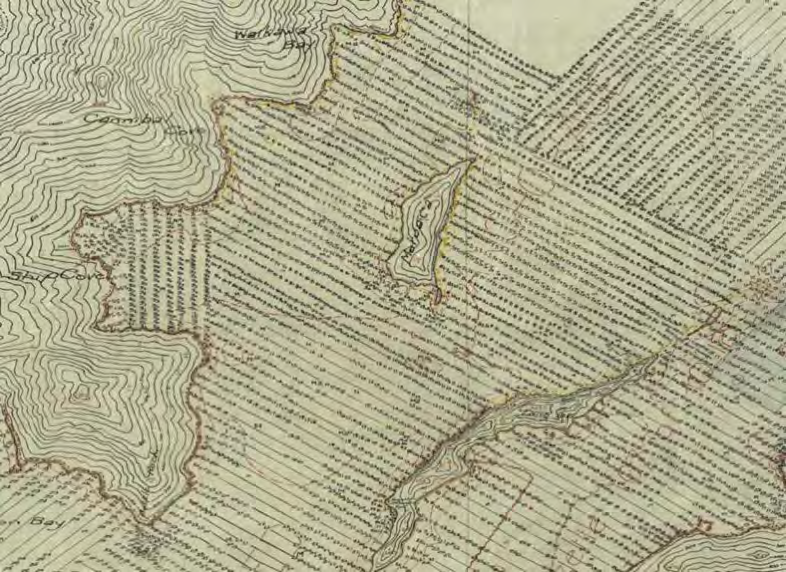
The last full survey of the area was undertaken in 1942-43 by HMS Elaine (Figure 2). Additional areas in Tory Channel / Kura Te Au and the northern approaches to Queen Charlotte Sound / Tōtaranui were surveyed by the RNZN in 1978 and 1984. An area adjacent to Long Island was surveyed by MDC in 2005. All these surveys were undertaken with single beam echo sounding (SBES) systems operating either wet paper recorders or electronic stylus digital depth recorders. Positioning was by sextant resection or two range trisponder microwave positioning. Only the 2005 MDC survey used DGPS for positioning.
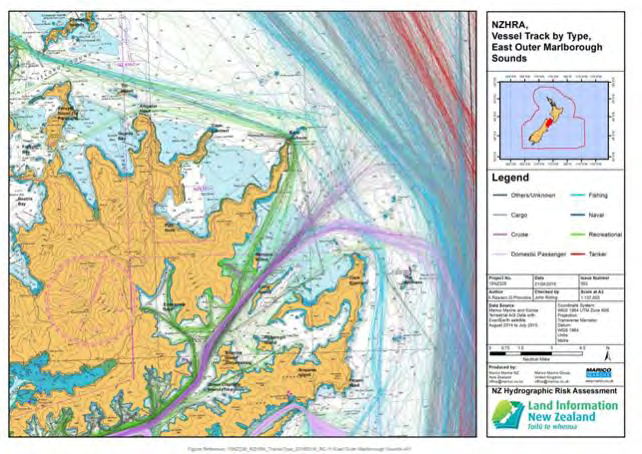
Using the results of the New Zealand Hydrographic Risk Assessment (Figure 3), LINZ identified Queen Charlotte Sound / Tōtaranui and Tory Channel / Kura Te Au as a priority to undertake a modern hydrographic survey. LINZ was also investigating opportunities to collaborate with stakeholders to maximise efficiencies by utilising the survey assets for other activities closely aligned to LINZ objectives. Following discussions with MDC, LINZ discovered they had scientific focused survey needs in the Sounds and through a Memorandum of Understanding, both parties worked together to redefine the survey requirements.
As the New Zealand Hydrographic Authority, LINZ requires data and information to improve the accuracy and adequacy of the nautical charts for the area. The LINZ requirements and specifications(LINZ, 2016b) are well known, have been in use for decades and are based on the International Hydrographic Organization (IHO) Standards for Hydrographic Surveys, S-44(IHO, 2008).
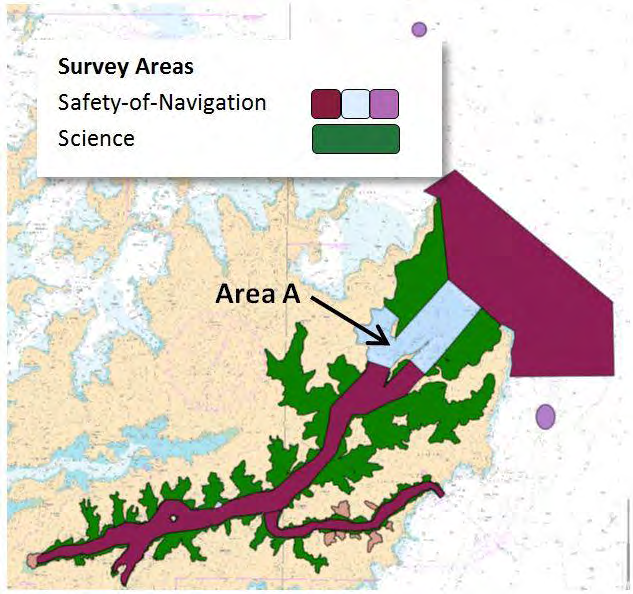
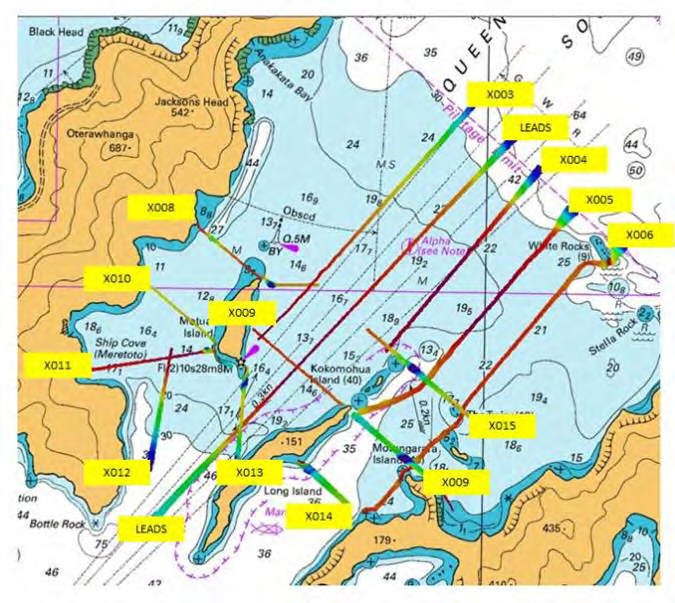
As the agency responsible for maritime safety within their area of jurisdiction, MDC has similar requirements for safety of navigation. Of priority was the delivery of data by January 2017 to enable the MDC harbour master to make a decision on the location of a pilot boarding station close to Long Island (Figure 4 – Area A), and preferred routes for larger vessels entering the Sound from the north east. In addition, in late 2019 large-scale celebrations in Ship Cove and other locations around New Zealand will commemorate the 250th anniversary of Lieutenant James Cook’s arrival in New Zealand. As there is expected to be a large number of vessels attending, and the current published chart uses survey data from 1942-43, there is a need to ensure the chart is updated with new data well in advance.
MDC also requires information to support its environmental monitoring, management and decision making processes. In particular, the characterisation and mapping of seabed habitats, benthic terrain modelling to classify habitats and ecosystems, and the identification of biogenic (or living) habitats important for biodiversity throughout the entire Sounds area were all required. Specifications for the science component took some time and effort to finalise to ensure the requirements were well understood and explained.
2. Survey Fieldwork
Two vessels were used for the survey, RV Ikatere, operating a Simrad EM2040 multibeam echo sounder (MBES) and RV Rukuwai operating a Simrad Geoswath to provide Side Scan Sonar (SSS) coverage and an ODOM CV100 single beam echo sounder (SBES) system. NIWA and DML personnel operated from local accommodation established in Waikawa for two periods of fieldwork, from 12 October to 16 December 2016 and from 7 February to 22 June 2017. There were between 3 and 5 DML personnel and a similar number of NIWA personnel on site at all times. The survey involved 195 days on the survey ground during which both vessels were operating. The MBES sounding took 136 days and the Geoswath and SBES work took 44 days each. Collecting ancillary data such as positioning of lights and beacons, measuring light sectors, seabed sampling and checking the coastline took a further 24 days. Installing seven tide stations, levelling the associated benchmarks and monitoring tide throughout the survey took 43 days. Weather downtime was only 6 days, whilst 16 days were lost to MBES component failures/replacement/recalibrations. During some of the MBES downtime, the survey vessel was used for other survey tasks.
3. Challenges
Tides
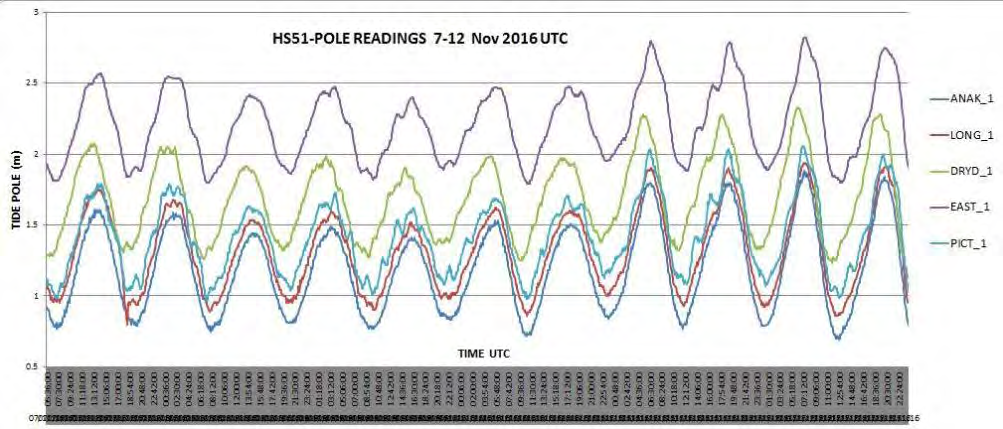
A total of seven tide stations were installed for the survey to provide vertical control and connect to Chart Datum throughout the survey area. It was anticipated that these gauges could all be linked together and a linear interpolation tidal correction model be developed to provide a seamless surface representing Chart Datum. However, after logging water level data for several weeks, it became apparent that the tidal regime was non-linear and uniquely different in various parts of the Sound. Time lags, seiching, varying range and the effects of weather in Cook Strait were seen in the tidal data. Figure 5 shows overlapping tide curves for 5 gauges.
The application of standard datum transfer methodologies to derive datum was replaced by undertaking a series of harmonic analyses using at least 30 days’ data for each tide station. The first complete 30 day dataset was expected late November/early December 2016, allowing the datum to be defined and depths for the priority area reduced and validated in time for rendering to MDC by January 2017.
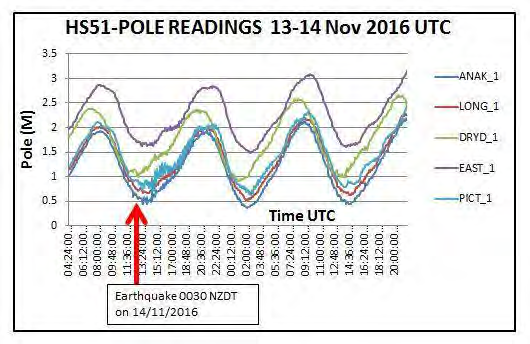
This first 30 day set of data for tidal observations was disrupted by the Kaikōura Earthquake on 14 November 2016 (Figure 6). The tidal data was corrupted for several days and required additional checks and levelling between benchmarks to verify that relationships between gauges, tide poles and benchmarks had not changed. Only minor shifts (<3cm) were observed at all stations. This disruption to data caused by the earthquake meant the determination of datum was not possible until February 2017 at the earliest.
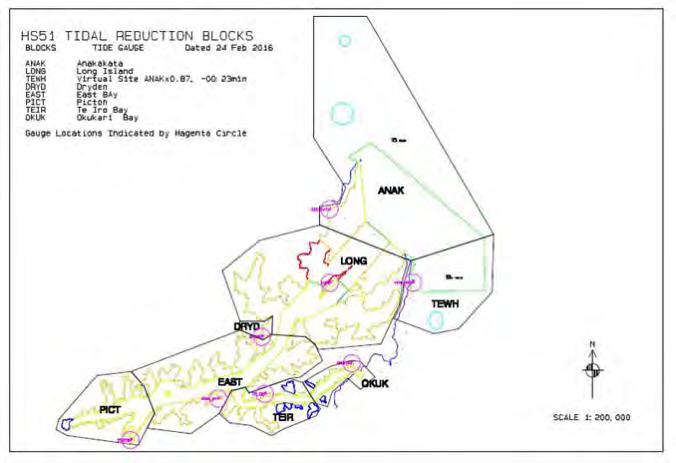
In view of the challenges with the tidal regime and the delay in defining effective sounding datum for each site, the tidal correction methodology was changed from a linear interpolation to applying simple block corrections based on a defined geographic area around each tidal station. This approach allows tidal corrections to be re-applied at a later date post-survey should a better tidal model be developed. The boundaries for the area within which each tidal station was applied, were set to ensure there was minimal step in tide between adjacent tide reduction blocks. Using a survey line that crossed each boundary, a comparison was able to be made on each side to verify that the tidal step was within the allowable total vertical uncertainty (TVU) of the specifications. The steps across boundaries were quite small and varied between 0.01m to 0.17m, with one boundary step at 0.25m which was in an area of water depth greater than 40m depth.
The challenge of defining datum at each station also meant that field processing and checking of survey data for coverage and gaps were undertaken using provisional sounding datums for each tide station. Whilst the best value at the time, using provisional datums meant that all data needed to be reprocessed for final tides postsurvey.
Deliverables and deadlines
For most hydrographic survey work, clients receive results at the end of the job, when all data has been checked and validated to ensure specifications have been met. For this survey, three sets of deliverables were required at different times during the survey:
- MDC required bathymetry and coastline for Area A (Figure 4) by January 2017;
- LINZ required complete deliverables of the same area by May 2017, and
- LINZ draft deliverables for the entire survey area by January 2018.
The challenge of these various deliverable requirements and dates lay in the planning, coordinating, monitoring and directing personnel involved in processing and survey fieldwork at the same time. As data capture continued, specific activities such as checking aids to navigation and the coastline, were undertaken in addition to processing, checking and rendering portions of the survey data. Having a robust process for recording which data had been processed and what had happened to it was essential to avoid any loss or duplication. Essentially the work involved running two smaller surveys inside a larger survey.
Achieving the MDC requirements meant completing all fieldwork for Area A before departing the survey ground in December 2016. Sounding of Area A was top priority and was proceeding on schedule until the Kaikōura Earthquake occurred on 14 November 2016. A possibility existed that the earthquake had altered the already surveyed seafloor and that work may need to be repeated. To determine if this had occurred, a series of close spaced MBES check lines (Figure 8) were run through the area already sounded to identify whether there had been any changes to the seafloor that exceeded survey depth accuracy specifications. The range of mean differences was -0.03m to +0.04m. These checks confirmed depths were within the required accuracy standards and there had been no significant change to the seabed as a result of the earthquake. However, the earthquake also disrupted the time series to be used for the determination of datum for Area A. This resulted in depth data rendered to MDC being classed as provisional.
In addition to these checks, MDC requested checks were carried out around the wharves in Picton to understand what, if any, changes had occurred before permitting vessels alongside. Data for Area A delivered to MDC in January 2017 included a dense XYZ depth dataset of 32 Megabytes, 2 Megabytes of plotted XYZ depths, 4x 1:10,000 plots and a survey report. This was adequate for MDC planning purposes and has enabled decisions about pilotage routes and Aids to Navigation to be progressed (Figure 9). A comparison of the difference in density of data points from Cook’s 1770 chart (Figure 10) and surveys used for charting between the 1942-43 survey (Figure 11) and the 2017 survey (Figure 12) of Ship Cove is readily seen (images at approximately same scale).
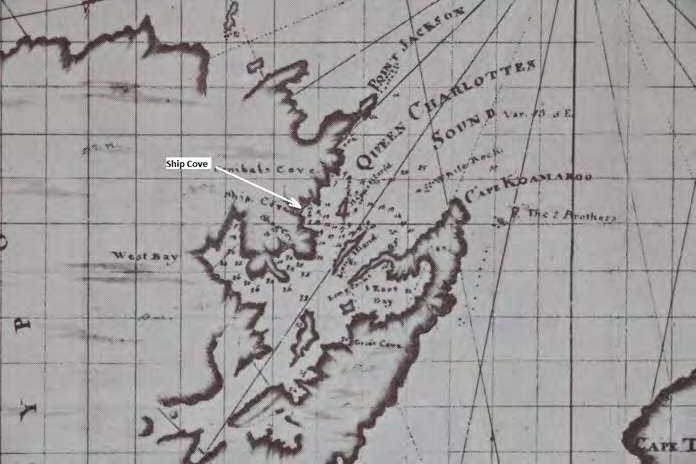
Figure 10. Portion of Cook’s 1770 chart of Cook Strait and Queen Charlottes Sound 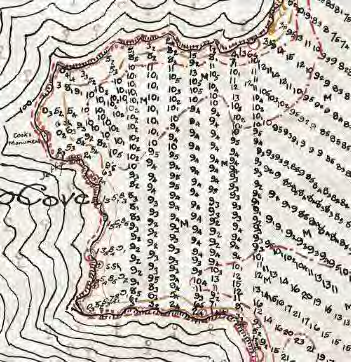
Figure 11. Ship Cove survey 1942-43 (depths in fathoms), Depths represented at a scale 1:25,000 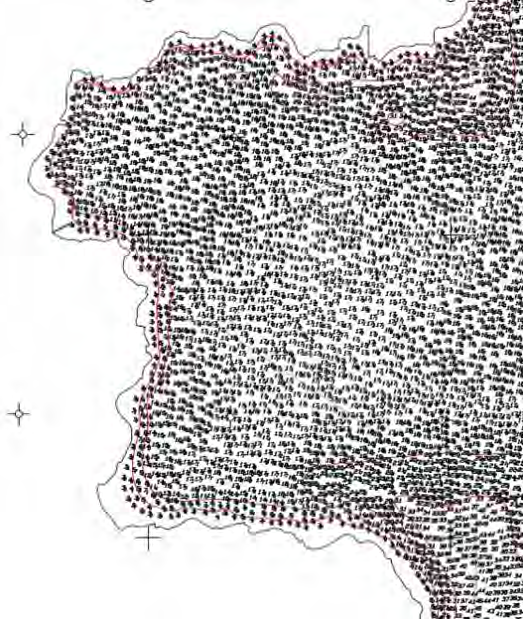
Figure 12. Ship Cove survey 2017 (depths in metres), Depths represented at a scale 1:10,000 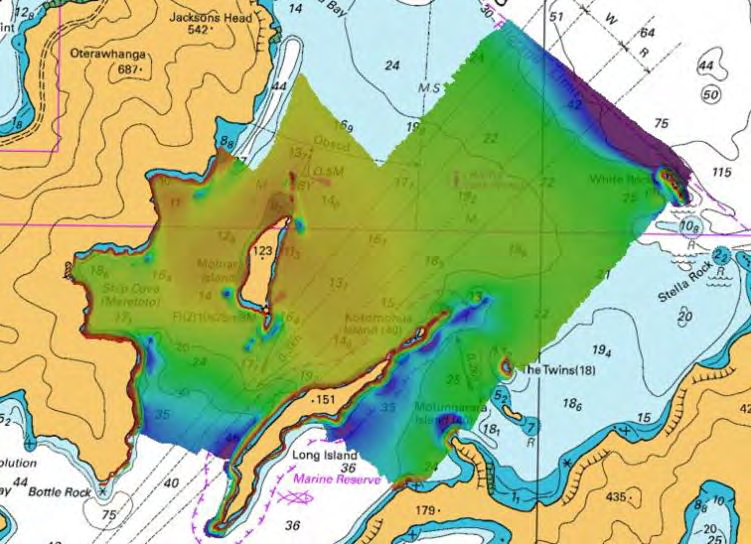
Figure 9. Area A – MBES final coverage
Compilation of the LINZ May 2017 deliverables for Area A required full reprocessing of the dataset using the approved tidal datums and a thorough checking of the combined final surface and compilation of LINZ specified reports and datasets. Draft LINZ deliverables for the entire survey were compiled and rendered in late December 2017 and data volumes are listed at Table 1.
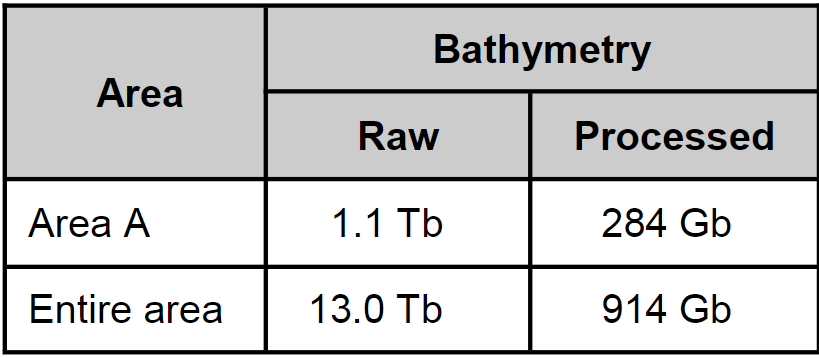
Due to the large data volumes, processing computers were not available for other work at times. The time required to load daily project files and generate a bathymetric surface ranged from 12 to 48 hours per block. When edits made to the block surface (Figure 13) were unloaded back to raw files or data was exported the time required could be as long as 48 to 96 hours. Making a backup copy of a block project could take anywhere between 12-18 hours. Examples of the data density are shown at Figures 14 (chart) and 15 (MBES data overlay).
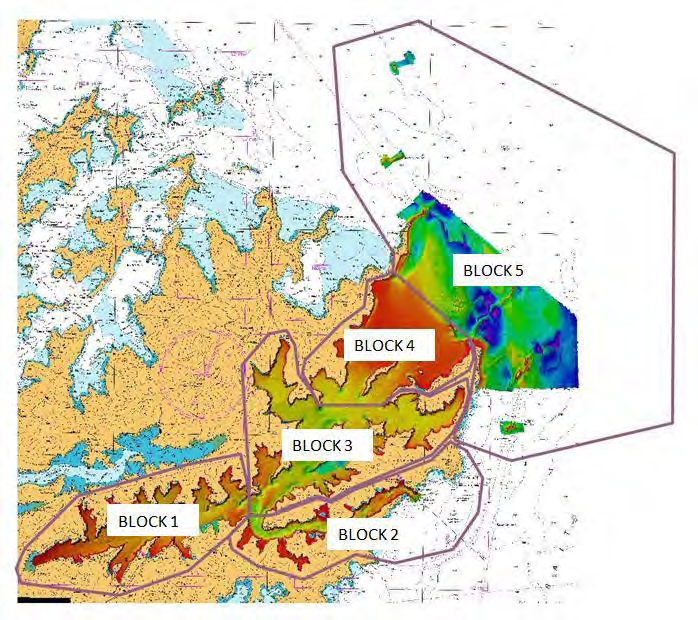
Figure 13. Five Processing Blocks 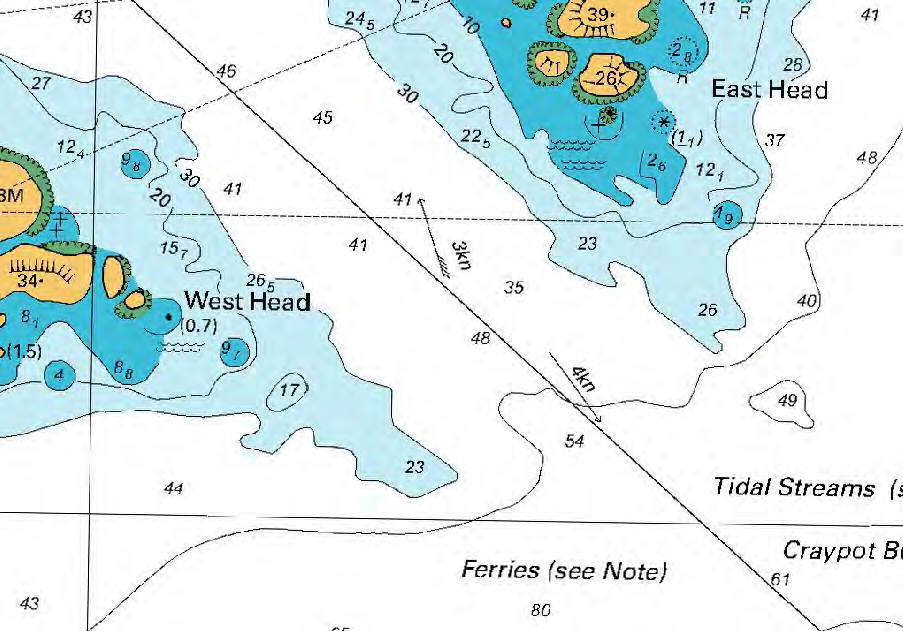
Figure 14. Tory Channel / Kura Te Au Entrance Chart 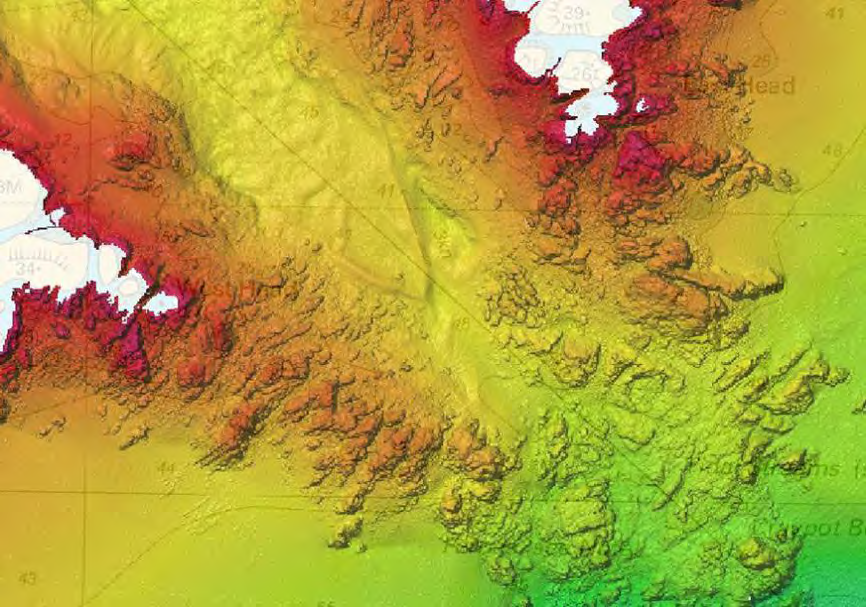
Figure 15. MBES data overlaid on Figure 14 area
Achieving the processing task took a total of 6,700 man hours expended by a dedicated team of four personnel working in shifts of two each day from 8 July to 5 December 2017. Apart from the tedium of data cleaning for 6 hours, personnel were challenged with managing and tracking the volume of data as they worked across different data blocks containing 14,084 MBES and 964 SBES data files.
Data Collection to achieve specifications in outer QCS and Approaches
When planning an MBES survey, the estimated time to be spent collecting data is derived by assessing the expected depth of water, the anticipated swath coverage (in degrees), the ping rate of the MBES (number of times the sounder will transmit/receive per second) and the required survey depth accuracy specifications. For this survey, the specifications were order LINZ-1 (LINZ, 2016b) depth accuracy in depths greater than 5m. LINZ-1 requires that the total allowable depth uncertainty (TVU) in metres at 95% confidence level, is obtained from the following formula.
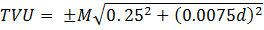
(Where is the LINZ order multiplier, in this case =1.5, = depth, and 0.25 and 0.0075 are the maximum allowable TVU values at 95% confidence level for IHO Special Order surveys (IHO, 2008). The resulting graph of depth accuracy (Figure 16) shows that at a depth of 5m the accuracy required is 0.38m, at depth 20m 0.44m, at depth 50m 0.67m, at depth 100m 1.18m, and at depth 200m m. LINZ-1 specification also defines criteria for the minimum horizontal size of a target that must be detected. For depths less than 40m, a target size of 2m or more must be detected by 3 pings alongtrack and 3 pings acrosstrack. In water depths greater than 40m, the minimum target size is 5% of the depth. The graph of target size for depth (Figure 17) shows that at 50m deep, a target 2.5m in size must be detected, likewise at 100m, a target 5m, and at 200m, a target 10m.
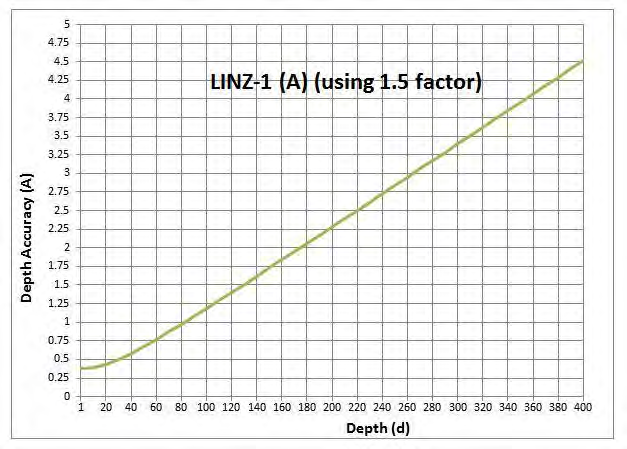
igure 16. Depth Accuracy for LINZ-1 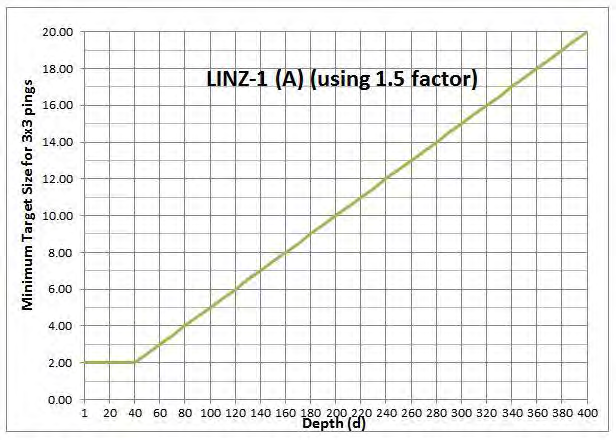
Figure 17. Target Detection Criteria for LINZ-1
There are a number of factors to be considered when operating MBES in changing water depths. As depths increase, the ping rate decreases due to additional time required for the MBES to receive seabed detections between individual pings. To maintain high ping rates the swath width can be reduced e.g. from 120° to 110° or less, but this sacrifices seafloor coverage. As ping rates reduce in deeper water, the vessel speed must be reduced to ensure target detection criteria are maintained. Additionally the vessel track needs to be straight to ensure horizontal ping spacing is consistent and not cartwheeling or swinging around making gaps in the data. When depths exceed 75-100m, the MBES transmit frequency may need to change to enable seafloor tracking and detection to continue. To ensure survey specifications were achieved, the online hydrographic surveyor constantly monitored the relationship between MBES swath coverage, ping rates, frequency, target detection and depth.
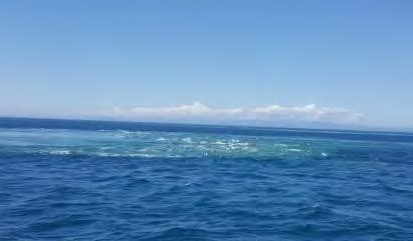
Several challenges were encountered during the survey when collecting MBES data in the outer areas of this survey. One was the impact that the seafloor topography and tides had on the sea surface. Strong currents, eddies, upwelling (Figure 18), overfalls and turbulence caused by the ridges and valleys across the Entrance and by the Brothers Islands, meant that the vessel survey line orientation, vessel speed and at times heading and motion were affected. To ensure the target detection criteria was met, there were times when the vessel could only survey in one direction – heading into the tidal stream. Sounding in the same direction as the stream would mean the vessel was travelling too fast to meet the criteria. Also, at times the vessel heading could be thrown 30° off course by turbulence, causing gaps in MBES data necessitating reruns.
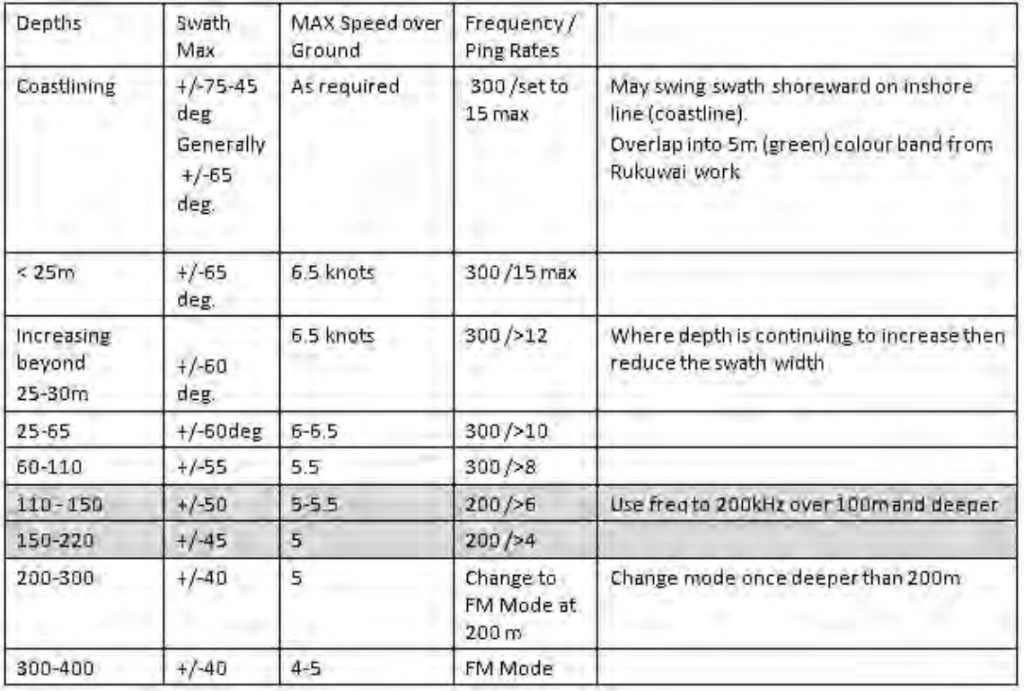
A second challenge was how quickly depths fluctuated in the area requiring operators to monitor swath widths to ensure satisfactory ping rates for target detection. This challenge was overcome by limiting operations for that period to particular depth bands and covering the deeper areas another day. A set of guidelines (Table 2) were developed for operators to use to ensure specifications were met.
The third challenge was managing the best use of weather conditions, as this outer area was at least 1 hour vessel transit time each way from the operating base. Unfortunately weather forecasts were not always reliable which meant a vessel was sent to survey in this area only if at least four hours work on site could be achieved within the forecast conditions.
The greatest challenge of this outer area was in exceeding the time planned for sounding and the potential for this time overrun to impact on other survey tasks. Estimates of the effort before the job were that it would take 80 hours (10 days) to survey. In reality, due to the challenges listed above; the need to infill gaps; and resurvey areas where data did not meet specification, it took a total of 230 hours of sounding spread over 35 days to complete.
Kelp and dolphins
One of the more entertaining challenges of the survey involved the SBES work in Tory Channel / Kura Te Au where survey lines were 150m apart. There are extensive areas of fast growing kelp (Macrocystis pyrifera) that rise from depths of approximately 8m to the surface along both sides of the Channel (Figure 19) and then flow along the surface, changing direction with the tidal stream. To sound through these areas meant dragging and collecting clumps of kelp on the echo sounder frame (Figure 20), necessitating frequent pauses in work to cut the kelp free and clear the sounder.
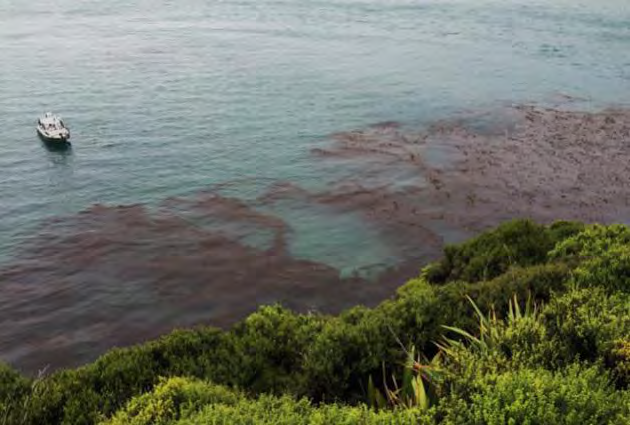
Figure 19. Kelp at Scraggy Point 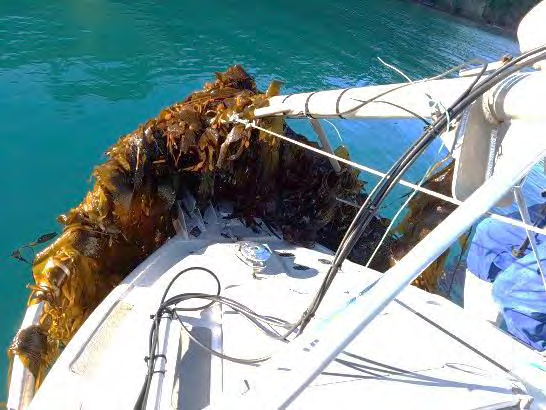
Figure 20. Clump of Kelp on SBES
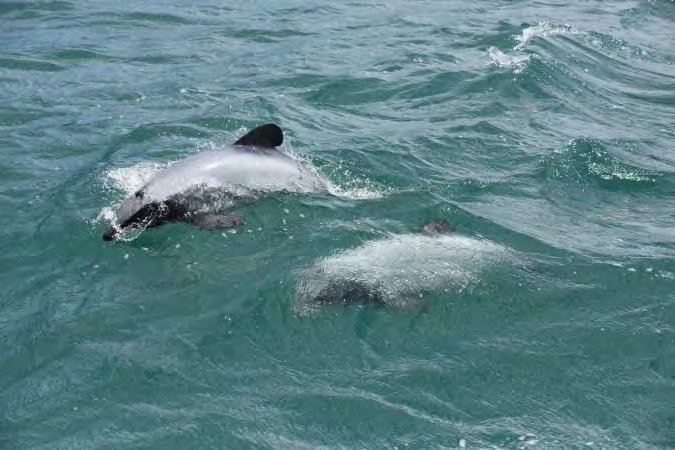
Vessels inevitably attract the attention of dolphins (Figure 21) who want to investigate what this interesting sound is and play in the vessel wake. From the outset, MDC recognised the need to ensure dolphins were not harmed or impacted by survey operations and commissioned an independent review to determine what, if any, risk existed. The report provided operational guidelines to ensure interactions with dolphins were kept to a minimum. When dolphins were sighted close to the survey vessels, work was halted until they had moved on. MDC also established a Marine Mammal Liaison Group to help manage public concern about the MBES interactions with dolphins. The group involved iwi, an Environmental Non-Governmental Organisation and members of the community. This provided a useful mechanism for keeping people informed through regular reports from NIWA. The outcome was that public expressions of concern quickly evaporated. A record of all sightings and interactions with dolphins was maintained and supplied to MDC.
4. Conclusion
The survey of Queen Charlotte Sound / Tōtaranui and Tory Channel / Kura Te Au presented all involved with a number of challenges, some not previously experienced. During the project development stage, LINZ and MDC worked closely together to understand each other’s requirements and how they should be translated into a specification and tender documentation. As mentioned, specifications for a hydrographic survey are well known and understood by LINZ and survey contractors. However, clearly describing the requirements and specification for the science component posed challenges as no standard set of specifications exist. International best-practice for the collection of seafloor backscatter was followed, although this only forms part of the specifications.
Subsequent to this survey, LINZ is collaborating with the Ministry of Primary Industries (MPI) on a survey between Kaikōura Peninsula and Cape Campbell. Learnings from the Queen Charlotte Sound / Tōtaranui survey were applied to the science specifications for this survey, which are generally the same.
NIWA and DML experienced challenges due to the location’s geography, natural environment, technical difficulties and, of course, an earthquake. The results will provide a new dataset for LINZ to update the navigation charts in areas last surveyed in 1942-43. It will also provide MDC with a significant baseline dataset to monitor environmental changes in the Sounds. Of note, it is estimated that over 5.5 billion depth points were collected during the survey by the MBES and is a significant dataset that will be freely available to the public (Figure 22).
Benefits of the survey go far beyond the chart updates and baseline environment data. There is a need for standardised national specifications for the collection, processing and representation of science data and information. It is recognised that scientific aims may vary in different regions, so a standard specification may be difficult to develop. However, it would be reasonable to have a common approach, such as the guidelines produced by the GeoHab Backscatter Working Group (Geohab, 2015) as well as the production of benthic terrain modelling and seafloor classification.
For further information contact:
Stuart Caie, Senior Hydrographic Surveyor, LINZ, scaie@linz.govt.nz or
Steve Urlich, Environmental Scientist, Marlborough District Council, Steve.Urlich@marlborough.govt.nz
Dr Helen Neil, National Projects Manager – Marine Geologist, NIWA, Helen.Neil@niwa.co.nz
Kevin Smith, Business Manager, DML, kevin@dmlsurveys.co.nz
5. References
- Geohab, (2015). Backscatter measurements by seafloor-mapping sonars: Guidelines and Recommendations. Publication by GeoHab Backscatter Working Group, May 2015.
- IHO, (2008). Standards for Hydrographic Surveys (S-44), 5th Edition, International Hydrographic Organization, Monaco, February 2008.
- INZ, (2016a). New Zealand Hydrographic Risk Assessment – South Island. Report 15NZ326-C, Issue 1, 31 July 2016. https://www.linz.govt.nz/sea/charts/annual-work-programme/new-zealand-hydrographic-risk-assessments
- INZ, (2016b). Contract Specifications for Hydrographic Surveys, Version 1.3, 7 June 2016. https://www.linz.govt.nz/sea/charts/standards-and-technical-specifications-for-our-chart-and-hydrographic-work
- Maling, P.B. (1969). Early Charts of New Zealand, 1542-1851, AH&AW Reed.
6. Author Biographies
Stuart Caie, after completing a BSc. (Hons) Surveying and Mapping Sciences degree in 1989, Stuart spent 16 years working as a Hydrographic Surveyor in the Oil & Gas and telecommunications industry based in the UK. In 2005 Stuart moved to New Zealand and joined Land Information New Zealand (LINZ) in May 2006 as a Senior Hydrographic Surveyor within the New Zealand Hydrographic Authority.Stuart lead the New Zealand Hydrographic Risk Assessment project, an evidenced based, risk lead assessment to prioritise future hydrographic surveys around New Zealand. The subsequent long-term prioritised survey programme, HYPLAN, was published in 2017. Stuart has responsibility for maintaining HYPLAN and has oversight of the assessment of maritime safety information for Notices to Mariners and radio navigational warnings; and the validation and verification of hydrographic survey data rendered as part of LINZ contracted surveys for use in the production of nautical charts. Within the region, Stuart has represented New Zealand at the IHO South West Pacific Hydrographic Commission meetings and led a number of workshops funded by the IHO Capacity Building Sub-Committee. The workshops aim to build the capacity and capability of Pacific Island Countries to meet their international obligations for the provision of hydrographic services. Stuart is also working on a NZ Aid programme, the Pacific Regional Navigation Initiative, which is focusing on navigation-safety aspects in the South West Pacific, where LINZ is the charting authority responsible for producing and maintaining charts for the Cook Islands, Niue, Samoa, Tokelau and Tonga.
Email: scaie@linz.govt.nz
Bruce Wallen has been involved in the hydrographic industry in New Zealand for over 30 years. Initially with the Hydrographic Service of the RNZN, then as Hydrographic Advisor for LINZ, he is now a practising field surveyor with Discovery Marine Ltd. Based in Auckland, Bruce is a qualified IHO Cat-A hydrographic surveyor and served as a Member of the Council of the NZIS representing the NZIS Hydrographic Professional Stream from 2013 to 2017. Throughout his career he has been involved in a range of single beam and multibeam surveys for national charting, port and marina maintenance and coastal and inland waterway monitoring and management. He has surveyed throughout New Zealand and as far afield as Antarctica and the Pacific Islands. He has been involved in national policy and technical specification design and development and recently received an Australasian Hydrographic Society Award of Merit for Career Achievement in Hydrography.
Email: bruce@dmlsurveys.co.nz