


Abstract
1. Introduction
An accurate representation of the seafloor or riverbed bathymetry is of high importance for purposes such as safe navigation and nautical chart production. Currently, MBES systems are used for the collection of high-resolution bathymetry data by performing a large number of measurements which are processed to obtain a more ordered structure such as a grid. Approaches for assigning a depth to the grid cell’s center often employ the shallowest or mean depth in a cell. In this paper, we introduce a number of alternatives to the two current approaches based on a combination of the mean depth and statistical properties of the depth measurements.
2. Mean and Shallowest Depths
The most straightforward candidate for the depth at the cell center is the shallowest depth which is of primary importance for safe navigation. The disadvantage of using this depth value, is that the resulting grid might be unrealistically shallow due to the presence of erroneous (shallow) measurements. To overcome this drawback, one can use the mean depth. However, problems might occur as hazardous objects might be left undetected.
3. Mapping depths based on regression coefficients
Considering all soundings that are located within a cell (assuming a large enough cell and/or hit count), a linear plane can be fitted through these depth measurements, where its regression co-efficients account for the potential presence of slopes. The depth at an arbitrary location in the cell can be derived by using the intercept of the plane and the regression coefficients. As the slopes are assumed constant over the cell, the mathematical shallowest depth is derived by identifying the shallowest depth amongst the depths at the four corners.
4. Mapping depths based on (corrected) standard deviation
To mitigate the drawbacks of the mean and shallowest depth, one has to ensure that the effect of outliers is accounted for, while avoiding an artificially deep grid. One approach is to use the combination of the mean depth and standard deviation of the depth measurements. The standard deviation can be seen as a measure that also accounts for the presence of slopes. Hence, the standard deviation is not solely a representative of the measurement uncertainties. Another alternative is to use a combination of the mean depth and the standard deviation corrected for the slopes present in the cell. This measure should represent the mean depth in a cell, while being corrected for the uncertainties in the measurements. However, for regions with slopes this might overestimate the depths.
5. Results
5.1 Data Description
The introduced alternatives are applied to data derived from two surveys, one in the vicinity of the Eemshaven seaport (A) and one in the Westerschelde estuary (B) (Figures 1 and 2 respectively). The MBES used for the data acquisition was an EM3002D and around 85 million soundings were obtained in each survey.
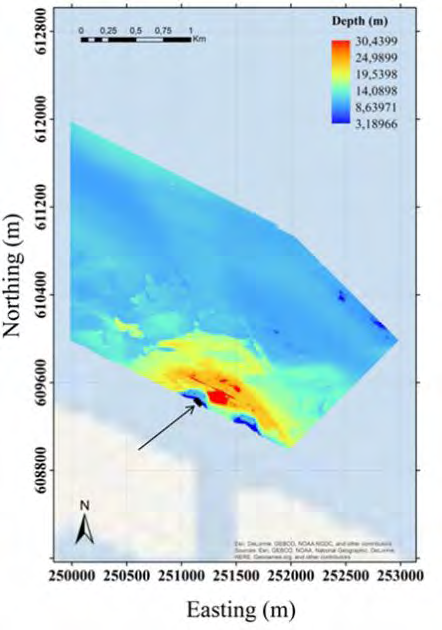
Figure 1. Bathymetry map of the area A in the vicinity of the Eemshaven seaport. The black thick line indicates the location where the seafloor profile is obtained (see Figure 8). 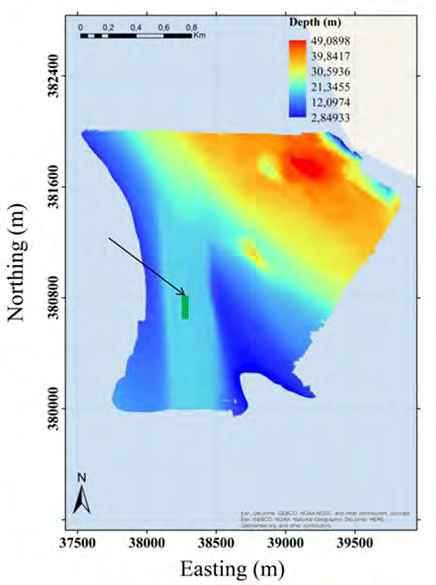
Figure 2. Bathymetry map of the area B in the Westerschelde estuary. The green thick line indicates the location where the seafloor profile is obtained (see Figure 9).
Depth variations occurring over a relatively small distance in the southern part of area A (Figure 1) and the existence of a man-made trench in area B (Figure 2), have motivated us to assess the performance of the different alternatives in these regions.
It should be noted that the statistical features (regression coefficient, corrected and uncorrected standard deviation) are calculated using a dedicated software module. The module enables statistical features to be calculated only if the number of soundings in a cell exceeds five (at least 3 are required to determine the parameters of the linear plane and the additional soundings are for increasing the degrees-of-freedom). Otherwise, Not-A-Number (NAN) values are returned for the cell. In order to assign a realistic value to the statistical features for the cell with less than 6 soundings, use is made of the average values of eight neighboring cells.
5.2. Shallowest depth using regression coefficients
Using the mathematical shallowest depth based on the regression coefficients, results in unrealistic depth values for some cells. As an example, for a cell in the area with a mean depth of 40.2 m, the mathematical shallowest depth returned by the method is 14.9 m which is unrealistic given the cell size. The point cloud of the data is processed to investigate the cause. Figure 3 shows the distribution of the soundings within this cell. As can be seen, the points are spatially not well distributed.
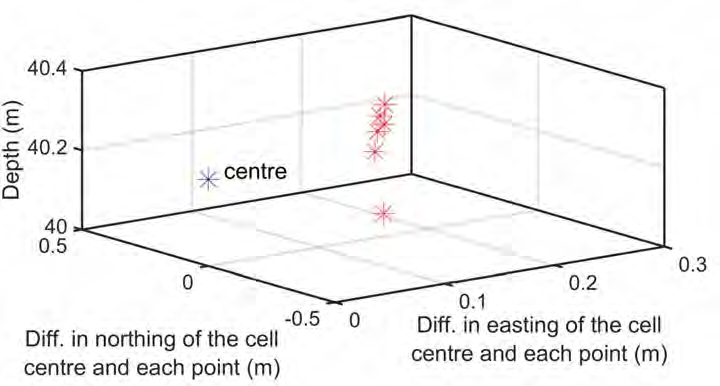
This results in coefficients which actually should only be used to determine the depth in close vicinity of the points and not the cell corners. A possible solution is to consider a threshold and discard the regression coefficients of the cells where the coefficients exceed the threshold. The feasibility of adopting this solution is currently being assessed.
5.3. Shallowest depth using (corrected) standard deviation
Figures 4 and 5 show the differences between the mathematical shallowest depth derived from the mean depth and uncorrected standard deviation (1-σ confidence level) and the actual shallowest depth measured for the cells in the areas A and B respectively. For nearly 6% of the cells, the former is shallower than the latter. The results also show a dependency along the sailing direction at the outer parts of the swaths which is not observed in the bathymetry map of either areas and is due to the larger depth uncertainties for the outer parts of the swaths. This results in a larger difference between the mean and shallowest depths.
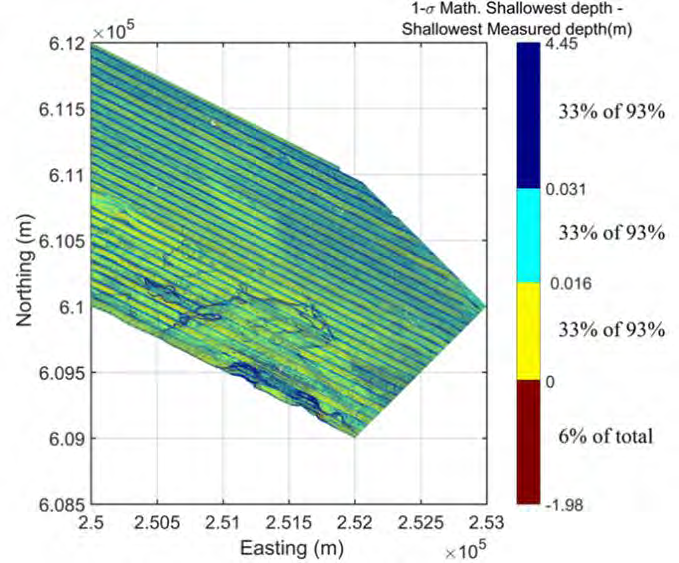
Figure 4. Map of the difference between the 1-σ mathematical shallowest and the actually measured shallowest depth in area A 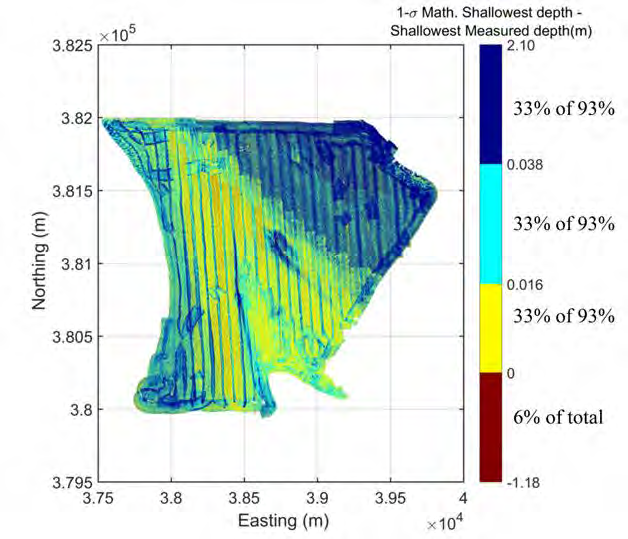
Figure 5. Map of the difference between the 1-σ mathematical shallowest and the actually measured shallowest depth in area B.
Note: For Figures 4, 5, 6 and 7, the positive range of values represented by each colour is selected such that each range represent equal percentages of data points for which the derived depths are deeper than the shallowest measured depths. The red colour presents those data points where the derived depths are shallower than the shallowest measured depths.
These depth uncertainties are caused by a variety of contributions, such as uncertainties in the MBES range measurements, uncertainties in the beam angle, the water column sound speed and position of the MBES and the attitude sensors on the ship. For illustration purposes, Figures 6 and 7 represent the differences between the mathematical shallowest depth derived from the mean depth and the corrected standard deviation (1-σ confidence level) and the actual shallowest depth measured for the cells in the areas A and B respectively.
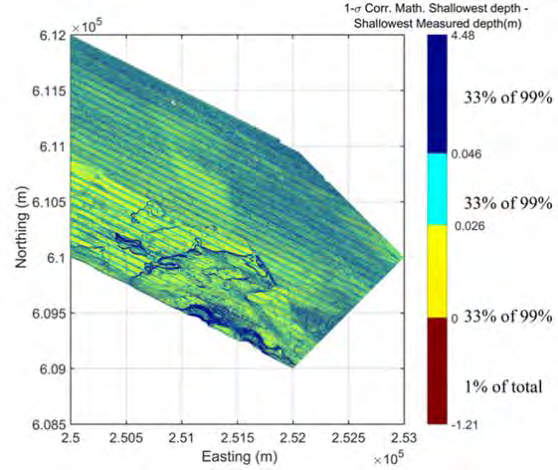
Figure 6. Map of the difference between the 1-σ corrected mathematical shallowest and the actually measured shallowest depth in area A. 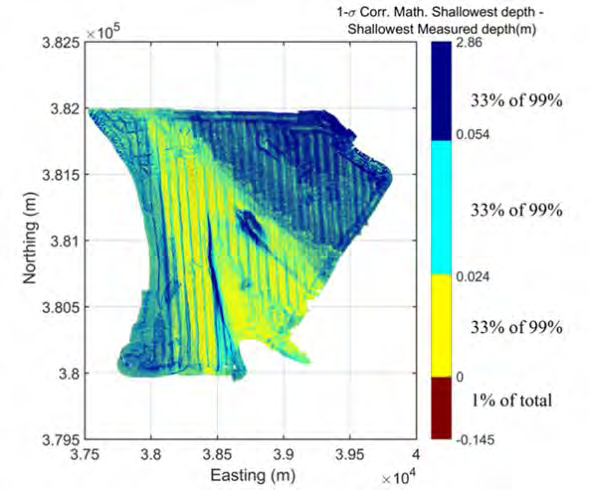
Figure 7. Map of the difference between the 1-σ corrected mathematical shallowest and the shallowest depth measured in the area B.
As expected, the percentage of cells in which the obtained depth is shallower than the actual shallowest measured depths is decreased to around 1%. This measure can be considered to capture both the mean and the uncertainties in the MBES measurements, but neglects any effect of the slopes. In this respect, it has a large risk in not capturing the actual shallowest depths. Still, the maximum increase in depth differs only slightly from that obtained by using the uncorrected standard deviation (Figures 4 and 5). A more mathematically sound approach is to use the shallowest depth at the corners, derived from the linear fit to the depth measurements within a cell, which is a topic for further investigation.
5.4. Seafloor profile based on introduced alternatives
Figures 8 and 9 depict the profiles of the seafloor along the black line (shallowest part in area A in Figure 1) and the green line (relatively flat area in area B in Figure 2) for the shallowest, mean, and the two depths based on the mean and (corrected and uncorrected) standard deviation. As the corrected standard deviation is always smaller than the uncorrected value, the mathematical shallowest depth derived using the former is closer to the mean depth compared to one obtained from the latter.
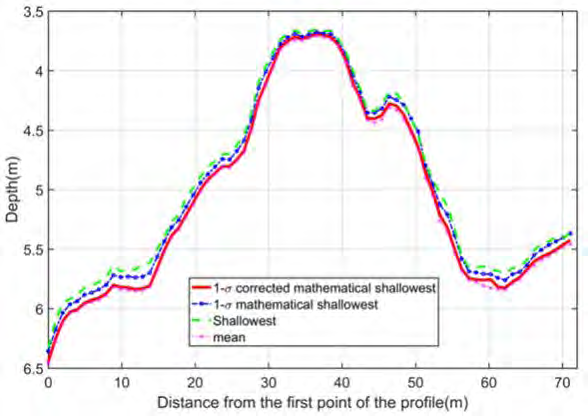
Figure 8. Profile of the black line shown in the bathymetry map of area A (Figure 1) using four different depths. 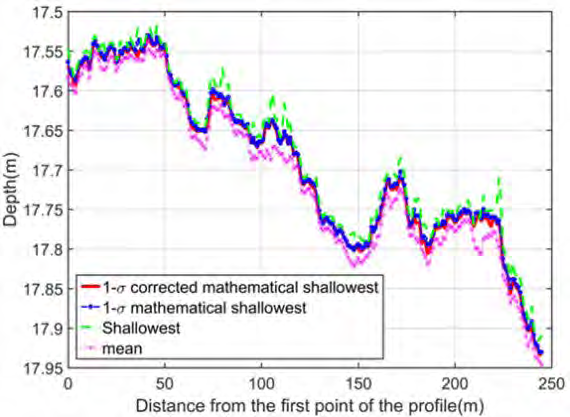
Figure 9. Profile of the green line shown in the bathymetry map of area B (Figure 2) using four different depths
6. Conclusions
There is a need for alternatives to determine the mean and shallowest depths in a grid cell as hazardous objects might be left undetected and the final grid depth value might be too shallow. Combination of the mean depth and standard deviation of the cell is considered a successful candidate. However from tests conducted, this method resulted in depths that are often (6%) shallower than the shallowest measured depth.
A further alternative solution could consider the combination of the mean and corrected standard deviation, which takes the effect of the possible slopes in a cell into account for the calculation of the standard deviation and does not require the calculation of regression coefficients. This results in less cells with depths that are shallower than the shallowest measured depths.
However, this combination is not recommended at this time and research on more realistic measures to account for the depth variation in a cell is still needed. Considering the features, it was found that neither of these representations prohibits the identification of the real bathymetric features.
7. Author Biographies
Tannaz Haji Mohammadloo is a Ph.D candidate at the Acoustics Group at the Faculty of Aerospace Engineering, Delft University of Technology (TU Delft), The Netherlands. She received her Bachelor and Master degrees in Survey Engineering and Geodesy from the University of Esfahan, Iran, in 2011 and 2013 respectively. Email : T.HajiMohmmadloo@tudelft.nl
Mirjam Snellen received her Master degree in Aerospace Engineering from TU Delft, in 1995 and her Ph.D degree in geoacoustic inversion from the University of Amsterdam, The Netherlands, in 2002. Currently, she is an Associate Professor at the Acoustics Group at the Faculty of Aerospace Engineering, TU Delft. Email: M.Snellen@tudelft.nl
Dick G. Simons received his Master degree in physics and his Ph.D degree from the University of Leiden, The Netherlands in 1983 and 1988, respectively. In 2006, he became Full Professor at the Faculty of Aerospace Engineering at TU Delft. He is Associate Editor of the IEEE Journal of Oceanic Engineering and a member of the scientific committee of European Conferences on Underwater Acoustics. Email: D.G.Simons@tudelft.nl
Ben Dierikx received his Bachelor degree in Hydrography from the Hogeschool Amsterdam, The Netherlands in 1993 and his Master degree in Geodesy from the TU Delft, The Netherlands, in 1997. He was the Senior Advisor on Hydrography. Currently he is a Technical Manager at Rijkswaterstaat. He is responsible for the specifications of Hydrographic tenders. Email: Ben.dierikx@rws.nl
Simon Bicknese studied at the Nautical College Noorder Haaks in Den Helder. He sailed for several years as a deck officer with the merchant navy. He joined the survey department from Rijkswaterstaat in 1984. He is now technical advisor for hydrographic issues. Email: Simon.bicknese@rws.nl