


Abstract
1. Introduction
Any means of transportation involves risk to human life, the environment and property; shipping is no exception. Catastrophic incidents involving ships are rare, but when they do occur the magnitude of the event is extreme. On assessment of long-term monitoring of particular species in response to the Exxon Valdez oil spill of 1989, Bodkin et al (2014) conclude their report by stating that effects of oil can persist for decades in some species. In 2012 the cruise liner Costa Concordia carrying 4252 passengers struck a rock on the sea floor and capsized resulting in 32 deaths. The BBC (2014) reports that the salvage operation took 2 years and cost 2 billion USD with the vessel eventually being scrapped. In both cases the root cause of the incident was attributed to human error. McCafferty and Baker (2006) explain how an investigation proceeds through considering causal factors that lead to the root cause. Such incidents can rarely be attributed to a single factor, it is typically a combination of a number of small factors combined that lead to such an incident, as in the case of the cruise ship L’Austral. Operating in the vicinity of Snares Island, south of New Zealand in 2017, during an excursion involving small launches, the weather deteriorated. In the process of launch recovery the vessel drifted into waters marked on the chart as an exclusion zone and struck an uncharted rock. In this instance, the weather conditions led to pre-occupation of the master with the recovery operation, who then failed to observe the vessel drift into an area of known hazards. It is not uncommon for mariners to navigate through poorly charted waters by local knowledge, but there is a chance that an unknown obstruction may lie beneath the sea surface in the vicinity. Causal factors relating to chart adequacy and environmental conditions are available from the geography of a region, there is then potential to undertake a risk assessment.
A number of approaches for assessing risk in the process of maritime navigation have been implemented at a national level (Ward and Gallagher, 2011; Chenier, Abado and Martin, 2018; and, Kiemola et al, 2009). Under the South-West Pacific Regional Hydrographic Programme, Land Information New Zealand (LINZ), the NZ Hydrographic Authority in conjunction with Marico Marine New Zealand Limited provided an approach that has been applied to territories in the South-West Pacific using a method presented by Riding and Rawson (2015) with a view to wider use. Also, the International Association of Aids to Marine Navigation and Lighthouse Authorities (IALA) have developed the IALA Waterway Risk Assessment Programme (IWRAP) as a software (Friis-Hansen, 2008), which is available at a cost and with training. IWRAP provides one component of the overall IALA risk assessment process. Both the LINZ and IALA approaches are intended to meet the International Maritime Organisation (IMO) Formal Safety Assessment (FSA) process to managing risk detailed by the IMO (2002). From this perspective, the LINZ and IALA approaches are assessed in the Gulf of Paria, an almost enclosed body of water between Trinidad and Venezuela where navigational risk has not been previously evaluated. Sheltered waters of the Gulf serve as the route to the primary ports of the industrial island of Trinidad in the Republic of Trinidad and Tobago. A significant petrochemical industry together with regular cargo, ferry services and cruise liners mean that maritime traffic in the sheltered waters of the Gulf is diverse and dense. There are no Vessel Traffic Services (VTS) or Traffic Separation Schemes (TSS), but pilotage is a requirement for larger vessels through the dredged channels into the major ports. Through application of the LINZ approach to risk assessment in navigation and use of IWRAP, research considers these techniques with respect to implementation, data requirements and results to demonstrate benefits and constraints of the assessment methods in decision support. Research was undertaken independently by staff from the University of the West Indies under the guidance of staff from LINZ and IALA, thereby providing a unique unbiased perspective that is corroborated by existing authorities on application of the processes employed.
2. Risk Assessment Strategies
In studying hazards within any discipline, the risk is determined from the multiplication of the probability of an event by the consequence, which is applied in the IMO FSA process. In maritime navigation, events such as collision, grounding and foundering might be attributed to circumstances such as weather, equipment failure, integrity of available data or human error. Probability of an occurrence is dependent on factors that will include traffic, confines of the waterway and state of the vessel. Consequences of an incident include environmental damage, loss of life, personal injury and salvage costs, which will vary with severity of the incident and geography of the location in which it occurred. Assessment of risk in maritime navigation is therefore a complex task with universal measures requiring simplification of parameters through generalisation. A number of approaches have been developed, one is to apply spatial analysis in a Geographic Information System (GIS) environment. Existing bathymetry together with vessel traffic information and vessel data has been used in the USA by Ward and Gallagher (2011) and in Canadian waters by Chenier, Abado and Martin (2018). In both cases the purpose of the analysis was to prioritise hydrographic surveys, to improve safety of navigation at sea. Kiemola et al (2009) and Baksh et al (2018) have applied event trees directly through Bayesian networks where probabilistic models are combined within a network to assess risk relating to navigation. Other statistical approaches for determining likelihood of collisions and groundings are based on theoretical probability values for an event, given different types of encounter. Original work conducted and tested by McDuff (1974) and Fujii, Yamanouchi and Mizuki (1974) has been enhanced and developed into the the IWRAP computer application with further validation being undertaken (Friis-Hansen, 2008). In a broader context, the IMO offers a generic approach to FSA through application of event trees that lead from identification of hazards and consequences as indices, which are combined, to give risk as a score. The full FSA process then considers risk control options and associated cost-benefits to support the decision-making process for risk reduction. Computer implementation for determination of likelihood of an event through algorithms is an effective means of integrating spatial data, but generalisation of the input information is inevitable. There is then a need in the consideration of risk control options for qualitative review of computed risk with respect to the operational and environmental factors employed within the computer model.
In the case of the LINZ and IALA methods, the principles of FSA have guided their developments. The LINZ method was initially applied to Vanuatu (Riding et al, 2013) and has since been widely implemented in small island territories of the Pacific as well as New Zealand territorial waters (Caie, 2016). As with other approaches in the hydrographic domain, the primary purpose of the assessment is to evaluate chart adequacy, and hence to identify priority areas for charting. However, through implementation within a GIS environment the strategy incorporates numerous other factors associated with hazards and consequences to offer a broader assessment of risk in maritime navigation. Data sets are compiled on a grid to consider traffic density, navigational constraints, environmental factors and economic cost of an incident, with a weighted overlay approach adopted for integration. The process involves consultation with operators working locally to define weighting factors of the various data layers relevant for the study area. By comparison, the IWRAP software focusses on traffic management and better considers traffic flow through the application of statistical distributions of traffic across shipping corridors to assess risk of collision. Integration with bathymetry then allows interaction of vessels with the sea floor to be incorporated into the analysis. To ease causation analysis, implementation within IWRAP considers risk of collision and grounding separately. IWRAP is available commercially with workshops on principles and applications delivered to support users and as such is in regular use internationally, examples of application include Huang C., Tan K.W., Shibata (2017), Kim, Park and Park (2011), and Dzikowski and Ślączka (2014), Thanh N.X., Park, Y. and Park, J. (2012), Thanh.X., Park, Y. and Park, J., Jeong, J. (2013), Otoi O.S., Park Y., Park J (2016). In considering traffic flow, the IWRAP software is intended to meet the quantitative components of the IMO FSA scheme to determine likelihood of an event. IALA have separated this from the qualitative assessment, which is delivered separately through their Ports and Waterway Safety Assessment (PAWSA) scheme (IALA, 2009). Results from IWRAP would contribute to the risk assessment undertaken within a PAWSA process.
Both the LINZ approach to risk assessment and the IWRAP software were developed for specific purposes. The approaches are designed to be fully portable geographically for assessment of risk to navigation in areas of dense traffic or in confined waters, such as approaches to ports. In the case of IWRAP this is achieved through interactive software, while the LINZ approach is fully documented as a method for implementation in GIS (Riding and Rawson, 2015). Due to their differing strategies and intents, the resulting risk may not be directly comparable. The purpose of the LINZ approach is to produce a heat map across the entire waterway, which can be used to prioritise resources. IWRAP focusses on the shipping routes within the waterway, to assist in the decision making process regarding provision of aids to navigation services. Research presented in this paper considers the techniques used in each of these methods and results obtained within the Gulf of Paria in terms of the value of information provided to authorities with responsibility for aspects of risk management in relation to the IMO FSA scheme.
3. The Gulf of Paria
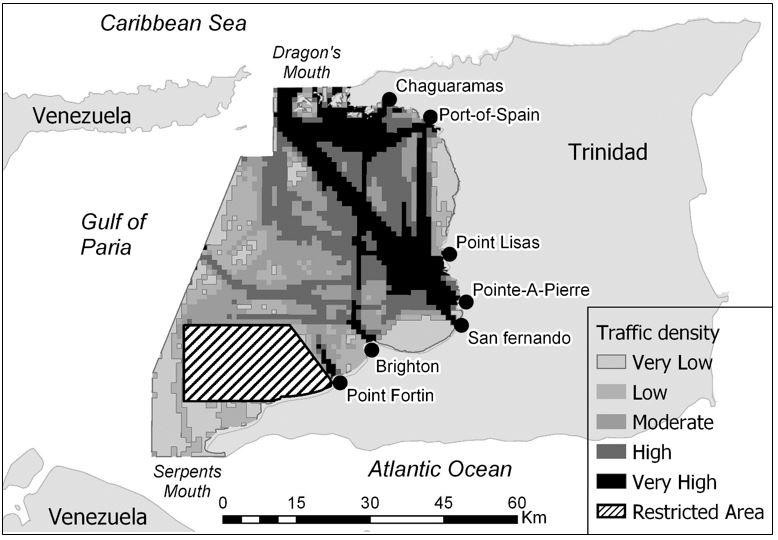
Sheltered waters of the Gulf of Paria have led to the development of port facilities shown in Figure 1 serving the industrial island of Trinidad. As an oil rich nation, the offshore petro-chemical industry dominates the national economy with private terminals servicing refineries and a liquid natural gas shipping plant in Point Fortin. The national refinery is located at Point-A-Pierre with the coastal area between there and Point Lisas hosting various refineries and a cement factory all with private shipping facilities. A commercial deep water port at Chaguaramas provides a ship yard with services for offshore equipment and installations. Primary national ports in Port of Spain and Port Lisas with navigable depth of 12.5 metres operate container terminals and other cargo while another small national port with a separate channel in Port of Spain serves coastal vessels. The port of Port of Spain also offers passenger services across the Gulf to San Fernando, to Tobago and for cruise liners of the Caribbean. Private facilities are located at Brighton for various industrial cargo. In addition to the major ports, numerous marinas and quays exist for fishing and leisure craft. The Gulf is not a popular sailing location, but offers a haven for yachts of the Caribbean during the hurricane season. Large fishing vessels are rare, the fishing fleet consists primarily of countless small pirogues. The volume of traffic within the Gulf of Paria and diversity of operational interests in the marine space suggests that there is potential for a catastrophic event involving environmental impact to coastal wetlands and loss of life.
Deepest waters in the Gulf are about 30 metres with entrances to ports being maintained by dredging. The sea floor consists of sediments discharged by the Orinoco River in Venezuela, and to a lesser extent from the land mass of Trinidad to give a seabed of gently sloping soft mud. Consistency of the sea floor is less hazardous to a grounding situation, but blockage of a dredged channel for a period of time would have economic impact. Some ports function as trans-shipment to nearby territories, which would also be impacted economically. There is some internal traffic within the Gulf with the ferry service operating between Port of Spain and San Fernando crossing industrial traffic accessing ports in Point Lisas and Point-A-Pierre. Islands in the Dragon’s Mouth to the north of the Gulf offer rocky shore lines. It is seen from Figure 1 that most shipping follows this passage and then adhere to paths known to be clear from obstruction. In the restricted area shown in Figure 1, obstructions exist in the form of derelict and operational offshore platforms with numerous surface and sub-surface installations. Further hazards to navigation exist in the shallower waters along the coast in the form of obstructions of various types that are mostly uncharted and unmarked. The number of hulks identified by Valdez (2014) is 51, but realistically it is thought that the actual number runs into hundreds and continues to be a significant safety issue.
In addition to providing most of the major port facilities that maintain the economy of Trinidad and Tobago, the Gulf of Paria also offers space for recreation and nature. Beaches near Chaguaramas provide a recreational area where the government has made significant investment in construction of a boardwalk and maintaining the shore line. Waters around the islands of the Dragon’s Mouth also offer recreational space and are home to unique black corals (Warner, 1981). Sites of national heritage and cultural interest existing on the shore include Waterloo Temple (Maharaj, 1996). The mangrove swamp at Caroni, immediately south of Port of Spain is protected under the Ramsar Convention (Jumar and Ramsewak, 2012), another substantial wetland exists near Brighton and mud flats along the shore line host wildlife. These areas of recreational, cultural and biological significance could be impacted significantly by the occurrence of an environmental disaster within the Gulf.
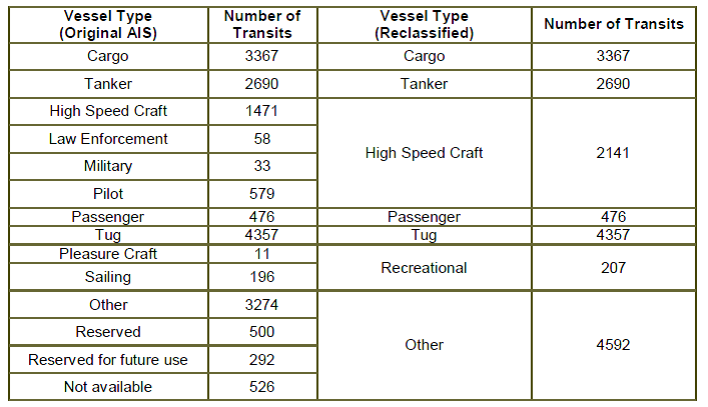
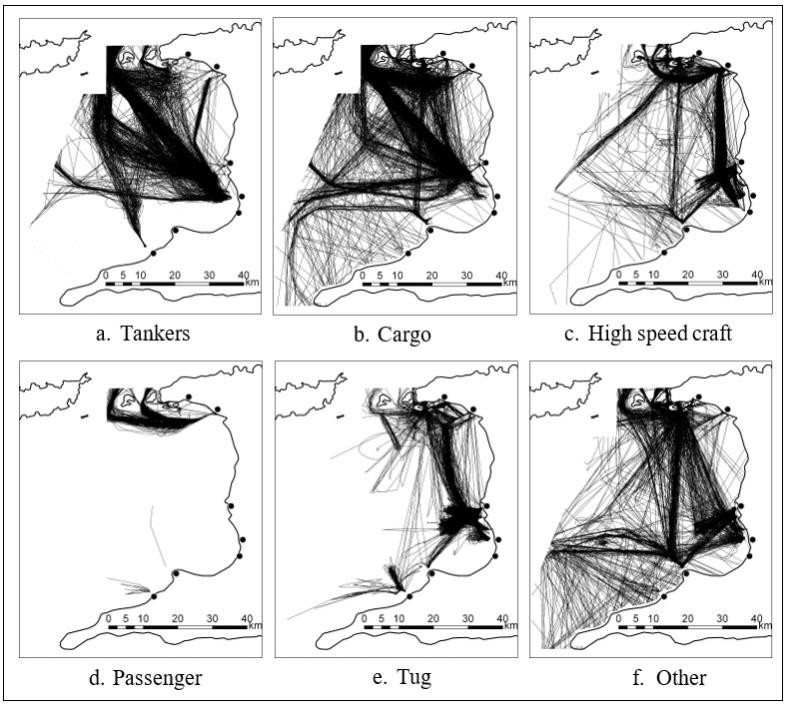
To assess shipping traffic within the Gulf a terrestrial Automatic Identification System (AIS) receiver was established at the University of the West Indies, 11 km inland from the Gulf of Paria, however at an elevation of 40 m it was found to cover at least the territorial waters of Trinidad and Tobago within the Gulf. Data collected for six months from July 2016 to December 2016 provided a database of 947 different vessels. AIS transmitters broadcast vessel status at regular intervals of a few seconds, another message giving vessel attributes is transmitted less frequently. Calder and Kurt (2009) explain how information provided by AIS is prone to human error with receivers requiring manual configuration for vessel attributes and status, a task that is often forgotten by watch keepers. Where possible, vessel attribute data were cross referenced using on-line data sources for vessels. Voyage data obtained from AIS includes vessel position, which is tagged with a unique vessel identifier. The overall track for each vessel constructed through time using the vessel identifier was broken into transits between points of departure and destination. The start and end transit was broken either by a change in status broadcast within the AIS message, or when the vessel position information indicated that it was stationary. Complete tracks for the 947 vessels produced 17,830 transits between points, the types of vessel and number of transits produced by each type is provided in Table 1. The types of vessel were reclassified from those adopted under AIS to combine some groups thereby further reducing the ambiguity in AIS data and discrepancies with vessel data obtained on-line. In spite of these efforts about 26% of the transits were made by vessels reporting their type inappropriately, most of which are likely to be small pleasure craft or work boats. Figures 2a through 2f show vessel tracks from commercial vessels of different types determined from terrestrial AIS data acquired.
4. Implementing the LINZ method in the Gulf of Paria
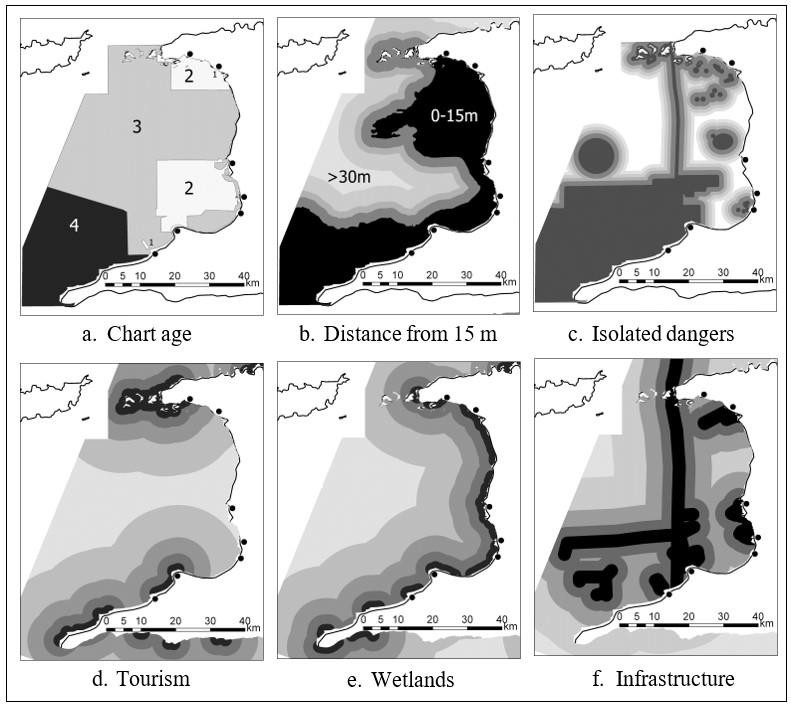
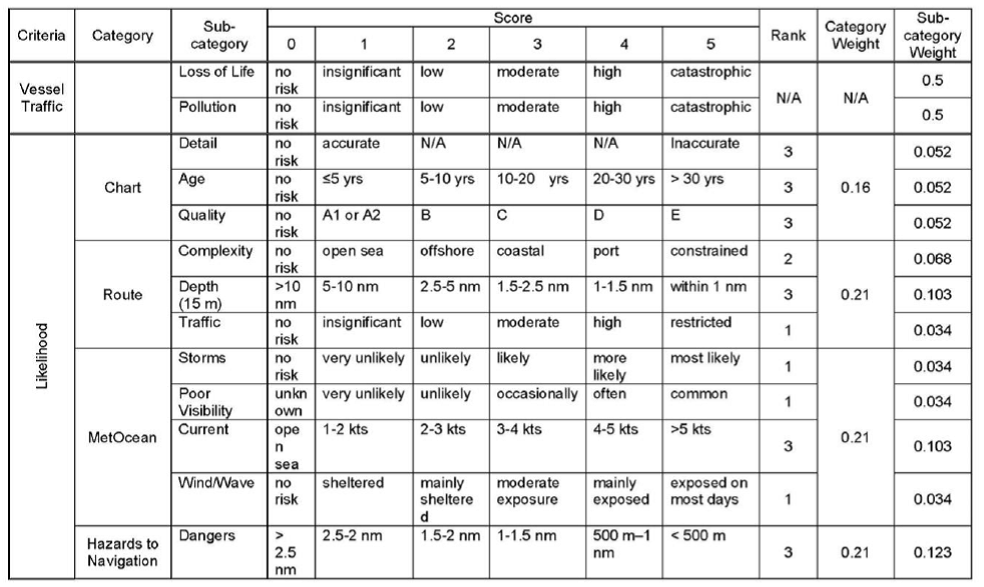
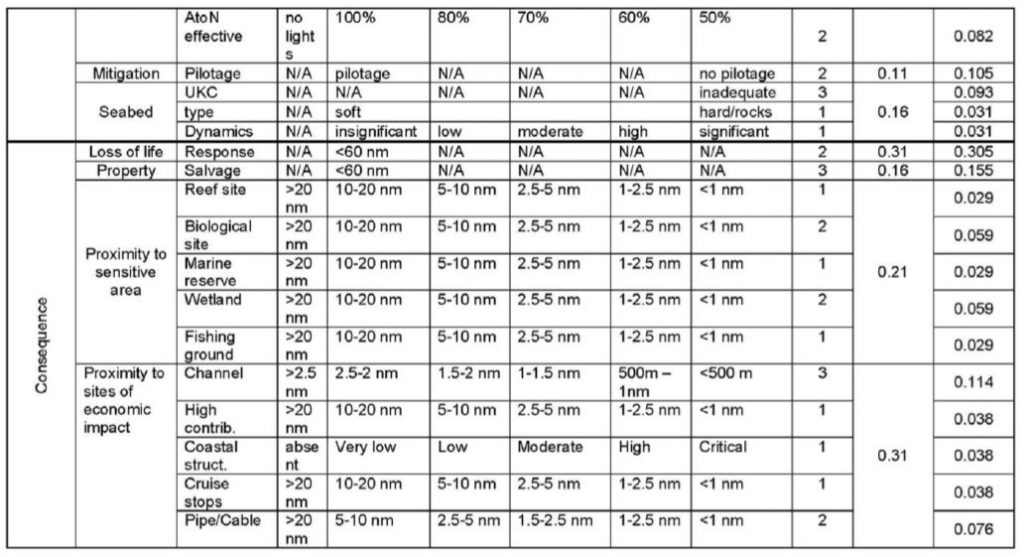
Within the LINZ method the likelihood of an incident at sea is determined by considering vessel traffic density and hazards that could lead to loss of life and/or pollution. These consequences are then represented spatially and multiplied by likelihood with weighting factors to determine risk. Variables relating to likelihood and consequence are listed by category in Table 2. Within Table 2, the traffic density is listed separately as this impacts on both likelihood and consequence. Gross tonnage of vessel traffic across the study site is placed into a grid of vessels transiting that cell, shown as traffic density for the Gulf of Paria on a 1.5 km by 1.5 km grid in Figure 1. Figure 3 shows some of the data sets developed for the region impacting on likelihood and consequence, which are then placed on a grid of the same resolution as the vessel data. Age of the chart shown in Figure 3a varies across the region with the oldest surveys (Area 4) being conducted in 1925 and 1936 while surveys in Area 3 date from 1963. In the 1980’s, surveys of the entrances to primary ports were carried out by a Hydrographic Unit (Holden, 1986) established for the purposes of conducting hydrographic surveys in Trinidad and Tobago waters. Charts covering Areas labelled 2 were produced locally and further survey data was also made available to charting authorities up until 1997. The most recent survey data incorporated in the charts was for the dredged channels into Port of Spain and Point Fortin undertaken by the US Navy in 2009. Channels are maintained at charted depth with compulsory pilotage for large vessels, otherwise there is little confidence particularly in shallow waters given visible uncharted obstructions and possible seabed dynamics, which is reflected in the risk level associated with chart quality. Bathymetry as depicted on the charts is extracted to determine navigational complexity with a grid containing levels for constrained navigation (along the shore line), port approaches (dredged channels) and three further levels defined by bathymetry. With channels in the Gulf dredged to 12.5 m, it is considered that the 15 m contour is significant because in deeper waters all vessels have freedom to manoeuvre. At some level in the region between the 15 m contour and the coastline, depth becomes a limiting factor on manoeuvrability of all vessels operating in the Gulf, therefore waters less than 15 m are shown in Figure 3b as greatest potential for a depth limited incident with buffers into deeper water indicating reduction. Hazards to navigation were obtained from the Energy Map of Trinidad and Tobago (NGC, 2017) and Admiralty Chart 483 produced by the United Kingdom Hydrographic Office (UKHO, 2005). The former offers the location of pipelines and other offshore installations while the latter shows the location of rocks, wrecks, oil platforms and navigational constraints. Vessels are at risk of collision due to the presence of isolated dangers across much of the study area as shown in Figure 3c.
Met-ocean conditions also impact on the ability to manage the navigation of a vessel. Trinidad and Tobago Meteorological Service (2011) indicates that the probability of the Gulf of Paria being affected by a tropical storm is very unlikely and the relative risk to maritime navigation caused by prevailing wind and wave conditions is very unlikely. The whole region is in the lee of the island of Trinidad are sheltered from trade winds, although visibility is reduced at times by rain. Currents are also small, the Environmental Management Authority of Trinidad and Tobago (EMA, 2011) show currents at a velocity of up to 2 knots within the Gulf of Paria with little variation given the microtidal range. Each variable representing an aspect of met-ocean conditions is considered uniform across the study site.
Consequence is evaluated through spatial assessment of known features and vessel characteristics that impact on life and damage to the environment and to property contributing to the gross domestic product. Damage to the economy would be incurred through damage to the infrastructure and pollution events. Features under these categories given in Table 2 are modelled within the GIS. Examples relating to environmentally sensitive areas are provided in Figures 3d, 3e for tourism and wetlands respectively with the implication that the closer an incident is to a feature the greater the consequence, hence buffer zones are applied. Pollution may also cause damage to fishing grounds, and as the whole of the Gulf is used for fishing a uniform measure was adopted. Areas with high economic contribution both regionally and nationally are also represented in the GIS as layers. Coastal infrastructure shown in Figure 3f includes offshore installations, fish landing sites and ports with data being digitised from the Energy Map of Trinidad and Tobago (NGC, 2017) and local mapping. Mitigation against economic cost of loss of life or property at sea is dependent on ease of search and rescue and salvage. Difficulty in search and rescue was obtained from the Trinidad and Tobago Coast Guard with cost of salvage of a vessel determined from representative cases internationally.
Spatial data for known dangers to navigation and safety measures such as navigational aids are available from the various data sources identified above, but effectiveness of the aids to navigation and chart quality (particularly in view of density of uncharted obstructions) are difficult to quantify from data. The risk assessment process requires consultation with professionals working in the study area either as mariners or in a support capacity, such as pilots and others working in maritime services. For the study of the Gulf of Paria such data was obtained by conducting a poll of professional opinion through a questionnaire. Likelihood and consequence criteria given in Table 2 were provided with options to rank in the scale 0 to 5 in accordance with the scores listed in Table 2. The questionnaire also asked local experts to express their opinion on weights for each category, and to rank the sub-category on a scale of 1 to 3 as low to high respectively. On this basis the sub-category weights are determined for the different layers within the data set as shown in Table 2.
Risk is defined as likelihood of an event multiplied by consequence (IMO, 2002). In the LINZ model documented by Riding et al (2013), the likelihood of an event (L) is scaled by the traffic density (T) and the consequence (C) by a factor (F) that transforms consequence to real world units of loss of life and quantity of pollution:
Risk to Maritime Navigation = Traffic (T) * Likelihood (L) * Consequence (C)*Factor (F)
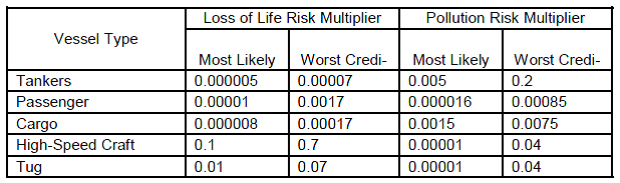
Consequences are two-fold with loss of life and pollution being the concerns. An incident involving a passenger vessel has a greater potential for loss of life while an event involving a tanker would lead to greater pollution. Riding et al (2013) explain how event trees were used to consider scenarios leading to pollution and loss of life events. Using average vessel capacities for different types of ship, multipliers were determined to convert incidents to tonnage of pollution spilled and number of lives lost under most likely and worst credible situations, values are provided in Table 3. An average value is then used as the multiplier for gross tonnage of vessels of different types, which offers a further complication as vessel tonnage is not incorporated into the AIS data structure and has to be sourced from on-line database sources. The potential for each of the two types of outcome from an incident is then computed from:
Factor = Gross Tonnage * ( Most Likely Multiplier + Worst Credible Multiplier) / 2
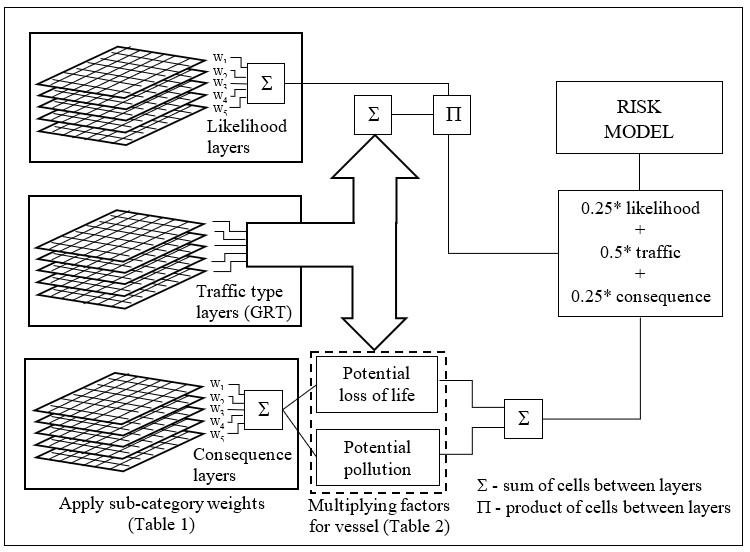
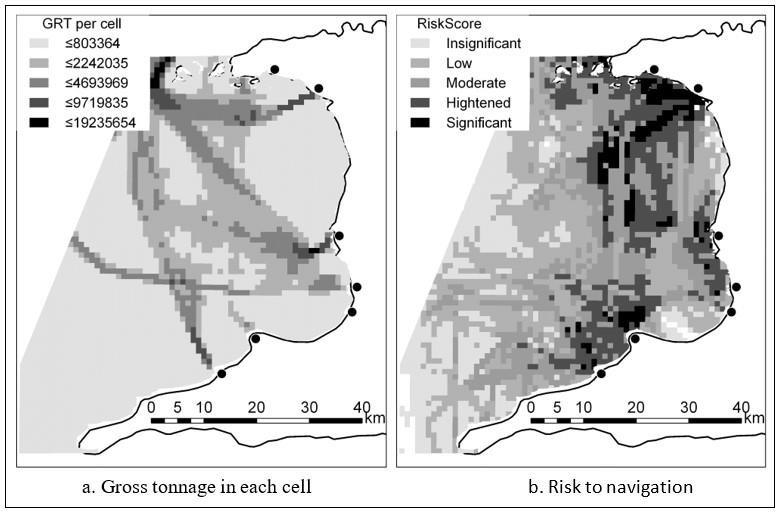
The risk assessment process is implemented as shown in Figure 4, using overlays of the various spatial data with weightings and factors applied to derive a risk map across the grid of the study area. Layers of gridded geospatial data initially are weighted according to the sub-category, this is done separately for likelihood and consequence criteria. Traffic is treated separately with gross tonnage passing through each cell being obtained for each vessel type as necessary for calculation of weighted consequences and likelihood. Finally, the product of scaled likelihood and factored consequence is formed to provide the risk model. The result for the Gulf of Paria is provided in Figure 5b in comparison with total gross tonnage provided in Figure 5a, both are classified into five categories using the quantile distribution method. Risk is a relative measure and this process classified the risk into five categories as recommended under the IMO FSA process. Figure 5 illustrates that high risk areas do not relate only to gross tonnage of vessel traffic, but integrates hazards and consequences. For example, while traffic is dense in the entrances to the ports the associated regions of heightened and significant risk exist in a wider area around the channels. In the Serpent’s Mouth where there is a large volume of vessel traffic there is low to moderate risk and the reverse situation exists in regions in the middle of Trinidadian waters of the Gulf of Paria.
5. Applying the IALA IWRAP software to the Gulf of Paria
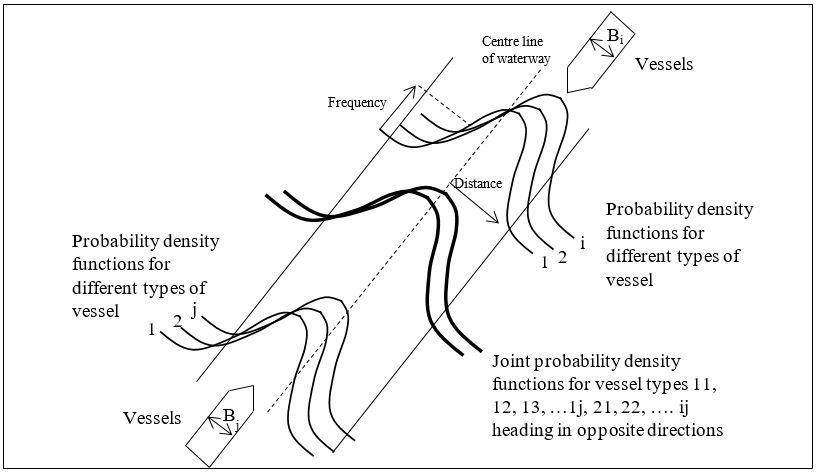
IWRAP provides a rigorous statistical approach to probability of collisions and groundings. Distributions for vessel traffic along regularly used shipping routes are best extracted from AIS data, although they can be entered manually and this is necessary to introduce vessel traffic that does not carry AIS. Probability density functions are taken to be normal with mean and standard deviation computed from AIS traffic data. IALA (2019) documentation on IWRAP considers different types of encounter. Referring to Figure 6, the probability of a head on encounter for a pair of vessels drawn from two distributions is determined from equation (1) by intersection of the two normal distributions with parameters μi and σi for vessel type i travelling in one direction and μj and σj for vessel type j in the other. Vessel size must also be considered in assessing collision scenarios and average breadth is computed from the sample of vessels used to compute distribution parameters with data being provided within an AIS sentence. In equation (1), μij is the distance between the means (μi+μj) for vessels of two types, σij is the standard deviation for the joint probability distribution  , where Bij is the average vessel breadth
  and N indicates the normal distribution function. A collision can occur anywhere along the waterway, so the time each vessel spends transiting the channel must be considered. The number of encounters expected between vessels of type i and j (denoted Eij in equation 2) depends on the length of the section of waterway being represented by these distributions (L-), speed of the different types of vessel (Vi and Vj) and number of passages of vessels of each type per unit time (Q1 and Q2) according to equation (2). This is summed over i and j for the different vessel types. The frequency of collisions between vessels per unit of time is then given by λ in equation (3). As the collision is a rare event due to the ability to perform an avoidance manoeuvre, the probability of a collision over some time interval ∆t is estimated with an exponential by using a Poisson distribution as P in equation (4).

(1)

(2)

(3)

(4)
For an overtaking encounter the same principles are applied with sign changes to accommodate similarity in direction of travel. Crossing and merging encounters require extension of the above to allow for angle of incidence between routes. Collisions with vessels on regularly used routes with those making irregular crossings are included by considering passages along cardinal and ordinal compass directions. The statistical distribution of irregular traffic is represented as uniform along the length of the route.
With the frequency distributions defined, probability density functions are computed from the theoretical foundation for different encounter types with causation factors. Thus, a spatial representation is available to provide probability values for the occurrence of a collision with factors being introduced to accommodate the human response to an impending incident. This is further enhanced through assessment of proximity of encounters based on AIS positions. Use of bathymetry derived from charted contours within the software further allows the computation to be performed with respect to grounding. Through user interaction the software allows impact of mechanical failure to be assessed, again this is achieved in statistical terms. The user enters the probability of such an event together with the distribution for repair time. The drift speed and direction under such an event is also set. Through simulation the possibility of mechanical or human failure is introduced.
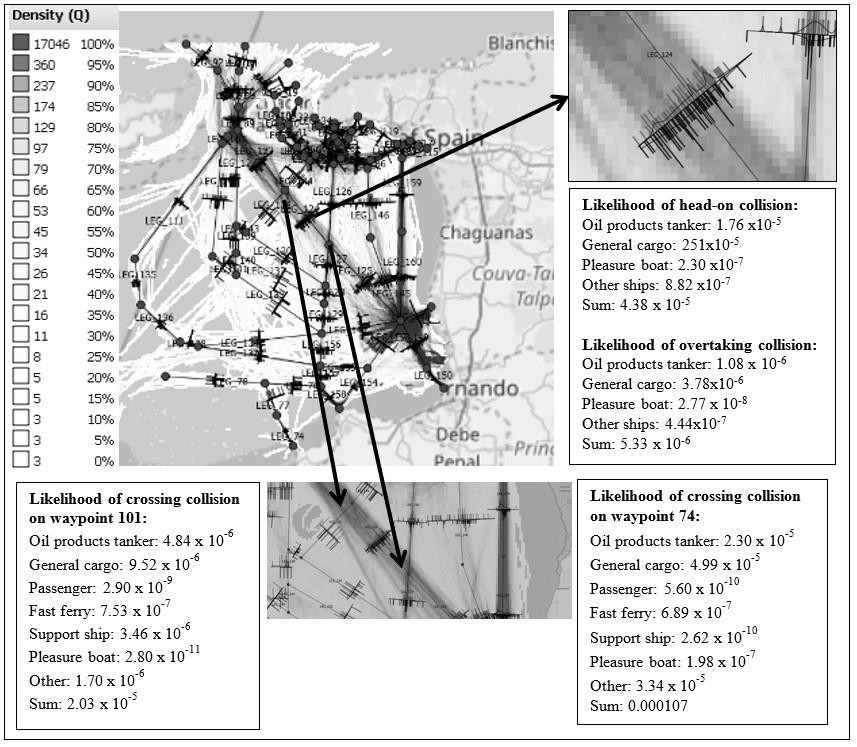
The IWRAP software initially provides a traffic density chart shown in Figure 7 where the legend indicates total number of vessels transiting a cell. Cell size is user selectable, the default value of 250 m was applied to produce Figure 7. Traffic routes are identified within the density plot by joining waypoints selected manually at strategic locations along tracks of dense shipping traffic. The software produces a histogram of vessels transiting that route as extracted in Figure 7 with bars on opposite sides of the section indicating direction of travel. Likelihood of collision of different types is then assessed according to vessel type as indicated in the three examples extracted within Figure 7.
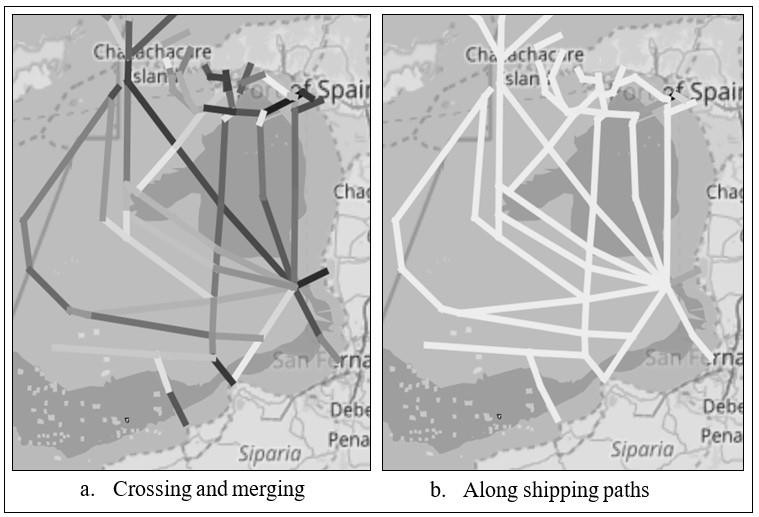
Compliance with the IMO FSA process is achieved by mapping likelihood determined from traffic analysis onto a five point scale. Results for the tracks defined in the Gulf of Paria are separated into encounters where tracks intersect (Figure 8a) and along tracks (Figure 8b). Relatively there is much less likelihood of a head on or overtaking collision along tracks than of a crossing or merging collision at an intersection of tracks. Probability of a collision is greatest at waypoints close to the ports and in the confined waters of passages between the islands to the North of the Gulf of Paria.
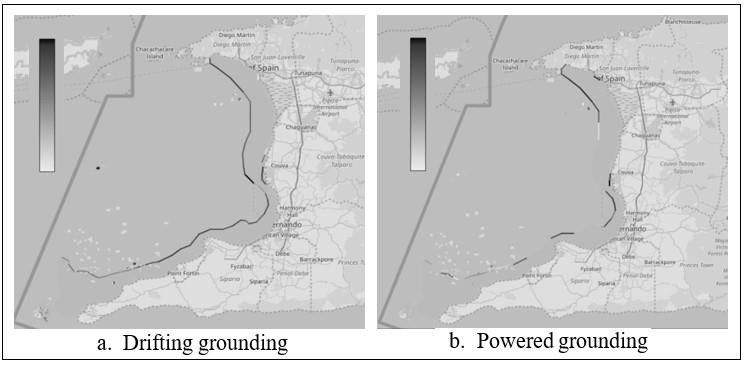
Risk of grounding by drifting or under power is assessed by considering vessel draught and bathymetry. In the case of drifting, the user interface of IWRAP enables entry of drift direction and speed. In Figure 9a the likelihood of grounding due to drifting is seen to largely follow a contour line of the bathymetry. For a powered grounding the vessels paths are extended towards the coastline with Figure 9b showing greater probability of such an event occurring in areas of high traffic density and along the coastline in areas where channels extend into the ports.
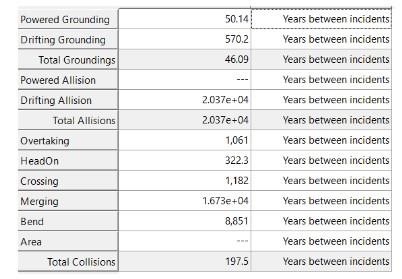
A final summary of likelihood from different types of encounter between vessels and the sea floor is provided in Table 4. Consequences of an incident are not considered within the software. However, with a probability chart and local knowledge of features such as coastline type and areas of economic or environmental significance as well as streams and currents, the consequences for different types of vessel can be considered externally to the software and the risk assessed. Results from the IWRAP assessment are considered with other safety measures within the IALA Port and Waterways Safety Assessment (PAWSA) scheme to provide a full risk assessment.
6. Discussion
It is evident that there is a lack of integrity in the source data acquired by the AIS, due primarily to failure of the operator to configure the transmitter correctly. It was necessary to obtain further particulars for vessels from on-line data sources including the IMO Global Integrated Shipping Information System (GISIS, 2019), MarineTraffic (2019) and Vesselfinder (2019). Through this process it was established that none of the databases are complete and nor are they available for full download. Furthermore, availability of data for a particular vessel is dependent on searching by the MMSI or IMO vessel number, which is occasionally erroneously entered into the shipborne transmitter with values such as 0 or a compliment of 1’s or 9’s being common. Transmitters are apparently reset on occasion, perhaps through power down with loss of signal and restart at some arbitrary position. Efforts to parse the data and construct transits for each vessel from continuous data streams for position were undertaken, initially through scripting of an automated procedure, which then required manual refinement. It is considered that the larger international vessels provide better data and the problems are more prevalent in the local traffic. Statistically, the data available is representative of the vessel traffic in the region with some outliers due to erroneous AIS information having little impact on the overall assessment.
As satellite AIS data is dependent on satellite availability and increased possibility of conflict of data broadcast simultaneously by transmitters on multiple vessels as indicated by Carson- Jackson (2012), reliability is reduced in comparison with data acquired by a terrestrial receiver. Vessel tracks derived from satellite AIS data can have long segments between points, and the vessel may not have progressed along the straight line used to connect these points. In rigorous statistical assessment of vessel density along specified tracks, the IWRAP method for determining likelihood is best applied to terrestrial AIS data. In considering vessels transiting a cell of 1.5 km square, the LINZ approach is less susceptible to deviations from the true path introduced by linear interpolation between points when no data is acquired. However, this approach does not allow relative direction of vessels to be considered during encounters and the need for different equations for encounter types implemented in IWRAP suggests that this factor is significant in assessing likelihood of collision. Terrestrial AIS data was used for the risk assessment in the Gulf of Paria for both IALA and LINZ strategies.
The LINZ approach requires an extensive data acquisition and digitisation process with data being obtained from multiple sources across different disciplines. Weighting of the various risks and consequences under expert guidance proved a challenge. Many of the authorities with responsibility for managing the marine space from the government perspective offered politically correct responses to the questionnaire, with more pessimistic assessment being made by professionals operating in the study area. Some interesting insights were also gathered. During an interview, a retired Fleet Chief Petty Officer of the Trinidad and Tobago Coast Guard explained that, the lights on oil rigs are insufficient to prevent collision and Miller (2015) offers an example of a platform that exists outside of the restricted area shown on the Chart as lit, but is a derelict structure with tops of legs 6 m below the waterline. It is not appropriate to incorporate such anecdotal evidence and assumptions within a formal research agenda and the final likelihood criteria and weightings were implemented from responses to questionnaires with need for some interpretation using accompanying comments where diverse views were presented.
Units of risk associated with the final results provided by the LINZ model are relative. Likelihood for each grid cell is a value between 0 and 1 based on subjective criteria and does not formally consider the probability of a vessel being involved in an incident in a statistical sense. This value is multiplied by the gross tonnage of vessels passing through a cell. Consequence criteria given in Table 2 is variable in relation to proximity to sensitive areas without consideration for currents that carry pollutants or a vessel in distress. A historical measure of impact in terms of pollution and loss of life for different vessel types by gross tonnage is further used to determine values in Table 3 that relate vessel type to consequence. Without units being associated with these measures it is difficult to assess the results in an absolute sense, but relative risk is defined across the entire study area. Documentation for the LINZ method suggests that five categories be adopted based on findings with the upper quartile being used to define areas of highest risk. This approach enables classification of risk across the study area that identifies regions warranting further investigation towards implementation of mitigation measures. However, the results do not directly identify spatial attributes that lead to a high level of risk.
With appropriate training on the IWRAP software the IALA approach is simple to implement; IWRAP reads AIS data directly in raw form and accepts digital entry of bathymetry together with charted hazards. From initial graphical assessment of traffic, interaction through the user interface defines waterways and further analysis focusses on these areas. Likelihood is determined formally in terms of probability using statistical models and proximity of encounters adds information for interpretation. Simulations may then offer an assessment of risk reduction measures such as alternative vessel routing or separation. This offers a quantitative analysis for likelihood of an event that enables the frequency index defined by the IMO under the FSA approach to be determined on a five point scale. IWRAP does not consider the consequence, which is addressed in a second stage of an assessment under the PAWSA process. This would be administered by a questionnaire and site visit by third party experts to qualitatively consider consequence and hence determine a severity index that would combine with likelihood to give an overall risk assessment matrix. The PAWSA process will also be used to identify suitable mitigation strategies that would lead to risk reduction. Full documentation for a PAWSA process is provided by the United States Coast Guard (2019).
In the last sixteen years, there have been no incidents in the Gulf of Paria that have resulted in formal reports. Reports of oil spills in the social media are common (Clyne (2019) and Rodriguez (2020)) with containment measures being undertaken. Occasionally there is a small amount of pollution on beaches, but with the Guiana current flowing northward through the Gulf any uncontained spillage is carried out into the Caribbean Sea. Similarly, environmental incidents involving vessel traffic have never been of such significance as to involve formal reporting. A report by Hamilton-Davis (2017) in the local media documents the sinking of party boat “First Lady” that struck an unknown submerged object, fortunately there were only three crew on board and all survived. The problem of hulks and debris in the waters of the Gulf of Paria is well known with the matter being addressed in the Parliament of the Republic of Trinidad and Tobago (2014, pages 21/2). In 2009 and 2012, contracts were awarded to remove a total of 41 wrecks from the northern part of the Gulf of Paria at no cost to the government. This would have targeted hulks that were more easily salvageable for scrap value. A plan was called for with a view to removal of at least 100 additional wrecks (excluding small pirogues and fishing vessels) lying abandoned in Trinidad and Tobago waters at that time. Under the Public Sector Investment Programme (2018) of the Government of the Republic of Trinidad and Tobago, it is noted that for improvement to safety of navigation, 5 million TTD had been spent on removal of wrecks in 2017 and a further 6 million allocated for 2018. However, reports in the local media by Neaves (2018) and Singh (2018) identify the ongoing difficulty of abandonment of vessels in the Gulf and the associated dangers to navigation and the environment. As wrecks are located outside of regular traffic routes, this hazard is not covered by the IWRAP assessment. Within the broader scope of the IALA risk assessment programme, the problem may be identified under PAWSA as a concern for safety, but without undertaking surveys the scale of the problem is not known. Under the LINZ approach the risk in the area where the only known incident involving the sinking of “first Lady” occurred is classified as ‘moderate’ and may not be considered as high priority for charting.
7. Conclusions
In accumulating vast amounts of data and expert opinion for risk assessment the LINZ method is combining quantitative and qualitative information into a documented process to identify risk through application of GIS. The whole of a waterway is considered with multiple factors being introduced and integrated to determine a relative level of risk across the study area by considering likelihood and consequence. The IALA process distinguishes between likelihood and safety through IWRAP and PAWSA. IWRAP provides a rigorous statistical approach in the analysis of traffic on defined routes to present likelihood in those areas with PAWSA requiring expert opinion for further assessment of the results and review of the wider region. In compiling data for the LINZ model, much of the information that would be incorporated into the PAWSA programme is acquired. In the assessment of factors that contribute to risk, both processes rely heavily on opinion of experts. Professionals working in the region of interest are required to share their local knowledge with external parties with experience in risk assessment. In seeking local information specific to this study of the Gulf of Paria a diverse range of opinions were presented on existing hazards and their contribution to likelihood.
Using terrestrial or satellite AIS data for vessel tracks and other geographical information across the entirety of a waterway the LINZ approach is seen to reflect relative risk. One reported incident with an uncharted hazard causing a small vessel to sink was located in an area where risk is classified as moderate. While uncharted hazards are numerous in the Gulf of Paria, they are mostly located in shallow waters where consequences of loss of life and pollution are small. IWRAP has quantified likelihood of collisions and groundings within the regularly used passages within the Gulf of Paria. While there are no incidents for comparison, the rigour of the statistical strategy adopted based on a representative sample of traffic and bathymetry gives confidence in the results.
The strategies implemented through LINZ and IWRAP meet the objectives of the different purposes for which they are designed. IWRAP informs on likelihood of an incident in regularly used paths across a waterway, and hence identifies locations where aids to navigation would offer mitigation and risk reduction. LINZ considers a broader regional perspective. In the case of the Gulf of Paria, regions known to have a large number of uncharted hazards to navigation including the North between Port of Spain and Chaguaramas and East between Point Lisas and San Fernando are shown as moderate to high risk areas. Without specifically identifying hazards in these areas within the input data the process has identified significant risk. The requirement for charting is not so much the need for bathymetry, but rather for identification of hazards. There is no formal mechanism in either of the IWRAP or LINZ methods to identify the primary causation factors contributing to areas of significant risk. Ideally a risk assessment would incorporate both approaches to inform on risk followed up with a PAWSA process to consider findings and develop strategies for mitigation.
With the availability of terrestrial AIS data the IWRAP software offers an immediate visual representation of traffic and through the user interface the likelihood of collisions and groundings in the high traffic areas can be quantified. However, the LINZ approach has demonstrated that for the Gulf of Paria these are not necessarily the areas of most significant risk. IALA would identify such areas through the PAWSA scheme as an assessment report that has been incorporated within the LINZ risk assessment method. The complex procedure with multiple spatial variables is time consuming to implement in a GIS, worsened in cases such as Trinidad where there is a scarcity of readily available digital data. There would be significant benefits in integrating these approaches to offer a staged process to risk assessment. Initially, the use of IWRAP as an initial inspection tool, then to undertake a qualitative assessment report through expert consultation that identifies hazards, consequences and potential mitigation methods. This offers data for implementation of the LINZ method that is able to assimilate the multiple spatially varying data sets and finally to test mitigation strategies using IWRAP and LINZ approaches.
8. References
Baksh, A., R. Abbassi, V. Garaniya and F. Khan. (2018). “Marine Transportation Risk Assessment using Bayesian Network: Application to Arctic Waters”, Ocean Engineering, 159, pp. 422-436.
BBC News (2014). Salvaging the Costa Concordia, viewed 15 January, 2020, https://www.bbc.com/news/world-europe-19962191.
Bodkin, J. L., Esler, D., Rice, S.D., Matkin, C.O., Ballachey, B.E. (2014). “The effects of spilled oil on coastal ecosystems: lessons from the Exxon Valdez spill”, Coastal Conservation, Cambridge University Press, NY, pp. 311-346.
Caie, S. (2016). LINZ New Zealand Hydrography Risk Assessment. FIG Working Week 2016. Recovery from Disaster. Christchurch, New Zealand.
Calder, B.R. and S. Kurt. (2009). “Traffic Analysis for the Assessment of Risk Assessment Methods. US Hydrographic Conference”, The Hydrographic Society of America, 22 pp.
Carson-Jackson, J. (2012). “Satellite AIS – Developing Technology or Existing Capability?”, The Journal of Navigation, 65, pp. 303-321.
Chenier, R., L. Abado and H. Martin. (2018). “CHS Priority Planning Tool (CPPT)—A GIS Model for Defining Hydrographic Survey and Charting Priorities”, International Journal of Geoinformation, 7 (240), pp. 1:14.
Dzikowski, R. and Ślączka, W. (2014). “Analysis of IWRAP MK2 Application for Oil and Gas Operations in the Area of the Baltic Sea in view of fishing vessel traffic”, Scientific Journals Maritime University of Szczecin, 40 (112), pp. 58-66.
EMA. (2011). Environmental Management Authority Guidebook for Hydrodynamic Considerations in Coastal and Marine CEC Applications. Environmental Management Authority of Trinidad and Tobago. Port of Spain Trinidad and Tobago.
Bodkin, J.L., Esler, D.N., Rice, S.D., Matkin, C.O., Ballachey, B. E., Maslo B. and Lockwood, J.L. (2014), The Effects of Spilled Oil on Coastal Ecosystems: Lessons from the Exxon Valdez Spill, 1st ed., Coastal Conservation, Cambridge University Press.
Friis-Hansen, P. (2008). IWRAP MKII Working Document Basic Modelling Principles for Prediction of Collision and Grounding Frequencies. Rev 4. Technical University of Denmark. Lyngby, Denmark.
Clyne, K. S. (2019). EMA Checks Gulf of Paria Health after Oil Spill, Trinidad and Tobago News-day, viewed 15 January 2020, https://newsday.co.tt/2019/03/28/ema-checks-gulf-of-paria-health-after-oil-spills/.
Fujii, Y., H. Yamanouchi and Mizuki, N. (1974). “Some Factors Affecting the Frequency of Accidents in Marine Traffic. II: The probability of Stranding, III: The Effect of Darkness on the Probability of Stranding.” Journal of Navigation, 27, pp. 235-252.
GISIS (2019). Global Integrated Shipping Information System, International Maritime Organisation, viewed 15 January 2020, https://gisis.imo.rg/Public/Default.aspx.
Hamilton-Davis, R. (2017). Part Boat First Lady Sinks, Trinidad and Tobago Newsday, viewed 15 January 2020, https://newsday.co.tt/2017/10/31/party-boat-first-lady-sinks/.
Holden, G. (1986). “Establishing a National Hydrographic Service with United Nations Technical Co-operation”, International Hydrographic Review, International Hydrographic Organisation, Monaco, LXIII (1), pp. 7-19.
Huang, C., Tan, K.W. and Shibata. (2017). “Application of IWRAP MK Ⅱ Software in Risk Assessment of Ship Collision and Stranding in Yangtze Estuary Waters”, China Navigation, 1, pp. 79-82.
IALA (2009). IALA Recommendation O-134 on the IALA Risk Management Tool for Ports and Restricted Waterways. Edition 2. International Association of Marine Aids to Navigation and Light- house Authorities. Saint Germain en Laye, France.
IALA (2019). Predicting Collision Frequencies, International Association of Marine Aids to Navigation and Lighthouse Authorities, viewed 15 January 2020, https://www.iala-aism.org/wiki/iwrap/index.php/Predicting_Collision_Frequencies.
IMO (2002). Guidelines for Formal Safety Assessment (FSA) for use in the IMO Rule-Making Process. MSC/Circ. 1023, MEPC/Circ. 392. International Maritime Organisation. London, United Kingdom.
Juman, R. and Ramsewak, D. (2012). “Land Cover Changes in the Caroni Swamp Ramsar Site, Trinidad (1942 and 2007): Implications for management”, Journal of Coastal Conservation, 17(1), pp. 133-141.
Kiemola, A., Kuronen J., Kalli J., Arola T., Hanninen M., Lehikoinen A., Kuikka S., Kajula P., and Tapaninen U., (2009). “A Cross-Disciplinary Approach to Minimising the Risks of Maritime Transport in the Gulf of Finland”, World Review of Intermodal Transportation Research, 2(4), pp. 343-363.
Kim, D.W., Park J.S. and Park Y.S. (2011). “Comparison Analysis between the IWRAP and the ES Model in Ulsan Waterway”, Journal of Navigation and Port Research International Edition, 35 (4), pp. 281-287.
Macduff, T. (1974). “The Probability of Vessel Collisions,” Ocean Industry, 9(9), pp. 144-148. Maharaj, N. (1996). Trinidad’s Temple in the Sea. Caribbean Beat. Port of Spain, Trinidad. MarineTraffic. (2019). Global Ship Tracking Intelligence, Marine Traffic, viewed 15 January 2020, https://www.marinetraffic.com accessed November 2019.
McCafferty, D. B. and Baker C. C. (2006). Trending the Causes of Marine. ABS Technical Papers Learning from Marine Incidents III Conference reprinted by the Royal Institution of Naval Architects. London, United Kingdom.
Miller, K. (2015). “Need for Professional Hydrography in the Caribbean Towards Risk Reduction in Maritime Navigation”, The West Indian Journal of Engineering, 38(1), pp.70-78.
NGC. (2017). Energy Map of Trinidad and Tobago. National Gas Company of Trinidad and Toago Limited, viewed 20 December 2018, https://ngc.co.tt/wp-content/uploads/pdf/publications/Energy-Map-of-Trinidad-Tobago-2017.pdf
Neaves, J. (2018). Papa Bois: Abandoned Vessels ‘ticking time bombs’, Trinidad and Tobago Newsday, viewed 20 November 2019, https://newsday.co.tt/2018/06/21/papa-bois-abandoned-vessels-ticking-time-bombs/
Otoi, O.S., Park, Y., Park, J. (2016). “A Basic Study on Marine Traffic Assessment in Mombasa Approach Channel-I”, Journal of Navigation and Port Research, 40(5), pp. 257-263.
Parliament of the Republic of Trinidad and Tobago. (2014). Nineteenth Report of the Joint Select Committee Appointed to Enquire into Ministries. Parl No 14/6/13. 166p. Statutory Authorities and State Enterprises Group 2. Port of Spain, Trinidad.
Riding, J., Webb I., Rawson, A. and Harkesh. G. (2013). Pacific Regional Hydrography Programme – Hydrographic Risk Assessment – Vanuatu. Marico Marine Report No: 12NZ246-1. Prepared for Land Information New Zealand (LINZ). Wellington, New Zealand.
Riding, J., and Rawson A. (2015). LINZ Hydrography Risk Assessment Methodology Update. Marico Marine Report No: 15NZ322. Prepared for Land Information New Zealand (LINZ). Wellington, New Zealand.
Rodriguez, K. (2020). Dispute over Dead Pelicans, Daily Express, viewed 15 January 2020, https://trinidadexpress.com/newsextra/dispute-over-dead-pelicans/article_c3538c7e-2d5b-11ea-a3b8-878bba07f0c6.html.
Singh, K. L. (2018). A Graveyard in the Gulf of Paria, Saturday Express, viewed 15 January 2020, https://trinidadexpress.com/news/local/a-graveyard-in-the-gulf-of-paria/article_dcd313fe-db8b-11e8-8be0-fbe70805bd15.html.
Thanh, N.X., Park, Y. and Park, J. (2012). “A Quantitative Marine Traffic Safety Assessment of the Vung Tau Waterway”, Journal of Navigation and Port Research, 36(9), pp. 721-728.
Thanh N.X., Park, Y. and Park, J., Jeong, J. (2013). “Developing a Programme to Pre-process AIS Data and applying to Vung Tau Waterway in Vietnam – based on IWRAP MK2 Program”, Journal of the Korean Society of Marine Environment and Safety, 19 (4), pp. 345-351.
Thanh N.X., Park, Y. and Park, J., Kim, T. (2015). “A Study on the Marine Traffic Assessment based on Traffic Distribution in the Strait of Malacca”, Journal of the Korean Society of Marine Environment and Safety, 21(1), pp. 025-033.
Trinidad and Tobago Meteorological Service. (2011). Forecast, Trinidad and Tobago Meteorological Service, viewed 15 January 2020, http://www.metoffice.gov.tt/.
UKHO (2005). Gulf of Paria, Admiralty Chart No. 483, United Kingdom Hydrographic Office.
United States Coast Guard (2019). Ports and Waterways Safety Assessment Workshop Guide. Navigation Centre, United States Coast Guard, viewed 15 January 2020, https://www.navcen.uscg.gov/?pageName=pawsaGuide.
Valdez, S. (2014). Derelict Vessels in the Gulf Still a Danger, Trinidad and Tobago Guardian, viewed 15 January 2020, http://www.guardian.co.tt/article-6.2.380068.52902e41ca accessed November 2019.
Vesselfinder. (2019). Vessel Finder, viewed 20 November 2019, https://www.vesselfinder.com. Ward, K. R. and B. Gallagher, B. (2011). Utilizing Vessel Traffic and Historical Bathymetric Data to Prioritize Hydrographic Surveys, in: S. Barbum (ed). U.S. Hydro, National Ocean Service, The Hydrographic Society of America. United States of America.
Warner, G.F. (1981). Species Descriptions and Ecological Observations of Black Corals (Antipatharia) from Trinidad. Bulletin of Marine Science, University of Miami. Miami, United States of America.
9. Authors biographies
Dawn Seepersad is an Advisor to IALA and a PhD student in the Department of Geomatics Engineering and Land Management at the University of the West Indies in Trinidad and Tobago. Her research is entitled: An Economic Evaluation of Risks due to Maritime Navigation across the Greater Caribbean Region. Her research is being supported by the Commonwealth Marine Economies Programme. Prior to commencing her research, Dawn was a GIS intern at Land Information New Zealand, where she worked on the Niue Hydrographic Risk Assessment. Dawn holds a BSc. Geomatics Engineering (Honors) and a MSc. Geoinformatics (Distinction). E-mail: dawn@seepersad.org
Omar Frits Eriksson is the Deputy Secretary General of IALA and the Dean of the IALA World-Wide Academy. Omar contributed to the creation and development of IWRAP Mk2. He has 30 years of experience of Managing Aids to Navigation services and has chaired IALA technical committees such as the e-Navigation and the Engineering Committee for decades. Omar has a degree in telecommunication and has a master’s degree in Management of Technology and Innovation from the Technical University of Denmark. He is also a visiting professor at Jimei University in Xiamen, China. E-mail: omar.eriksson@iala-aim.org
Adam Greenland is National Hydrographer at Land Information New Zealand (LINZ), the New Zealand Hydrographic Authority (NZHA). He holds a Merchant Navy Deck Officer certificate of Competency, a tertiary qualification in Hydrographic Surveying and Mapping Sciences, and is a Member of the Royal Institution of Chartered Surveyors. Adam has previously held roles at the Port of London Authority, UK, which included Deputy Port Hydrographer.
Keith Miller is a Senior Lecturer in the Department of Geomatics Engineering and Land Management at the University of the West Indies in Trinidad and Tobago. He delivers courses in relation to Geodesy and Hydrography within a BSc programme in Geomatics and undertakes research in these disciplines. Keith is a Member of the Chartered Institution of Civil Engineering Surveyors and is a former Member of the International Board on Standards of Competence for Hydrographic Surveyors and Nautical Cartographers.