
Abstract
1. INTRODUCTION
The prosperity of civilizations that pioneered economic activity through trading between settlements on the Mediterranean Sea stands out in human history. From that time, knowing the benefit of efficient waterways for the transportation of goods, the improvement of navigation proved to be fundamental for the maintenance of great empires, territorial expansions and pursuit of goods that could only be transported by the sea.
Today it is no different. The capacity of a country to manage its production, receive tourists and explore its natural resources in its Jurisdictional Waters is closely related to the maritime port structure that this State possesses. So, it is vital, in order to contribute to increasing the national economic system, to find ways to optimize the aspects related to this structure and its proper use.
Regarding navigation, the draft of the ship, which is defined as the linear measurement of submerged portions of the hull, is directly linked to its ability to transport cargo. In port operations, it is generally seen that ships transport the maximum permissible load, therefore, having the maximum draft.
Considering that the concept of effectiveness is related to the achievement of a purpose and efficiency to the optimized use of the resources employed in that accomplishment, in the context of port operations, it is important to reduce the intervals of permanence of the ships to the exact loading and unloading times in the terminals. Those intervals, known as operational windows, when they occur mooring and unberthing maneuvers are limited by several parameters relating to the environment and vessels, their calculation is summarized in the under keel clearance (UKC) indicator.
In order to expand the operational window, when the UKC along the route is safe, two effective approaches are possible: acting in the environment in order to change it, especially by dredging the access channels, giving rise to the increase in UKC throughout the route of the maneuver or seek to operate in harmony with some environmental changes by gathering environmental and vessel information and using it in real time to safely and in detail predict the safety margin that is available. Both contribute to the purpose, however only the second has a focus on efficiency, in addition to not requiring the huge investments that are necessary for the first one.
Considering fluctuations in the value of the UKC is to consider subtle variations of the draft, in the face of changes in the environment along the route of the maneuver, as a function of those changes and the design of the vessel, thus having a value of draft with variable characteristics, the dynamic draft.
Expanding the operational window means rotating the operating cycle faster, reducing the idle time between maneuvers and thus saving unnecessary costs. Therefore, the issue that permeates this theme today is the comparison between the static depth, presented in the cartographic document and the instant depth, tuned to the characteristics of the ship and their comparison, which is aimed at checking the UKC repeatedly and can contribute to the expansion of the operational window in the port.
2. THE CONCEPT OF DYNAMIC DRAFT
Nautical cartography, in its development over the years, has made an effort to represent waterways in order to provide decision-making tools for planning and position monitoring with adequate safety margins at any time of the year and under diverse meteorological and oceanographic conditions.
However, in order to have the nautical chart statically represent the environment, which is eminently dynamic, it is necessary to use some approximations.
The definition of a nautical chart presented by the IHO Manual on Hydrography (C-13) is the following:
a graphic portrayal of the marine environment showing the nature and form of the coast, depths of the water and general character and configuration of the sea bottom, locations of dangers to navigation, rise and fall of the tides, cautions of manmade aids to navigation, and the characteristics of the Earth’s magnetism. (IHO, 2011, p.7).
From the definition cited and the one illustrated in the figure below, involving mainly measurements of tides, currents and waves, it is noted that using charts does not make it possible to find all the necessary information, in particular referring to those local dynamic factors, which influence the accuracy that the maneuver in port environments requires.
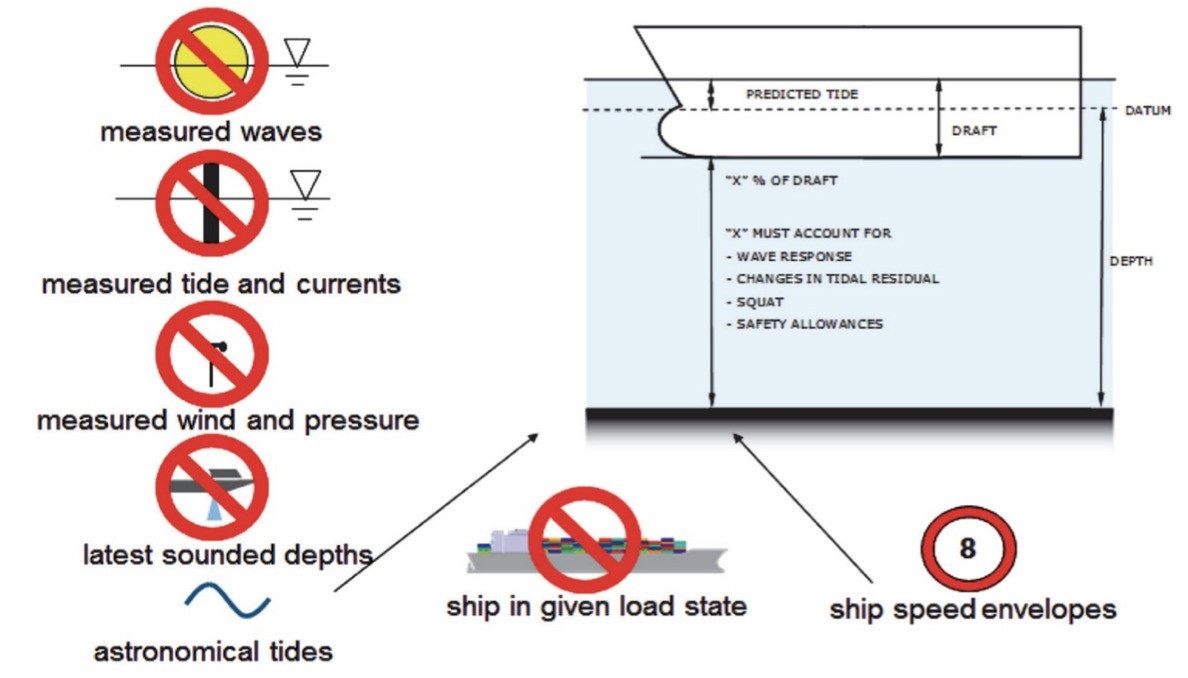
The figure illustrates that from the mapped depth, referenced to a Datum, the safe UKC of operation is calculated, in percentage values of the draft, from data of the height of the astronomical tide of the variation of draft inherent to the inclination of the ship in its axes of freedom, the Squat Effect (depending on the speed of evolution) and the safety margin adopted by the navigator. However, each listed component presents an intrinsic and variable uncertainty according to the accuracy adopted in each situation, limiting the port authority in the adoption, through formal normative ways of an operational draft that exceeds the mapped depth.
It is evident that the greater the draft of a vessel sailing on a channel, the greater the amount of cargo carried on the same trip. Quantitatively, the appropriate way to measure such quantity is by means of the Tonnes Curve per centimeter of immersion (Fonseca, 2019) of each vessel. The order of magnitude for an ore cargo vessel or a containership indicated by an increase of 10 cm of operational draft, depending on the length of the vessel, is shown in the graphs below.
Having this notion of efficiency in maritime transport and the consequent economic advantage linked to navigation in restricted waters, it is noted that the instant combination of the appropriate variables to the static information of the cartographic document is fundamental for port operators.

The following figure illustrates the adoption of sensors that provide updated information on the parameters that influence the determination of the UKC, thereby reducing the uncertainties of the variables. By means of an appropriate mathematical modeling, the quotas corresponding to each parameter are then obtained, enabling the definition of the operational windows that dictate the safe interval that each vessel is able to navigate.

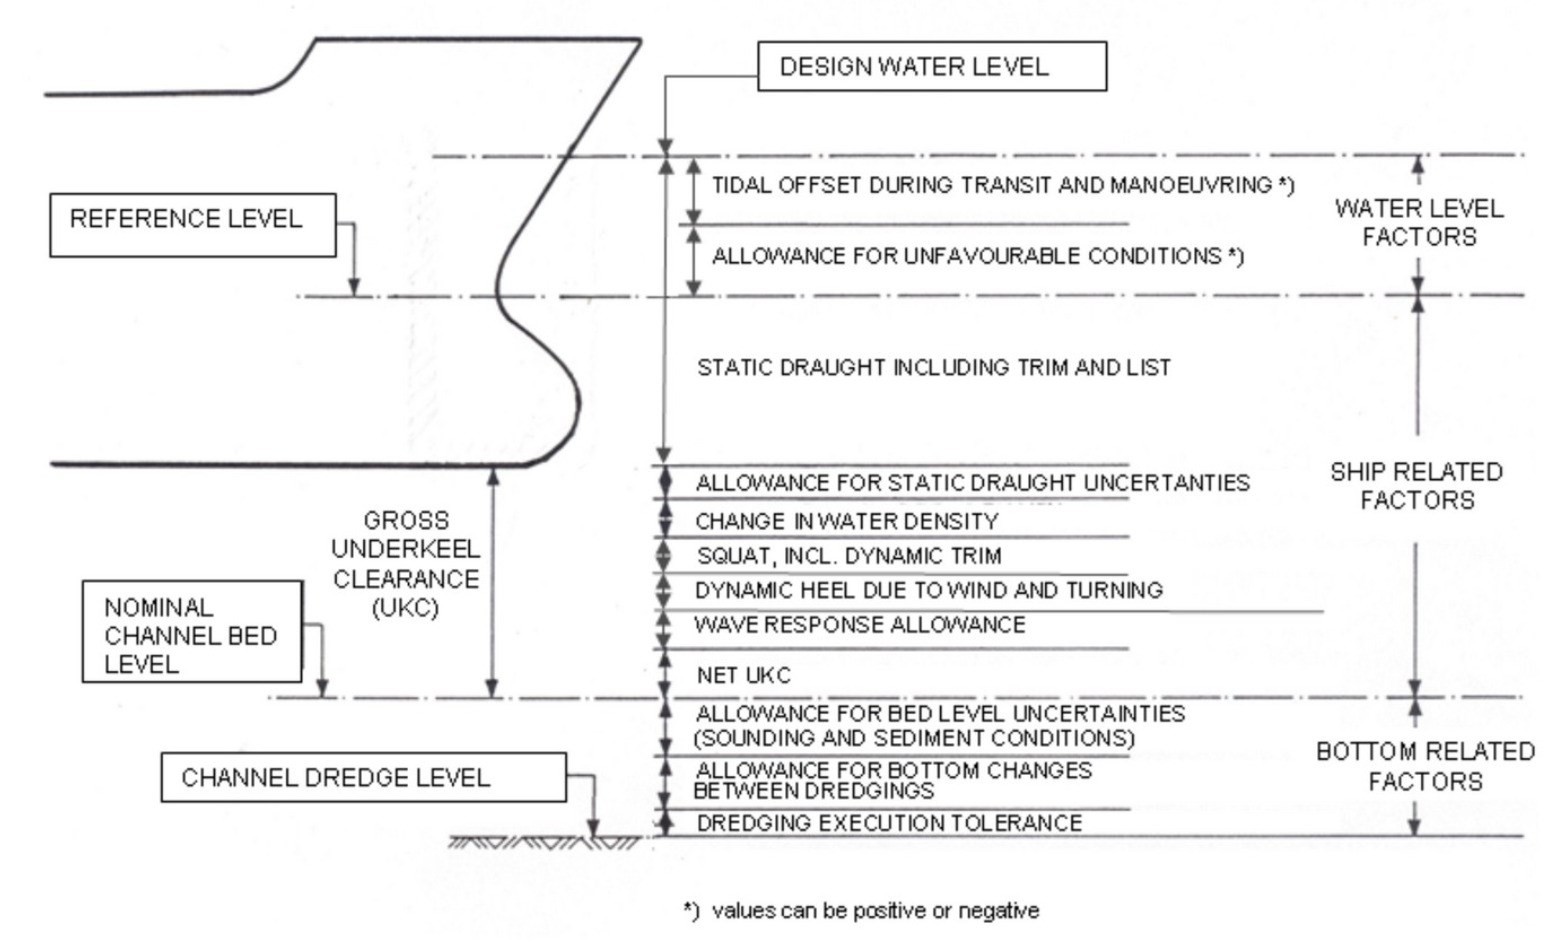
The World Association for Waterborn Transport Infrastructure (PIANC), in its Report No. 121-2014 (PIANC, 2014), determines the guidelines for the implementation of port channels and adopts a series of terms presented in the figure below that conceptualize the factors in determining depth on a waterway. Such concepts are divided into three categories of factors: those related to sea level, those related to the platform and those related to the bottom. The meaning of each parameter will be explained below.
2.1 Factors related to Sea Level
According to Franco (2009), the periodic oscillation of the sea level occurs due to the action of astronomical forces, predominantly of the moon and the sun, in all the extension of the terrestrial globe. The tidal generating force, according to the theory of static tide, acts with different periods and intensities in each location, as it varies with the observer’s latitude, declination and hourly angle of the moon, presenting harmonic components that oscillate in their time series in periods of up to approximately 18.7 years.
Associated with this phenomenon of global scale, in which the tide presents a wave behavior in shallow waters, there is also the action of local phenomena that distinguishes the amplitude of the theoretical tide from the real tide, they are: resonance, bottom friction and the increase in amplitude due to the reduction in the depth and geometry of the estuary (presence of accentuated channels and gradients).
As the prediction of the height of the tide must be carried out for each region, it is appropriate that the cartographic services use a local vertical datum to reference the mapped depths. In general, the Reduction Level is adopted as approximately the average of the low tides of syzygy, defined by means of the Harmonic Analysis of the tide components, assuring the navigator that the sea level, due to the astronomical effects, is very rarely found below the depth shown on the nautical chart.
Another more rigorous way is the adoption of the lowest historical level (Lowest Astronomical Tide – LAT) that the tide can assume in the syzygy due to the lower frequency harmonic constant (Franco, 2009). In this case, the nautical chart would guarantee that the real depth would never be less than the mapped (due only to astronomical effects), however the excess of rigor, when using as reference a level that appears only once in a cycle of approximately nineteen years, promotes a compromise in determining the operational draft when only this static information is considered in the calculation of the UKC.
For predicting the height of the tide at any given moment, the most used resource is the Tide Tables, which is published annually by Hydrographic Services, containing the forecast for the main ports, terminals, oceanic islands and anchorages. The use of such a resource offers the navigator an estimate of the times of high tide and low tide, however in the intervals between such extremes, the table only allows interpolation where there are no considerable inequalities, which keeps the curve resulting from the pure sine wave away.
Thus, seeking to increase precision and accuracy, in addition to allowing computational integration with the other sensors eventually involved in real-time monitoring, it is important to use a digital tide gauge with electronically discretized data, linked to a mathematical model that includes the constants harmonics and the prediction of their respective periods, which becomes essential in the area of interest.
The second factor that must be considered, related to the variation in sea level, is the influence of meteorological conditions in the port region. The ocean-atmosphere interaction and the horizontal gradient of atmospheric pressure can cause both an increase in the level due to the stacking of water on the coast and a reduction in the level due to the withdrawal of water by local or synoptic phenomena.
According to Pugh (1987), the formation of waves, the third factor to consider occurs with the transfer of momentum from the winds to the sea surface, causing disturbances that intensify according to the continuous performance of this energy source and propagate with periods and well-defined amplitudes for kilometers beyond their generation area. When approaching the coast, these waves start to exhibit non-linear behaviors for the same reasons mentioned for tidal waves, plus refraction, diffraction and reflection, which in this case will be clearer because they are oscillations with short associated periods.
It is natural to assume that coastal engineering works are planned with a view to reducing the effects of the waves, in order to reduce their amplitude in the port areas, however in the interface that connects the access channel from the port to the sea, such interaction is inevitable and must be accompanied by means of sensors installed in buoys with the purpose of composing the desired precision in determining the UKC. It is worth mentioning that the data obtained can be correlated with the forecasts provided by the meteorological services, which provides essential elements for the safety of navigation.
While the effect of the direct incidence of waves on the coast causes the piling up of mass, raising the level and accentuating the amplitude of oscillation of the water column, on the other hand, the phenomenon of resurgence caused by Ekman Transport can occur. This effect of lowering the sea level is due to the fact that the superficial layer of water along the coast is displaced towards the deeper areas.
The study by Coelho et al. (2016) has showed that there is a significant contribution of Ekman Transport at the Reduction Level to the region where the research was carried out, where an average daily drop of 60 cm at sea level was found, bringing it to 20 cm below the Reduction Level. Although it offers risks to the safety of navigation, this phenomenon does not occur suddenly, as it depends on a geostrophic movement in which the Coriolis Force acts.
Therefore, the simplified formulation that governs sea level (μ) over time will be given by a Mean Sea Level (MSL), referenced to a local vertical datum, added to a time series (A) as a function of its decomposition harmonic governed by a deterministic pattern of oscillations under gravitational influences of the moon and sun, and a third term, determined by stochastic factors, which varies with the meteorological conditions (M) that can be inferred by numerical modeling fed by properly positioned sensors. Therefore, we have that:
μ(t) = MSL + A(t) + M(t)
When planning a port operation, the variation in sea level due to the effects of the astronomical tide and the prevailing weather conditions must be taken into account during the entire transit and maneuvering of the ship, from entering the access channel to the berth mooring and to understand the entire time interval necessary for its completion.
Therefore, it is assumed that the variation in daytime, semi-daytime or mixed sea levels associated with interference resulting from the ocean-atmosphere interaction in the region will be one of the main parameters for the adequate and accurate determination of operational windows.
2.2 Factors related to the platform
Currently, the range of platforms with different characteristics, shapes, types and functionalities is enormous. In order to contemplate all of them, it is necessary to define which static and dynamic parameters must be considered when determining the under keel clearance. According to the illustration shown in figure 4, it can be seen that the PIANC divides these factors into two groups:
1) Static draft: level between the sea level (referenced to the Datum of the nautical chart) and the lowest level of the ship’s keel.
2) Gross Under Keel Clearance: level between the ship’s keel and the bottom corresponding to the nominal depth of the channel (mapped depth).
The first group as its name characterizes it is static and defined, in general, at the time of loading the vessel, varying according to the dimensions and the volume of cargo to be transported. The draft can have different dimensions along the longitudinal plane of the ship, resulting in an imbalance between the forward level and the aft level, called Trim. As a measure to prevent the ship from touching the bottom, the lowest draft of the hull is assumed as the vessel’s draft.
The second group consists of six parameters, namely:
a) Tolerance due to uncertainties in the determination of the Static Draft: in the measurement of the forward and aft dimension there are several sources of uncertainty that must be considered to assume a nominal value. The draft scale at the side includes a measurement with limited accuracy in its reading, aggravated by the occurrence of ripples in the waterline and the possibility of the transverse inclination of the ship.
b) Variations in water density: most of the ports are located in estuarine regions, with the waters of the internal channels that house the berths highly influenced by the hydrological discharge. The access channel that connects the port to the sea has a higher salinity, consequently there is a variation in the density of water in the course of the ship.
The variation of this environmental parameter is related to the platform, and therefore to the geometry of its living works, as it acts directly on the submerged portion of the hull of the vessels, altering the resultant of the buoyant force that makes it possible to float, corroborating the Archimedes Principle. According to PIANC (2014), a ship that comes from the sea and enters a “fresh water” environment may present an increase in draft in the order of magnitude of 2 to 3%.
c) Squat effect: it is a hydrodynamic interaction, resulting from the Bernoulli effect and therefore also related to the geometry of living works, where the variation of the speed field along the vessel’s hull influences the pressure field that the water exerts on the structure, conserving the balance between kinetic energy and flow potential. This phenomenon “(…) produces a downward vertical force (causing sinking, positive downward displacement) and a moment on the transverse axis (causing trim) that may result in different values in the bow and stern.” (PIANC, 2014) being strongly accentuated in shallow waters and by the increase in the vessel’s speed.
The difficulty in determining this parameter stems from the fact that it is specific to each hull shape and varies according to the constructive configuration of the channel, which is evidently not constant along its length. In this way, the modeling of Squat is done empirically, generating formulations that seek to determine its effect for ships and channel patterns of the same type.
Currently, the most accepted approach was proposed by Huuska (1976, apud Ruggeri, 2018, p. 9), which should be applied in each section of the channel, considering its bathymetric profile, and according to the block coefficient of the ship and its relative speed (vectorial sum of the speed of evolution with the speed of the current).
The following figure shows the bathymetric profile of several normal sections of the same channel, showing that the application of the approximations for the calculation of the quota that the Squat causes in each ship must be analyzed individually, in the field, along the entire extension of the area of interest and dynamically.

The classification, proposed by PIANC (2014), divides a channel into three idealized categories: Unrestricted (navigation channel limited by a smooth gradient of the bottom in its margins), Restricted (presence of a lowering of the bottom that limits the margins of the channel) and Canal (limited by strictly solid margins). For each category, a correction is applied in the calculation, which includes the dimensions of the normal section: distance between vertical margins and depth.
d) Dynamic inclination due to yaw or wind: during the yaw of a vessel, the intensity of the transverse slope will depend on the speed of evolution, yaw rate, metacentric height and the forces applied by the cables connected to the port tugs, if applicable (PIANC, 2014). Additionally, the ship may suffer the influence of the wind, which will cause an angle of inclination, depending on the direction it falls in relation to the bow, increasing the influence according to the sailing area and the aerodynamic shape of the vessel’s superstructure. Therefore, the dynamic inclination will increase the draft of the ship, since one of the edges will have its elevation increased, approaching the bottom.
e) Response movements to waves: the platform has six degrees of freedom (three of rotation [roll, pitch and yaw] and three of translation [heave, surge and sway], through which it moves under the influence of waves. This aspect is closely related to what was previously said about sea level variation for meteorological reasons, considering that the length of the waves is the same order of magnitude as the dimensions of the ships.
The situation that offers the greatest risk to navigation is when the resonance phenomenon occurs, which causes the amplification of the vessel’s movements. Its predictive analysis is made in the frequency domain, in order to discriminate the incidence of oscillations, caused by waves, close to the ship’s natural frequency in some of its degrees of freedom (roll, pitch and yaw) (RUGGERI, 2018).

f) Net UKC: the last component of the gross UKC represents the shortest distance the keel of the ship can take in relation to the bottom, considering the nominal depth of the waterway. Therefore, it is determined through the integration of the other parameters addressed in their extreme situations.
According to Icorelis (1980, apud PIANC, 2014) the definition of this safety margin must be based on the type and size of the vessel, the cargo being transported (it is advisable to increase the quota for dangerous cargoes), the environmental consequences that an incident would cause in the traffic density, among other risk factors that are characteristic of each port operator. The author recommends a “net UKC of at least 0.5 m, which can be increased to 1.0 m where the consequences of touching the bottom are severe (eg, in channels with a rocky bottom)” (PIANC, 2014, p. 33). Thus, since such margin is arbitrated through experience and risk management for navigation in the region, the participation of Pilotage and the Maritime Authority in its proper determination is essential.
2.3 Factors related to the bottom
The last category of factors is directly related to the aspects of bathymetric survey, geology and the sedimentological nature of the waterway. The quota range covered by these factors varies from the nominal level adopted for the bottom, this being the value inserted in the nautical chart, up to the level of the dredging depth of the channel.
The terms are defined by PIANC (2014) as: allowance for bed level uncertainties (due to bathymetry); allowance for bottom changes between dredgings (due to bottom sedimentation);
and Dredging Execution Tolerance. So the uncertainties of the factors related to the bottom can be satisfactorily generalized, such as those resulting from the Hydrographic Survey, carried out conveniently after a situation of balance in the sedimentological erosion in the bottom, after the dredging works.
The IHO Standards for Hydrographic Surveys (S-44) (IHO, 2020) classifies the surveys and establishes uncertainty criteria that they must meet for each situation in which they must be performed.
Other factors related to the bottom but that will not be the scope of this research are related to the viscosity of the environment, in which the study of rheology defines parameters for the characterization of Fluid Mud in the seabed, allowing, with due management of the associated risk, the navigation of vessels touching the bottom.
3. TECHNICAL STANDARDIZATION
In the last decades, the maritime sector, following the global trend, has seen the development and improvement of several technologies. The massive digitalization and automation of equipment and sensors is increasingly present on board, from the construction to the operation of the ships. At the same time, as discussed in the previous section, the tonnage and the cargo capacity transported per trip have been presenting increasingly complex and refined operational requirements, since the economic interest dictates the mercantile rhythm of navigation.
In this context, the E-Navigation concept was presented by the International Maritime Organization (IMO) as a strategy to implement the integration of navigation tools, in order to improve navigation operation and safety. It is defined as: “the harmonized collection, integration, exchange, presentation and analysis of marine information on board and ashore by electronic means to enhance berth to berth navigation and related services for safety and security at sea and protection of the marine environment.” (IMO, 2020).
In this way, we can infer that E-Navigation is a concept that aims at the integration and harmonization of systems, including future systems and those already on board, with the exchange of useful data between ships and operators that provide ground support services in favor of security and operational simplification. The main objective is to develop a system that can adequately organize data from all sources in a given area, in order to expand and maintain a high level of security while also giving rise to increased situational awareness and supporting the operators decision-making.
The document NCSR 1/28 in its Annex 7 of the IMO Navigation, Communications and Search and Rescue Sub-Committee (NCSR), called “Draft E-Navigation Strategy Implementation Plan” (IMO, 2020) lists five solutions, in order of priority for the fulfillment of this system. They are:
- S1: improved, harmonized and user friendly bridge design;
- S2: means for standardized and automated reporting;
- S3: improved reliability, resilience and integrity of bridge equipment and navigation information;
- S4: integration and presentation of available information in graphical displays received via communications equipment; and
- S9: improved communication of VTS Service Portfolio.
This publication examines each solution individually and tries to standardize each of the procedures that must be adopted by users. In this standardization, S4 stands out, as it foresees the adoption of the International Hydrographic Organization’s model S-100 for the presentation of the aforementioned relevant information and communication with other sources. Figure 7 outlines the various standards and tools contained in this IHO framework, exemplifying the parameters that must be adopted worldwide to implement the E-Navigation concept.

Inserted in this list of products, there is the S-129: Management and Specifications of Under Keel Clearance Information (IHO, 2019), reinforcing the idea that the dynamic draft and its proper determination are relevant factors in the waterways. Thus, it can be considered that the main actor, with regard to the definition of technical goals for the determination of UKC systems, is the IHO.
The purpose of this publication is to define requirements for the production of a data layout that can be inserted and presented superimposed on the other information that make up an electronic navigation chart, provided for the S-100 framework (IHO, 2019).
Thus, information from a dynamic draft determination system can be used both in planning and during port maneuvers.
The operational dynamics, according to the S-129 (IHO, 2019), occur as follows:
a) Initial navigation planning: a ship that plans to call at a given port needs to determine the time intervals in which sea level conditions are suitable for sailing in that area. Based on static parameters, a series of possible windows is defined for a given ship, concluding a pre-plan with the intention of maneuver.
b) Adequacy of on-track planning with operational monitoring of the dynamic UKC: choosing the appropriate operational window for the ship, while it approaches the area covered by the dynamic draft determination system, the vessel’s particular data (information about dimensions, stability, draft and so on). The system operator will identify you and establish a correspondence with a type ship pre-defined by the system, with the respective dynamic data provided. When integrating the data related to the ship with information on predicted and observed environmental conditions (wind, tide, current, etc.), a maneuver plan is defined.
This plan establishes directions, speed restrictions and non-navigable areas. In the planning phase, Control Points are inserted: waypoints associated with the time interval in which the ship will find a satisfactory Maneuverability Margin. The logistical aspect can also be favored by the precision of this planning that can be shared with other actors, such as the shipowners, the management company, the charterers or the ship’s agent in the port, who will receive subsidies to contact the port authorities of interest for making the necessary reservations, such as the pilotage service or the availability of a berth.
The planning of the maneuver can be changed due to changes in the predicted weather forecasts, tide heights or damage and limitations of the ship. This update process allows the ship to manage its speed to meet the time window defined for navigation, reducing or eliminating the need for anchoring off the approach channel to await favorable conditions for entering the port.
c) Monitoring during the maneuver: since the product of the S-129 is a data layer applicable to electronic nautical charts, its display is liable to be displayed on the Electronic Chart Display System (ECDIS) equipment installed on the ships’ passageways or, when applicable, at VTS stations operating on land controlling traffic in certain areas. Additionally, it is usual for information to be also displayed on mobile devices used by Pilots, called the Portable Pilot Unit (PPU), improving decision making during the maneuvers.
Dynamic draft determination systems provide real-time data to these display platforms, enabling the monitoring of the waterway and areas suitable for the passage of the ship, respecting the limitations imposed by the Port and Maritime Authorities. As the vessel progresses through the planned course, the factors related to sea level vary, the non-navigable areas are being updated and the time intervals of each waypoint are being monitored.
After docking and the ship’s loading operation is completed, the new stability and draft parameters must be passed to the system operator who will determine, through the same operational dynamics, the safe window for the ship to leave the port.
The other technical aspects, data structuring diagrams, presentation requirements, standardized metadata formats, among other specifications imposed by IHO are described in that publication.
The following figure illustrates a representation of the symbology in the established pattern, exemplifying a route, the control points separating the kicks, the non-navigable areas in red and the non-navigable areas in yellow. It is observed that this information is superimposed on other layers of data available in the electronic nautical charts of the model S-100. Evidently, this is an example of the user’s visualization (master, pilot and VTS), and the system may contain other layouts with additional useful information.

4. COMPUTER SYSTEMS
The range of systems in operation at ports around the world is enormous, but the principles of application and operation are similar. The implementation project must meet and contemplate the characteristics and peculiarities of each waterway, demanding a study of the dynamics of the area of interest, of the environmental and climatic factors involved, as exposed in the conceptualization of dynamic drafts, and of the type ships served by the information produced.
Meteorology and ceanographic aspects are implemented in two ways: observed data and forecasts. In general, to obtain real-time values of the elements of interest, remote monitoring is employed, in which the following sensors are conveniently positioned: tide gauges, indographs, anemometers and Acoustic Doppler Current Profiler (ADCP).
The application of the predictability aspect of these elements is carried out by means of hydrodynamic modeling, which tends to present good accuracy and precision, since its demand is in a short time scale and the aforementioned sensors feedback these models. It is also possible to associate the modeling with the forecasts coming from the meteorological services, with the proviso that the spatial scales employed must be adjusted.
A source of highly relevant data is the local bathymetry, respecting the sedimentary features and characteristics of the area of interest, which will dictate the necessary frequency of conducting new hydrographic surveys that update the system and enable the appropriate measurement of the UKC in each section of the site port canals. The uncertainties associated with this aspect are those related to the order of the survey defined by IHO and increase throughout time in accordance with the geological nature and the sedimentary dynamics of the region.

Finally, the other data source used in the implementation of the dynamic UKC determination systems is related to the ship’s maneuverability factors, in this case, model ships are established and modeled by the system developer and tested in tanks in order to determine the dynamic responses to fluids (water and air). Such simulations increase the accuracy of the vessel’s behavior in various situations of yaw and speed on the waterway. Through computational resources, the coefficients that will be inserted in the systems are calculated, reducing the associated uncertainties.
After integrating these data, the systems use computational resources to operationalize their use and calculate the ideal intervals for each maneuver. “Nowadays, cloud computing offers great computational capacity and the data transfer from the monitoring system is very robust, with access to the internet on several platforms.” (Ruggeri et al, 2018, p.16)
In this way, in order to optimize the system, calculations are performed in the cloud and the output format and the respective computational platform can be customized according to the preferences of each user. Since different users may require different data, for example those required by the IHO S-129 model, a single database is managed in the cloud to provide each user with the required information.
The systems validation phase aims to determine the accuracy and precision in the determination of the elements that compose the calculation of the UKC, in addition to certifying that the decision support information extracted from them fulfills the requirements, ensuring that the system will provide a sufficient probability suitable for safe use by its users.
Meteoceanographic data, because they are obtained through on-site measurements, are susceptible only to the uncertainties of the sensors and will present results as satisfactory as the equipment specifications are. Therefore, in order to maintain the validity of these data, the maintainer of these systems must comply with the periodicity of calibration and replacement of components established by the manufacturer.
The uncertainties related to the hydrodynamic models are also measurable and usually associated with the interpolation factors used by the formation algorithm, however, as they have the possibility of feedback by the sensors, they tend to present an even more reliable performance.
Therefore, the greatest source of uncertainties in the validation of the systems is linked to the execution in the real environment of the simulations performed on the models created for the test tanks.
Therefore, for a system to be validated, it is necessary to carry out evaluation runs on standard ships for which the calculation of the dynamic draft is appropriate in that port. These tests will ensure that the sum of uncertainties, both in the data acquisition phase and in the calculations made by the software, will be lower than the safety margins used by the authorities in determining the Maneuverability Margin.
A methodology used in carrying out the evaluation runs consists of the disposition of DGPS receiving antennas at the bow, stern and at the ends of each edge. Through the obtained positioning data, it is possible to measure the rotation and translation responses of the platform on its axes of freedom, along the entire route traveled on the waterway. Therefore, once the parameters provided by the system are known and the quantities measured during the tests, it is possible to guarantee, by comparison, the accuracy of the data provided by the system and to evaluate the robustness of the parameters obtained in test tanks for each type-vessel.
5. CONCLUSION
The management of under keel clearance is becoming a reality in most of the ports around the world. As the demand for efficiency grows, it is important to have a decision support tool that fulfills this purpose keeping the requirements of navigation safety.
The methods for determining operational windows or non-navigable areas using only static factors are ways for decision-making tools that consider in particular the environmental factors, both those of the vessel and the structural characteristics of the channels.
The use of these systems allows accurate determination of the best times for entering and leaving ports by observing and forecasting environmental elements, thereby increasing the efficiency of port maneuvers. When it is integrated with the navigation systems, incorporating the E-Navigation concept, the determination of the under keel clearance allows commanders and pilots to manage speed variations, use of tugs and areas to be avoided during navigation in restricted waters having more accurate subsidies.
It was seen that the creation of standards, such as the S-129 framework by IHO, resulted from the perception of the diversity of actors that exchange information, in the operation of the computational systems that calculate and predict the UKC.
This research has identified the environmental and vessel parameters involved in the calculation and prediction of the dynamic draft, however it is assessed that the experience in the effective use of those draft systems is vital in increasing the accuracy of the responses, resulting in economic efficiency and respecting the security aspects. Besides, as it was previously mentioned, it is needed to adopt minimum parameters capable of being used as indicators, which will allow a quick and objective analysis by the Maritime Authority.
The economic advantages associated with the use of these systems are undeniable, keeping the security of port navigation. In addition, intangible and priceless gains are highlighted, such as the prevention of environmental disasters, reduction in the emission of polluting gases and consumption of fossil fuels per ton transported, greater speed of production flow, among other ones.
The improvement of equipment, hydrodynamic models and the computational technologies involved tend to increase the accuracy and precision of the factors predicted by the systems. The use of dynamic under keel clearance management tends to become a common and fundamental practice in the future of waterways. However, the navigator that uses this navigation aid is still likely to be analyzed in order to make the correct decision keeping the safety of navigation and the safety of life at sea, even having these robust and reliable tools.
6. REFERENCES
– Coelho, Alexandre L.; Teixeira, Fabíola V. B.; Teixeira, Gregório L.G. Impacto do Processo de Ressurgência Costeira no Nível de Redução: caso Baía de Sepetiba, Brazilian Congress of Oceanography, Salvador, Brazil, 2016.
– Fonseca, Maurílio Magalhães. Arte Naval, 7th ed., v. 1 & 2, Rio de Janeiro, Brazil, Serviço de Documentação da Marinha, 2019.
– Franco, Alberto dos Santos. Marés: Fundamentos, Análise e Previsão, 2nd ed., Rio de Janeiro, Brazil, Diretoria de Hidrografia e Navegação, 2009.
– International Hydrographic Organization (IHO). C-13: Manual on Hydrography, 1st ed., Monaco, 2011.
– International Hydrographic Organization (IHO). S -44: Standards for Hydrographic Surveys, 6th ed., Monaco, 2020.
– International Hydrographic Organization (IHO). S-100 Universal Hydrografic Data Model, Monaco, viewed 09 June 2020, https://iho.int/en/s-100-universal-hydrographic-data-model.
– International Hydrographic Organization (IHO). S -129: Under Keel Clearance Management Information Product Specification, 1.0.0 ed., Monaco, 2019.
– International Maritime Organization (IMO). Sub-Committee on Navigation, Communications and Search and Rescue. NCSR 1/28 Annex 7. Draft E- Navigation Strategy Implementation Plan, London, UK, 2019.
– Miguens, Altineu Pires. Navegação: a Ciência e a Arte, 1st ed, v. 1, Rio de Janeiro, Brazil, Diretoria de Hidrografia e Navegação, 2019.
– Pearce, Jonathon. Advances in Under Keel Clearance Risk Management, Prácticos de Puerto, Madrid, Spain, year XVI, n. 70, 2012.
– Pugh, David T. Tides, Surges and Mean Sea-Level, Sw indon, UK, Natural Enviroment Research Council, 1987.
– Ruggeri, Felipe et al. The Development of ReDraft® System in Brazilian Ports for Safe Underkeel Clearence Computation, PIANC World Congress, 34th., 2018, Panama City, Panama. Full Papers – Ports […].
– The World Association for Waterborne Transport Infrastructure (PIANC). Report no 121 – Harbour Approach Channels Design Guideline, Bruxelles, Belgium, 2014.
7. AUTHOR BIOGRAPHY
“Lieutenant Gustavo R. Catarino, Navigator of Hydroceanographic Vessel ” Amorim do Valle” (Brazilian Navy). B.Sc. in Naval Science (Naval College, 2016), he completed the Hydrographic Course IHO/FIG/ICA Category A in 2020 (Directorated of Hydrography and Navigation – DHN). E-mail: gustavo.catarino@marinha.mil.br”