

Abstract
1. INTRODUCTION
Along with droughts, floods are one of the two most important water-related disasters closely linked to global climate change (United Nations, 2021). A consequence of climate change is an increase in locally heavy precipitation (Lehmann et al., 2015, Mueller and Pfister, 2011), which can cause almost unpredictable flash floods occurring in shortest times at smallest water bodies. A dramatic example is the flood disaster in the north of Rheinland-Pfalz, Germany in the summer of 2021. Storm events led to several flash floods in the district of Ahrweiler resulting in numerous deaths and injuries as well as a widely destroyed infrastructure within a few hours.
Hydrography is concerned with surveying and monitoring the physical characteristics of marine, coastal and freshwater environments, including rivers (IHO, 2022). One key parameter to be ob- served is the water level. Conventional water gauging stations monitor water levels reliably in de- fined ranges, but they are very expensive in construction, maintenance and operation. For this reason, they are usually installed at water bodies relevant for water management with large dis- tances to each other while smaller water bodies remain often ungauged, e.g. Kirchner (2006). The associated high costs are also one reason why water resources are insufficiently monitored in many regions of the world, e.g. UNESCO and UN-Water (2020). In the case of extreme events, failures and destruction of such stations must be expected by unforeseen floods, as happened in the 2021 flood disaster, which were crucial for disaster management. The decisions made in re- sponse are still heavily criticised (Spilcker, 2021).
In order to improve the prediction quality of flood events, novel, cost-effective and versatile water gauging tools are required. These should be oriented towards the accuracy potential of conven- tional measuring systems to present an option for complementary use in existing infrastructures. Such a tool could be based on crowdsourcing – a concept that has gained popularity in recent years to collect large amounts of data in very short times with the help of volunteers, sometimes also called citizen scientists. In many crowdsourcing applications, people use their fully equipped smartphones, which include high-resolution cameras, a variety of position and orientation sen- sors, powerful processors and large storage units, as measuring devices.
Elias (2021) provides a comprehensive study on the use of smartphones for photogrammetric wa- ter level measurement. The introduced Android smartphone app Open Water Levels (OWL) tar- gets the crowdsourcing of water level data on demand, e.g. at ungauged rivers during heavy pre- cipitation or during floods when data from measuring stations are not (anymore) available. Every- thing people have to do is to take pictures of a riverbank using their smartphone camera to deter- mine the prevalent water level. The app will then detect the water line in the image and transform it into a georeferenced water level measurement by intersection with an existing 3D model. Pro- vided widespread use of this app, this method enables the spatio-temporal densification of hydro- metric networks.
This article summarises the key points of the developed water-gauging tool and identifies remain- ing tasks to be solved before bringing the tool into technical use. The structure is as follows: Chapter 2 gives some basic knowledge on conventional water gauging and shows novel alterna- tive methods based on photogrammetry. Furthermore, some information on crowdsourcing is pro- vided. Chapter 3 outlines the technology behind OWL and designates the requirements for suc- cessful use. The workflow is summarised with regard to software design and implementation in chapter 4. Chapter 5 assesses the current accuracy potential of OWL by comparing water levels measured from OWL with those from a local gauging station serving as reference. Finally, chapter 6 gives an outlook on future methodological and technological improvements.
2. BASICS
This section briefly discusses the requirements of conventional measuring systems that should be taken into account when developing new measuring methods to be used in a complementary manner. Moreover, innovative photogrammetric solutions are presented that can already solve the problem of high costs in water gauging but might be less suitable in the event of flooding. In this case, crowdsourcing could be a remedy, whose concept, benefits, but also problems to be considered are explained below;
2.1. Conventional water gauging and accuracy requirements
Conventional gauging stations implement complementary measuring systems to reliably measure water levels, i.e. the distance between the water surface and the gauge zero, which is a locally defined foot point slightly below the lowest level measured over a longer period of time. In Germany, all requirements concerning gauge station installation and maintenance as well as data collection, evaluation, provision and quality assurance are defined in a national guideline called “Pegelhandbuch” (LAWA, 2018). It is defined that water levels, taken at running waters, have to be measured over 15 minutes (single values) and 24 hours (daily mean). The accuracy requirements amount to 2.5 and 1.0 cm for single values and daily mean, respectively. Consequently, novel gauging methods should target this accuracy level to serve as a complementary instrument in a hydrological measurement network.
2.2 New alternatives for water gauging
Since conventional gauging stations have to meet high standards, they are expensive in purchase, installation and maintenance. Thus, they are sparsely installed and mainly at river sections of relevance to water management. Due to increasing heavy precipitation events, there is a growing demand for alternative water level measuring methods being less expensive, widely and flexible usable and applicable during extreme events. Recently, innovative photogrammetric measure- ment techniques have been developed based on low-cost cameras to monitor rivers of different sizes. The cameras face targets that have been installed close to the water surfaces or inside the water bodies enabling the derivation of water level information, e.g. Eltner et al. (2018), Morgenschweis (2018), Lin et al. (2018), Bruinink et al. (2015). These are valuable tools to establish monitoring networks in so far ungauged catchments, but they are limited to waters where cameras and targets can be permanently and safely installed. In addition, most approaches require calm water as the water line must be marked linearly on the target for automatic detection. Both impedes the use in case of floods.
The smartphone-implemented water-gauging tool presented in this paper aims to take up this point. It provides a flexible option to measure water levels by crowdsourcing at almost any time and river targeting the accuracy requirements of conventional gauging stations of a few centimetres.
2.3 The idea behind “Crowdsourcing”
According to the definition of NOAA (2020), Citizen Science means the involvement of citizens in solving scientific questions. The level of participation ranges from making unused computing resources available to scientists supporting computationally intensive calculations, to active participation in data collection and analysis (Haklay, 2013). A well-known form of Citizen Science is the use of citizens as human sensors to collect large amounts of data in shortest times, which is referred to as crowdsourcing (Heipke, 2010). In this regard, crowdsourced bathymetry (CSB) initiatives are experiencing a significant growth in the hydrographic community. Their activities include the integration of shipborne depth measurements targeting a global seafloor mapping, e.g. Pavić et al. (2020), Mayer et al. (2018). Necessary CSB guidelines are defined and maintained by the CSB working group (CSBWG) of IHO.
With the increasing functionality of smartphones, crowdsourcing is becoming more and more popular in applied sciences. Examples are collecting lots of training data for machine learning, e.g. Ahn and Dabbish (2004), improving navigation services, e.g. Wright (2021), mapping, e.g. Sarker et al. (2021), or data assessment, e.g. Strobel et al. (2019), Etter and Strobel (2018). This makes crowdsourcing particularly interesting for smartphone-based water level measurement because the required measurement tool, the smartphone, is largely owned by the people, which makes water gauging possible at the places where the data is needed. Responsibilities always lie with the experts. Thus, they should send instructions and warnings regarding data collection via a specific app to volunteers who might be close to areas of interests (AOIs). A dedicated app also helps to remedy the well-known crowdsourcing problem of limited quality control and data hetero- geneity (Burghardt et al., 2018) providing explicit user instructions for correct data acquisition and running a preliminary data review regarding expert-defined constraints. For example, the measurement results could be checked for plausibility by including location information or by comparison with data sets from other users captured at one location.
3. METHODOLOGY
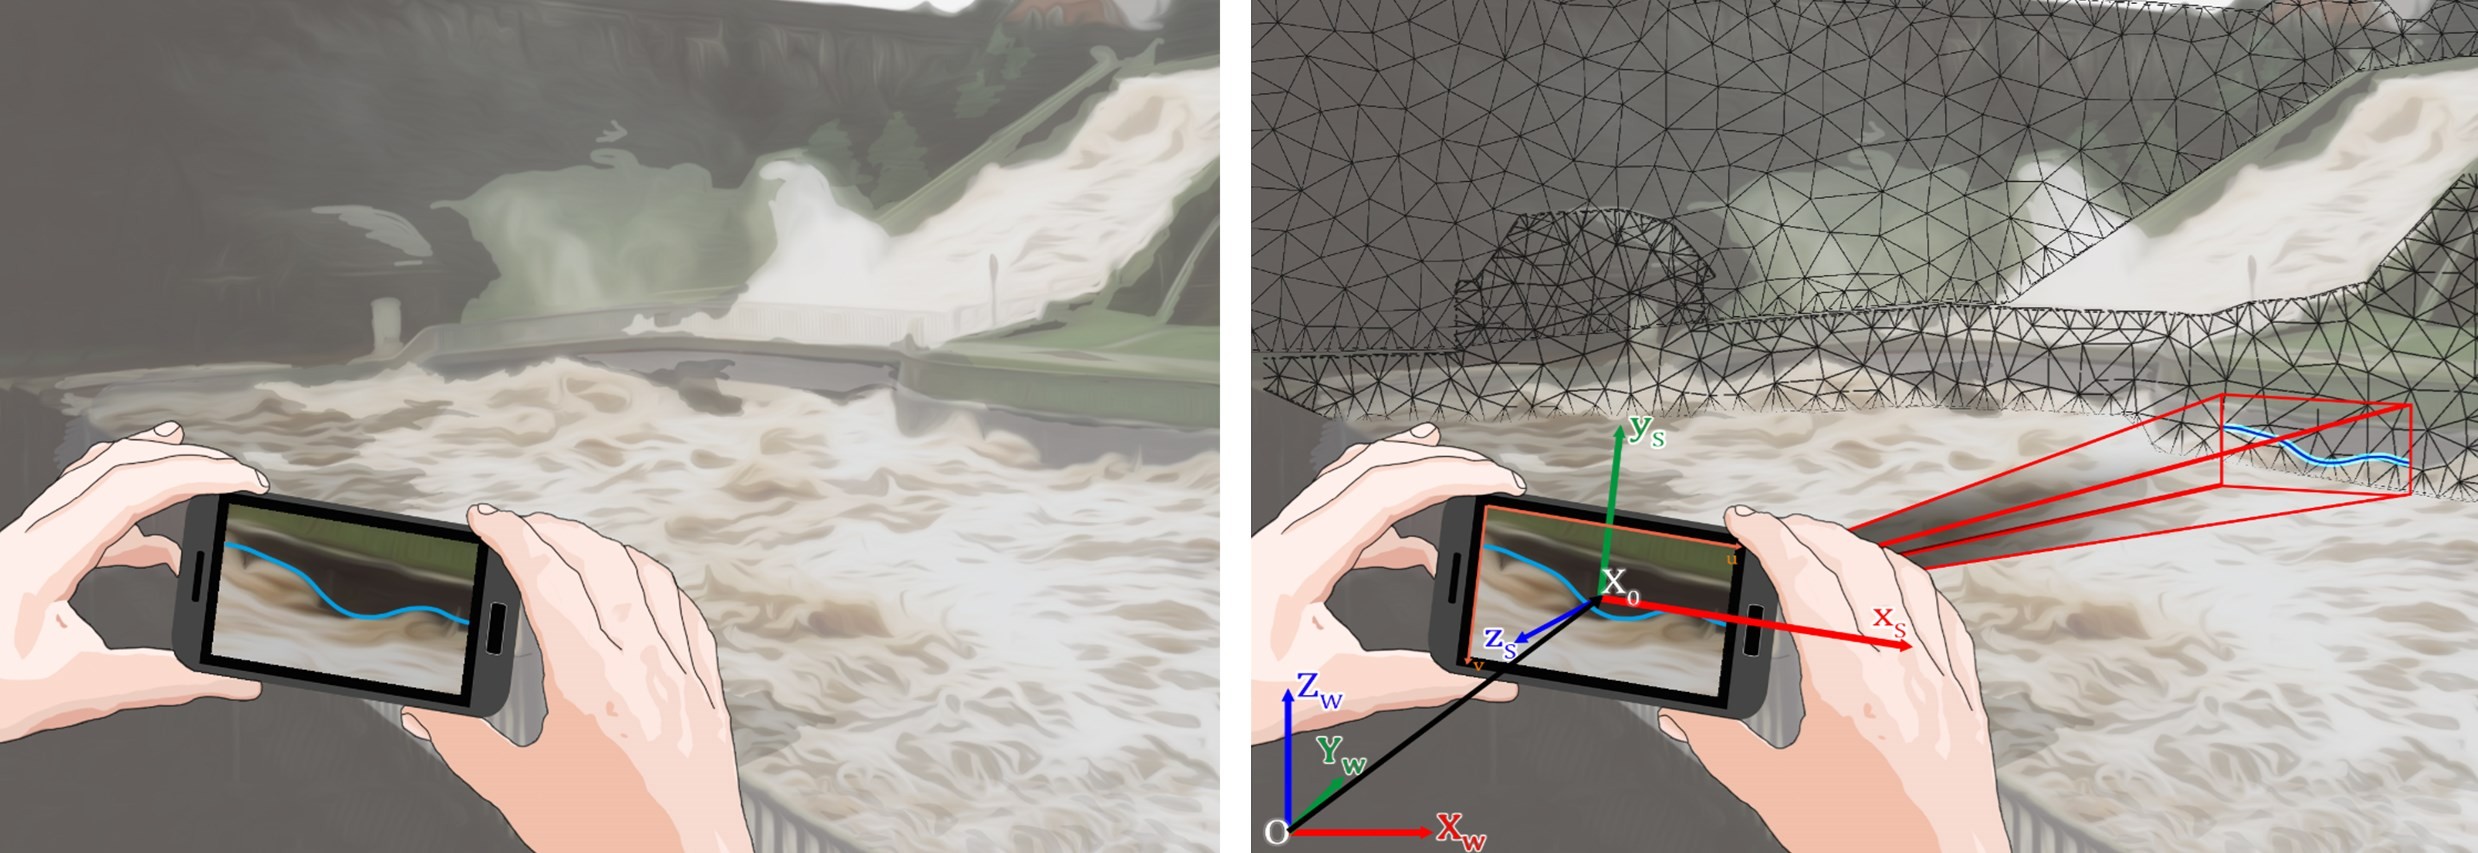
The development of a smartphone-implemented photogrammetric water-gauging tool involves two problems to be solved. First, an image analysis method is needed to measure water lines in handheld smartphone images without imposing specific requirements on the water body and to the user, e.g. pre-installed targets or the need for a specific smartphone or additional equipment. Second, a method is needed to transfer the image-measured 2D water line into 3D object space to derive georeferenced metric water level information. The principle is shown in Figure 1.
3.1. 2D water line detection
As described by Kröhnert and Meichsner (2017), there are various methods in the literature to detect and segment water surfaces in images. However, most are neither implementable on smartphones nor applicable to running waters. Therefore, the authors present a semi-automatic solution to measure water lines in close-range images based on the extension of the 2D image space by the dimension of time.
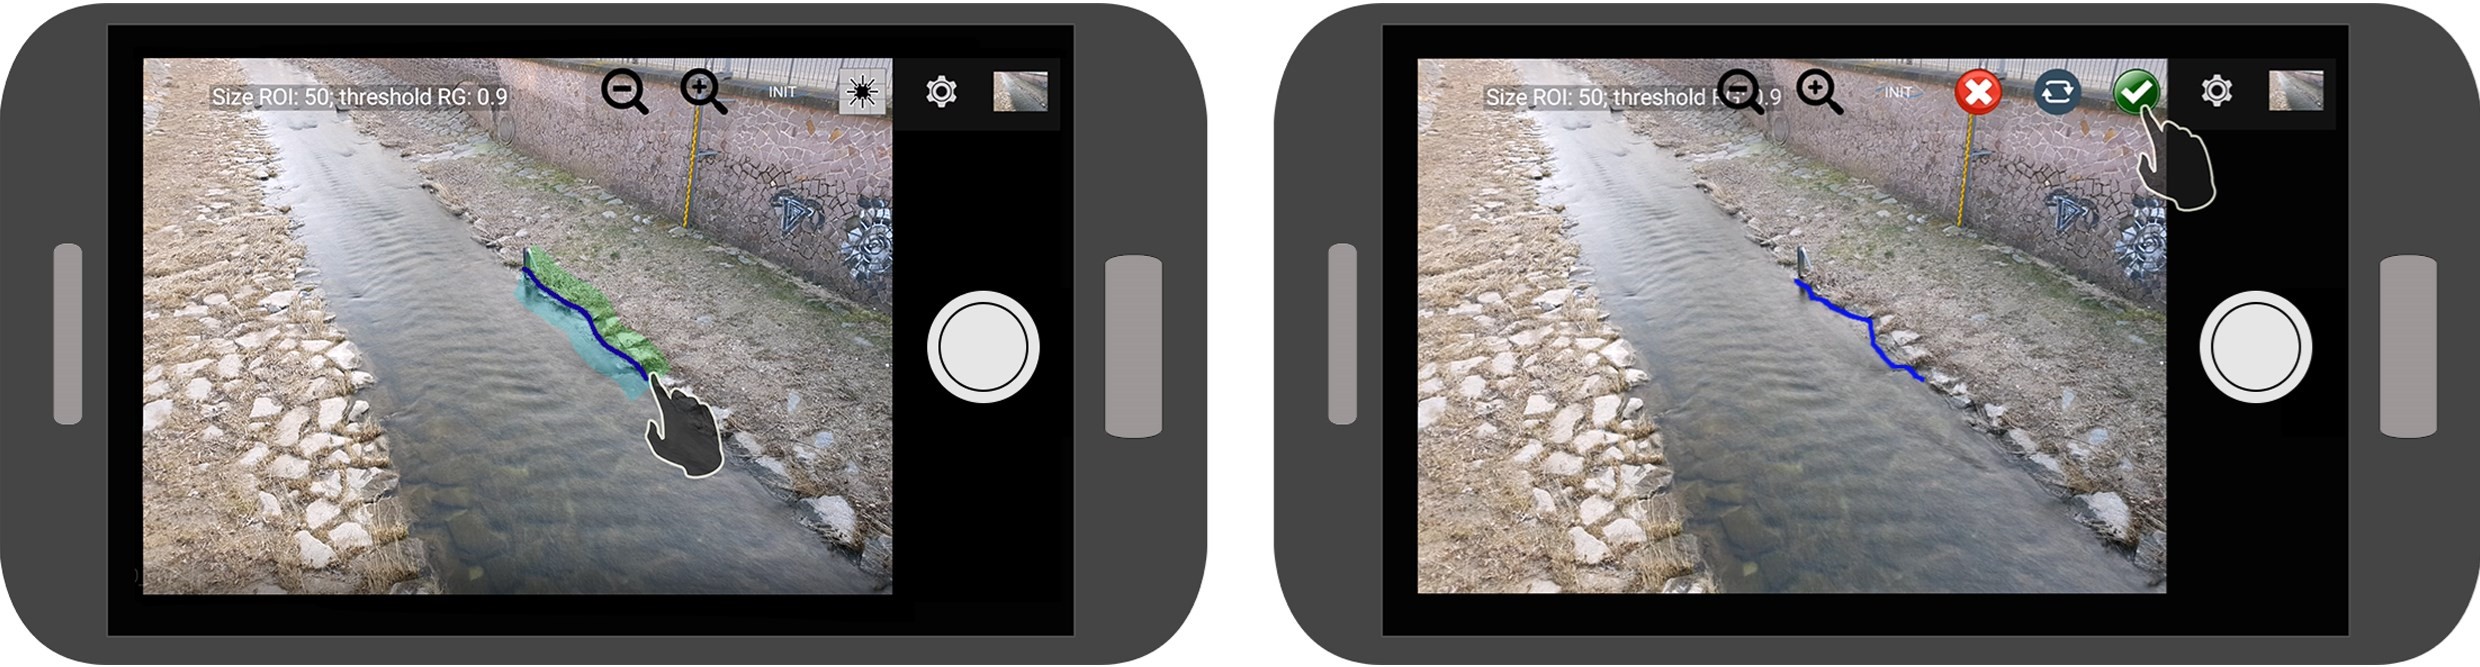
Instead of a single image, the user takes a short time-lapse sequence targeting the riverbank where the water level is to be measured (Figure 1, left). The images are co-registered to calculate a spatio-temporal texture of the scenery, which outlines areas being rigid or in motion within the time-lapse interval. Herein, waves on the surface of running or stationary water bodies will usually create a distinct spatio-temporal texture. This information enables the segmentation of dynamic image content, i.e. running water, from static image areas, i.e. the bank area. The user is shown an average image of the time-lapse sequence that allows for a good visual assessment of the water line. S/he is asked to roughly trace the water line on the smartphone display to limit the area where the water line has to be finally measured (Figure 2, left). The traced line is translated into the camera image and the variability of the adjacent image areas is analysed. A region growing approach is used to find clusters of static and dynamic image content whose boundary approximate the water line. Potential outliers are removed by a locally weighted regression. The final water line is determined by a spline fit allowing for subpixel resolution.
Note that the coordinates of the 2D water line are measured in relation to the image coordinates of the master image. This is the first image of the time-lapse sequence to which the remaining images are co-registered for spatio-temporal texture calculation. OWL displays the calculated 2D water line to be reviewed by the user (Figure 2, right). If the water line could be reliably detected, it can be released for further processing. If the measurement must be rejected, it can be repeated or the coarsely user-selected water line can be accepted.
Metadata acquisition
When starting the time-lapse sequence acquisition, parameters about the camera, e.g. focal length, image format or pixel size, as well as geographic information about the smartphone cam- era position and rotation measured by built-in smartphone sensors are acquired and stored as metadata. This data is needed to approximately describe the imaging geometry, which is key for transferring the image-measured water line into object space.
3.2. Water level determination
The initial method for interpreting water level information from smartphone-measured water lines has been introduced by Elias et al. (2019). In the following, key points and subsequently implemented optimisations are outlined.
Requirements
The projection of the 2D water line into object space requires, on the one hand, precise knowledge about the interior and exterior orientation parameters (IOP/EOP) of the master image and, on the other hand, 3D reference data to derive metric information about the water level (Figure 1, right). This 3D data can be a simple point cloud of the environment around the extracted water line, or a digital surface model (DSM) stored in a geo information system contain- ing geographic and colour information. Such data can be quickly generated via Structure-from- Motion (SfM) tools, e.g. using images from Google Street View (Bruno and Roncella, 2019) or Google River View (Bowles and Babcock, 2015). In addition to this, images might be captured from UAVs quickly and cost-effectively at relevant locations along rivers that should be monitored by citizen scientists. Another option is the use of unoccupied water vehicles (UWVs), which are equipped with numerous measurement systems to map water and shore areas in large scales within short times, e.g. Eltner et al. (2020), Bertalan et al. (2020), Sardemann et al. (2018).
Image-to-geometry registration
It is well known that the accuracy and reliability of smartphone sensors is not comparable to professional geodetic instruments, impeding a direct measurement of smartphone cameras EOP. Merry and Bettinger (2019) report lateral position accuracies of several meters when measured by a standard smartphone-implemented global navigation satellite system (GNSS). Although smartphone sensor fusion enables the measurement of camera rotation parameters, Elias and Maas (2020) report serious errors of more than 90 degrees when measuring the azimuth, i.e. compass angle, due to magnetic perturbations. Besides EOP-related issues, determining the IOP requires a rigorous camera calibration. This, however, contradicts the flexible usability of the tool and its applicability for crowdsourcing due to required expert knowledge. Furthermore, Elias et al. (2020) and Chikatsu and Takahashi (2009) show that the geometry of smartphone cameras is highly susceptible to self-heating and physical forces, which would make any pre-calibration invalid.
Both, IOP and EOP of the master image during the actual measurement can be determined simultaneously by an on-the-job calibration, e.g. Luhmann et al. (2015). In the case of OWL, this is done without the need for any user input by registering the camera image with a synthetic, photorealistic image of the 3D reference data. This synthetic image is rendered from colour texture information of the 3D data, using the smartphone-measured approximations of the IOP and EOP to replicate the perspective of the camera image. The fully automatic image-to-image registration of the master image to the synthetic image storing well-distributed 3D object information in different depths based on the camera position enables the determination of the IOP and EOP by spatial resection.
The original approach of Elias et al. (2019) uses interest operator point features to perform camera-to-synthetic image registration, which works well in most conditions but likely fails when both images show too different perspectives or colour textures. Interest operator point features are usually characterised by gradients, stored in feature vectors, describing directional changes of grey value intensities between neighbouring pixels. Features are assumed similar in two images when the distances of the corresponding feature vectors are minimal. When perspective and colour texture of both images are too different, this matching criterion is difficult to accomplish. Perspective problems usually result from inaccuracies in the smartphone-estimated EOP. Colour texture problems must be considered when both images show different vegetation or illumination.
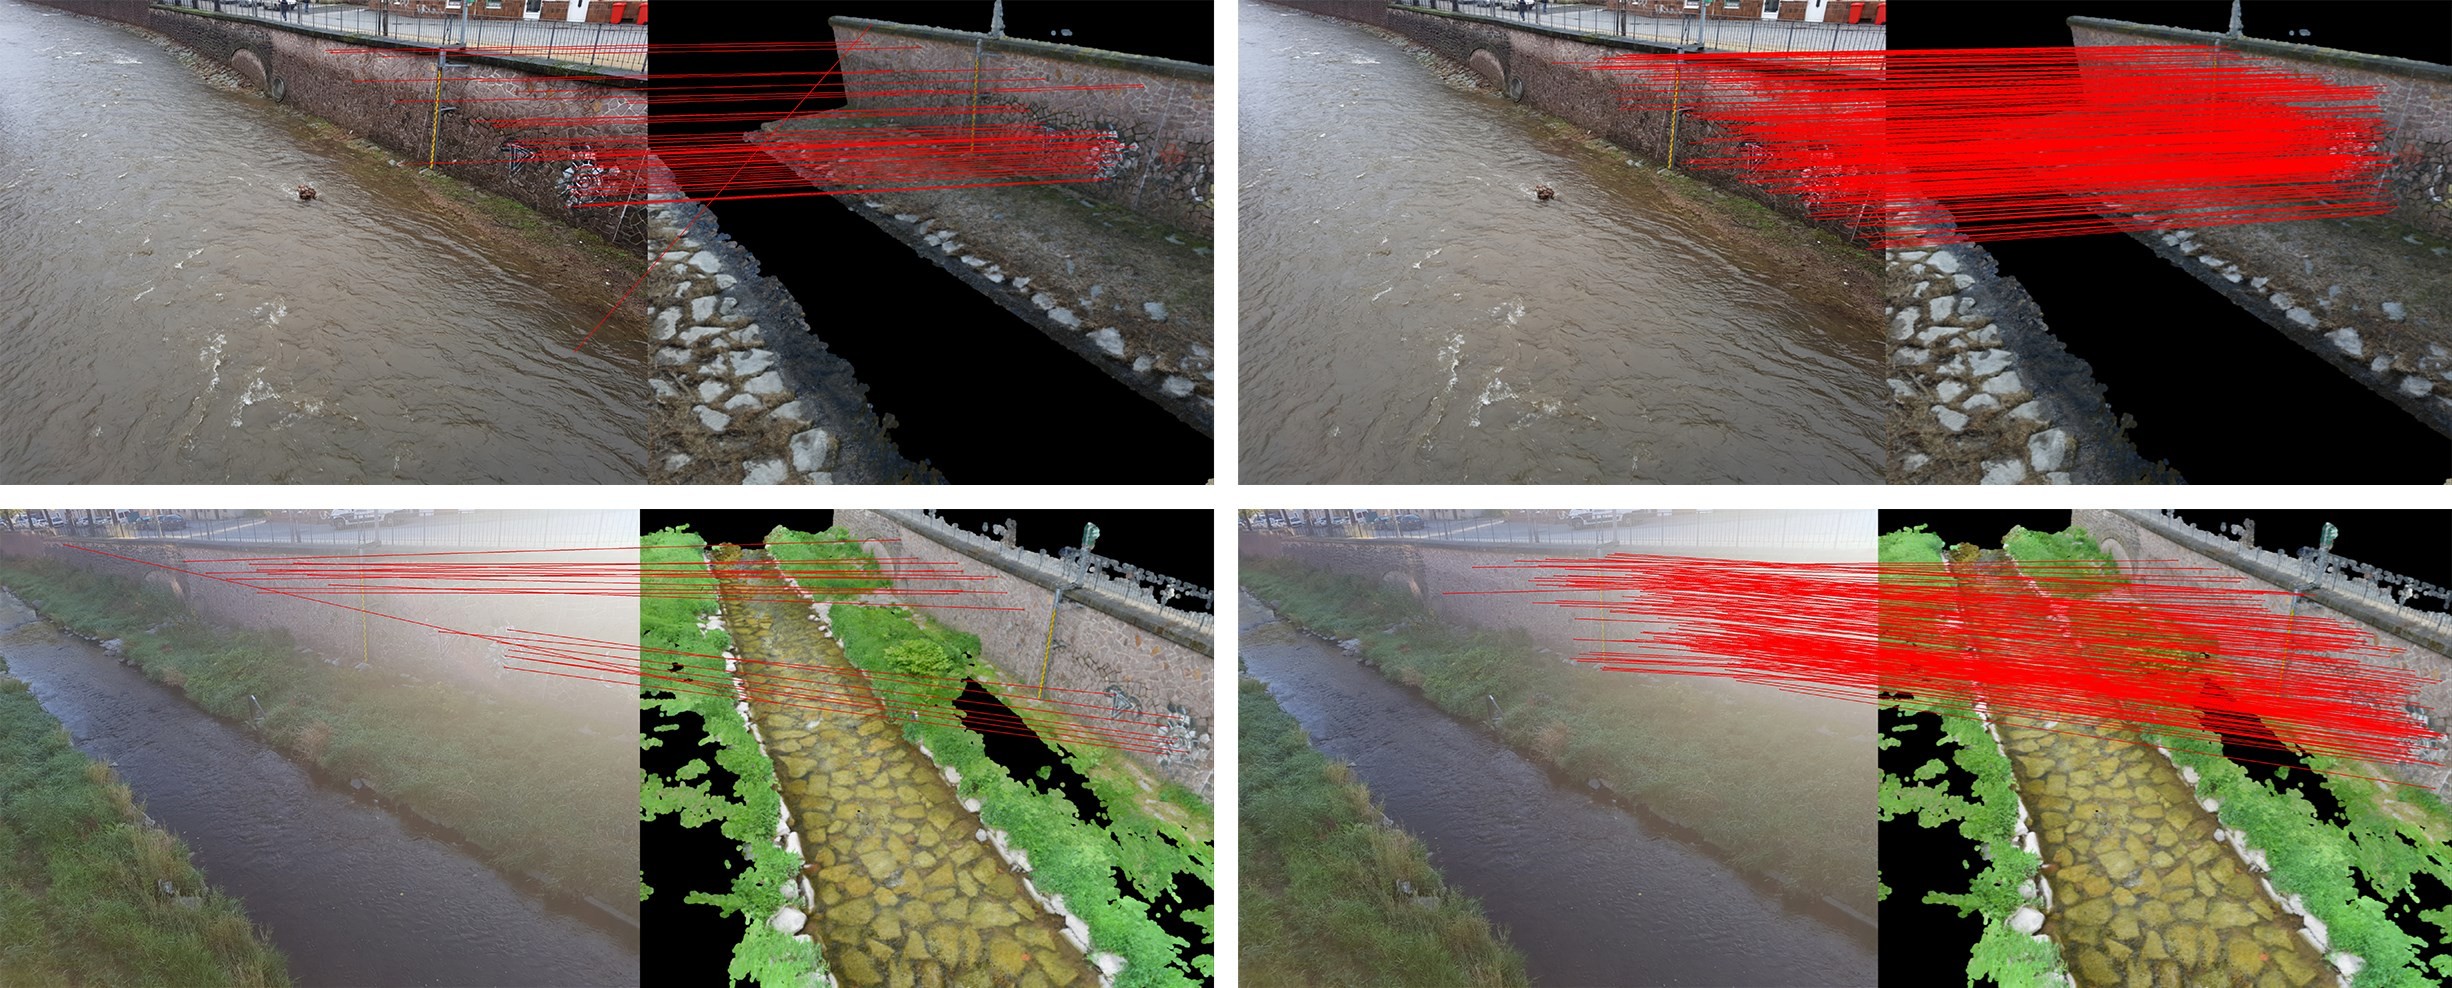
New feature matching approaches based on deep learning are able to learn and recognise complex image semantics such as specific object structures. These learned features show impressive results when matching images captured under highly different perspectives or showing different colour textures. Some examples are DISK (Tyszkiewicz et al., 2020), R2D2 (Revaud et al., 2019) and D2Net (Maiwald and Maas, 2021, Dusmanu et al., 2019), with the latter currently implemented in OWL. Elias (2021) demonstrates the benefit of using learned features over interest operator point features in camera-to-synthetic image registration considering the aforementioned problems. An example is given in Figure 3 where camera and synthetic image show different colour textures due to high water level (top) and illumination (bottom). Obviously, the use of learned features outperforms the use of interest operator point features.
Water level determination
After calculating IOP and EOP, the geometric transformation between the master image and the 3D reference data can be established. The 2D water line is projected pixel by pixel onto the 3D data to obtain a 3D water line through intersection points. The final water level is calculated from the median level and georeferenced in the super-ordinate coordinate system of the 3D data.
4. SOFTWARE DESIGN AND IMPLEMENTATION
According to Nielsen (2006), crowdsourcing tasks should be kept simple and avoid technical, logistical and intellectual barriers to activate users from different backgrounds and to reduce errors when solving the assigned tasks. Providing suitable software can make a significant contribution to this. OWL aims to overcome these barriers using an appropriate system- and application design, which will be discussed in more detail below.
To reduce technical barriers, the workflow, outlined in Chapter 3 and visualised in Figure 4, has been implemented using a three-tier client-server architecture, e.g. Eckerson (1995), to distribute processes to dedicated systems. These are:
- Client tier (smartphone app OWL)
- Data-server tier (database)
- Application-server tier (remote workstation)
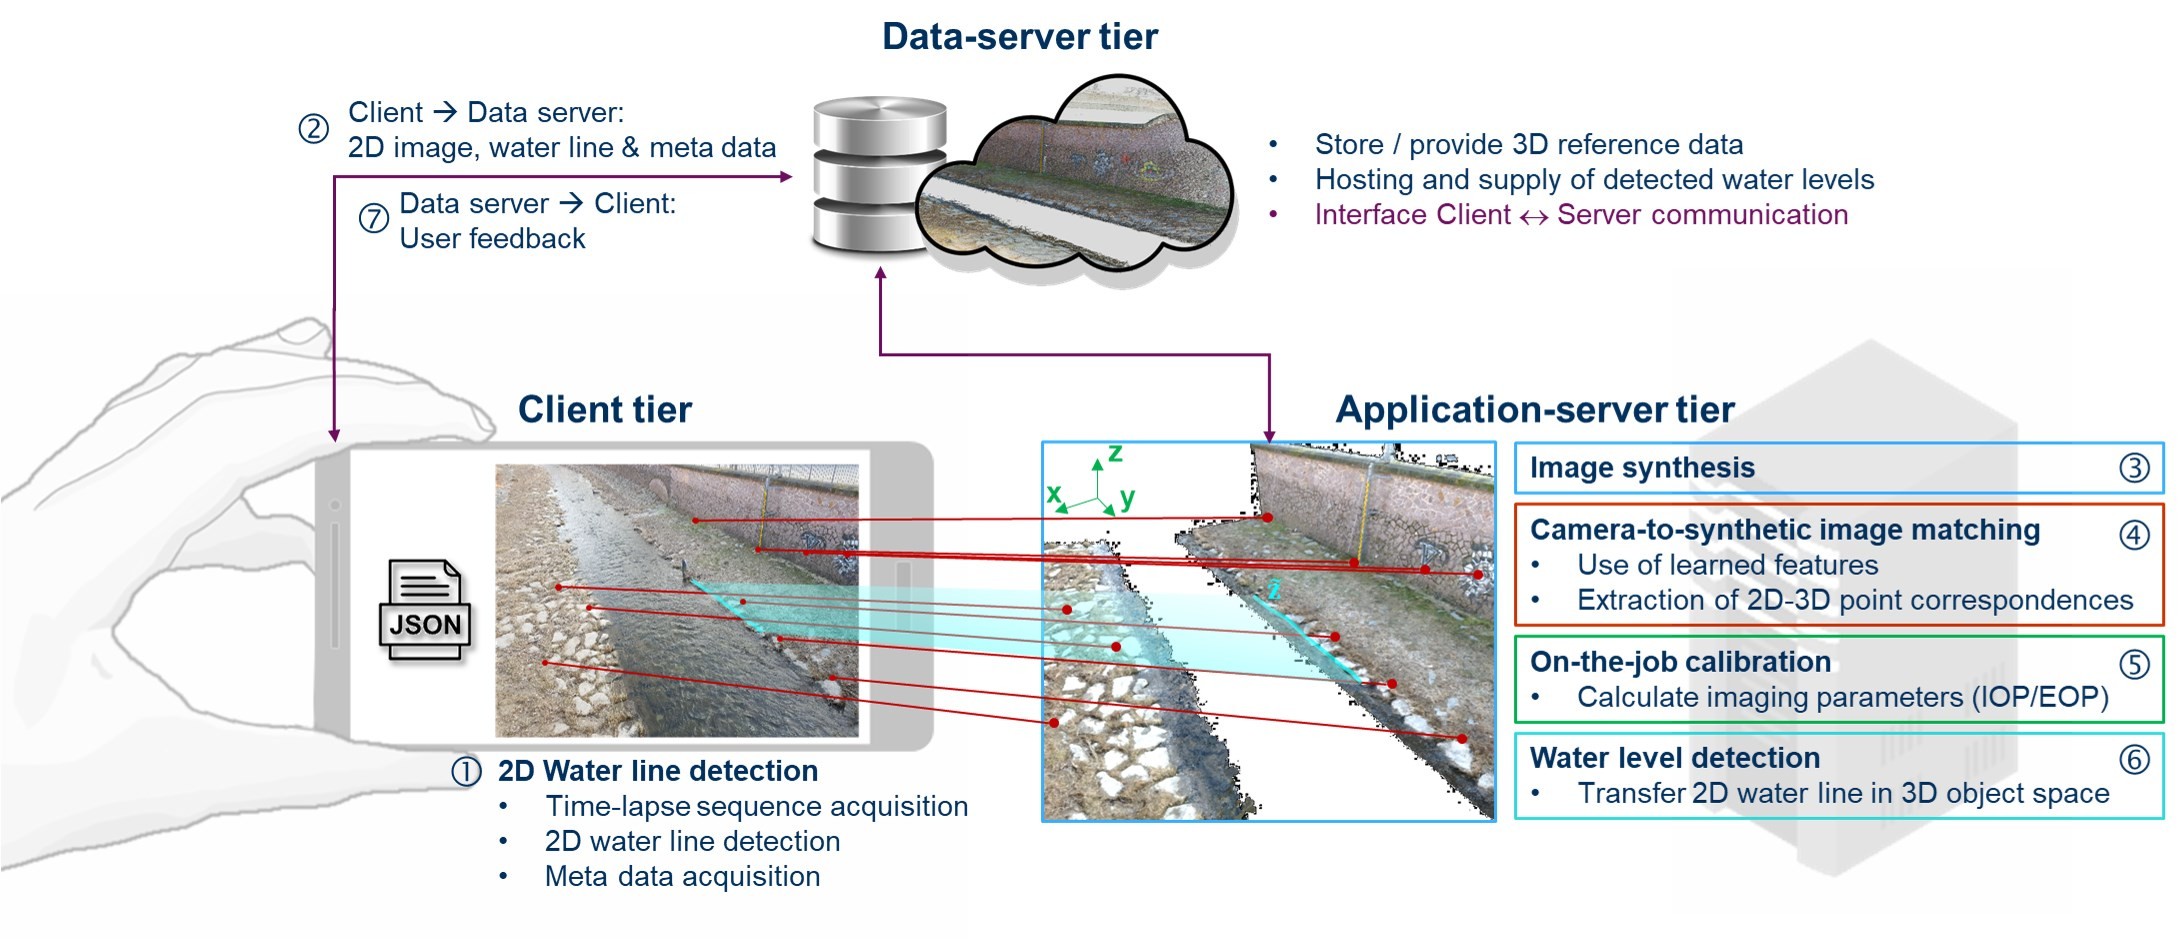
The user only interacts within the client tier using a provided front end, here in the form of the smartphone app OWL. This app should be performant and therefore only perform lightweight tasks, i.e. time-lapse sequence acquisition, 2D water line processing and metadata collection from smartphone sensors (see Chapter 3.1). Furthermore, the app is designed according to the model-view-presenter principle to separate the user interface from the business logic, so that the smartphone remains responsive at all times, e.g. Muntenescu (2016). This helps to prevent the exclusion of potential user groups using less powerful devices. Once the water line has been extracted, its image coordinates, the master image and the metadata are send to the data-server tier for further processing. The app can be closed and the user will receive a notification when the water level was determined.
The data-server tier establishes the communication between the client and the application-server instance. Once it receives data from a client, it checks if all requirements are fulfilled, i.e. availability of 3D reference data and plausibility of IOP/EOP approximations, and forwards the input data to the application server. If the data has been processed, the data server receives and stores the result and notifies the user.
All computing and memory-heavy processes are outsourced to a remote workstation owned by the application-server tier, i.e. image synthesis from, on-the-job calibration and water level determination (see Chapter 3.2).
In order to reduce intellectual barriers, the app uses the look and feel of a standard camera app as it is based on the open source framework Open Camera (Harman, 2022). Furthermore, the app aims to be auto-plausible, guides the user systematically through the entire data acquisition process and reduces textual communication as much as possible using icons instead of texts. The user interface can be seen in Figure 2.
To reduce logistical barriers, the app implements a map on which the user can find locations where the water-gauging app can be applied. At these locations, 3D reference data has been collected and linked to OWLs database. A notification function, which needs to be implemented, would enable experts to send messages to local user groups when current water level information is needed at the specific locations.
More details on software design and requirements are given in Elias (2021) and Elias et al. (2019).
Implementation status
All components of OWL, i.e. smartphone app, data server with communication interface and application server, are available in Beta version. The app was tested on several smartphones from different manufacturers with Android operating system versions 7.1 to 9.0. Data and application servers are currently set up on a dedicated computer. Before a final release, unit tests must inevitably be carried out to test the individual components, using or simulating various devices, as well as integration tests to verify the interaction of all components. Furthermore, the system has to be scaled up using, for example, professional cloud computing services and data management systems.
5. EVALUATION OF THE METHODS AND ACCURACY ASSESSMENT
OWL has been evaluated by comparing single value measurements of a conventional water gauging station serving as ground truth to water level measurements made by OWL. The validation tests were carried out at the river Weißeritz in Dresden-Plauen, Germany, observing the riverbank from a bridge at a distance of 20 metres (e.g. Figure 3). 3D reference data were available in the form of a 3D point cloud generated from SfM and georeferenced with GNSS. The point cloud has a resolution of about 25.000 pts/m² with a single point accuracy of approximately 1 cm.
The accuracy assessment is shown in detail in Elias et al. (2019). To sum up, 20 observations were carried out at different days and times and an overall standard deviation of 1.9 cm to conventional measurements has been achieved evaluating 17 of 20 measurements. In three cases, no water level could be measured. This was due to the generation of the synthetic image using poor EOP estimates from smartphone sensors, impeding the alignment to the camera image by interest operator point features as both images showed highly different perspectives.
In this paper, an updated assessment of accuracy and reliability is presented reprocessing the original observations using the new version of OWL that implements learning-based feature matching via D2Net. Again, the overall standard deviation amounts to 1.9 cm, but including 19 of 20 matches. In one case, camera and synthetic image do not show any matching image content. In summary, the reliability of OWL could be increased using learned features while maintaining high accuracy.
Factors on accuracy and reliability
Three main factors on accuracy and reliability can be identified: the quality of the 3D reference data, the used smartphone camera and sensor technology as well as the image setting.
OWL requires high-resolution 3D reference data, which should well represent the prevailing map- ping situation. The data needs to be precisely georeferenced to enable an automatic assignment with the georeferenced image data from the smartphone and to measure water levels in a com- mon super-ordinate coordinate system. In case of major structural changes near the water body after measuring the 3D reference data, it is recommended to update the 3D reference data to have sufficient homologous image content available for on-the-job calibration.
Another factor is the quality of the smartphone camera images. The higher the resolution of the image, the higher the resolution of the 2D water line. Furthermore, high-resolution and low-noise images benefit feature detection and matching when calibrating the camera. In addition to the camera, the sensors used to approximate the EOP play a decisive role, as erroneous measure- ments strongly affect the reliability of the application. A remedy is the implementation of a map that enables the user to review and, if necessary, interactively correct the sensor-measured EOP.
Finally, a decisive factor is the selection of the image setting, i.e. image perspective and camera- to-object distance. This and the camera quality have significant impact on the 2D water line detection as well as feature density in the implemented on-the-job calibration. It is important to choose a small distance to the water line, but still ensure that sufficient background information needed for camera-to-synthetic image matching is available. A corresponding recommendation should be provided to the user via the app.
6. CONCLUSION AND FUTURE WORK
This paper presents a novel photogrammetric smartphone-implemented water-gauging tool, usable by non-experts and applicable for crowdsourcing. This tool achieves accuracies similar to conventional gauging stations and demonstrates its potential for complementary use in hydrometric measurement networks.
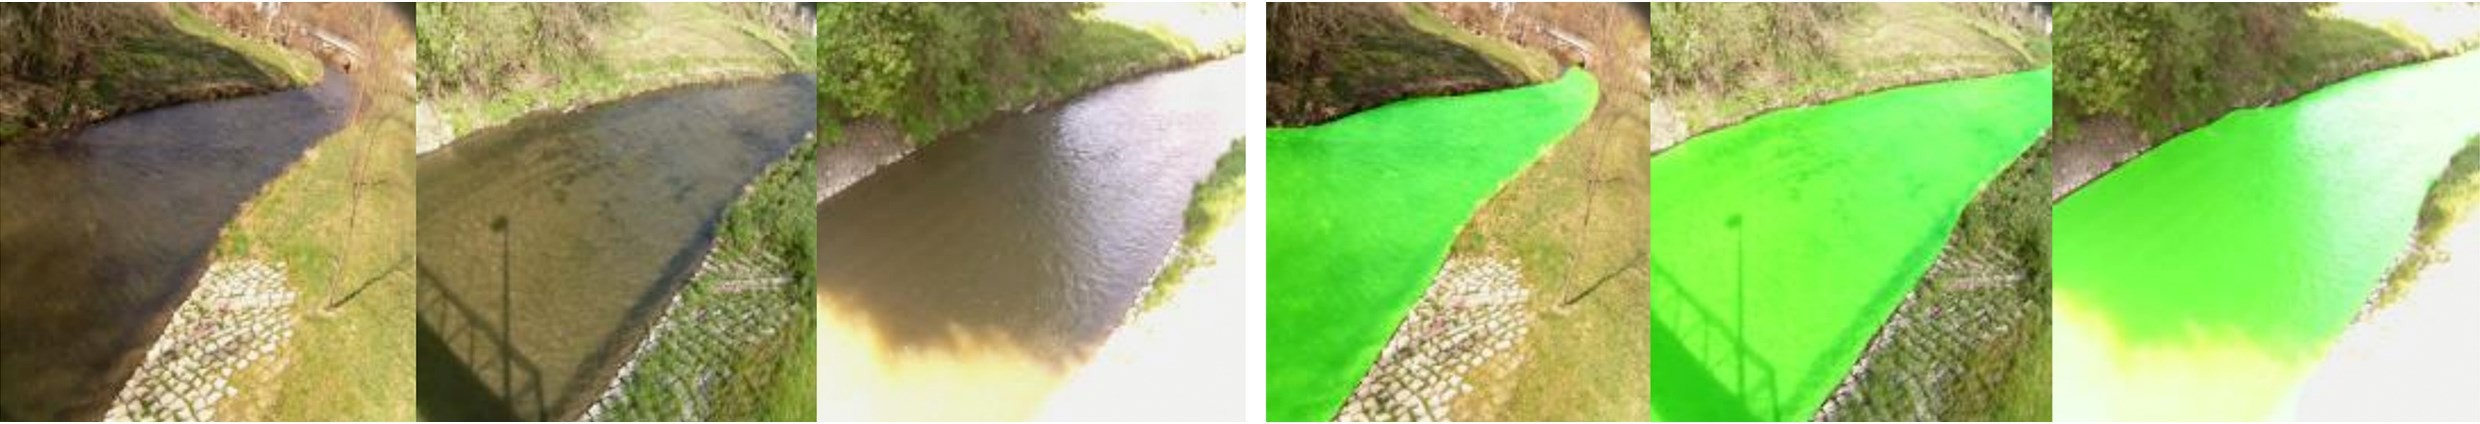
The required user interaction is low and is essentially limited to image acquisition and the delimitation of the AOI for 2D water line detection, which works well in most conditions. Sometimes, problems can occur when the image is over- or underexposed in the bank area. Recently, however, novel routines have been published to recognise and segment water surfaces in images via deep learning (see Figure 5 by Akiyama et al., 2020). Assuming a model being trained on various images showing running water surfaces, this approach might, on the one hand, solve the exposure problem and, on the other hand, further reduce the effort for water line detection using a single image of the riverbank instead of an image sequence. The image processing could be done completely online, posing even less demands on the used smartphone and the user.
In order to translate the water line into the object space, geo-referenced 3D reference data with colour information are required. These can be easily generated using, for example, images from UAVs equipped with high-precision GNSS receivers allowing the generation of DSMs with cm- level accuracies using SfM tools, e.g. Forlani et al. (2018). The calibration of the measuring system takes place automatically at the time of the measurement requiring approximate position and rotation information of the device from built-in sensors. Problems are mainly to be expected when this information is measured incorrectly.
However, the development of smartphone technology and image processing is progressing at an incredible pace. With regard to the problem of erroneous position determination using built-in GNSS, the increasing integration of innovative dual-band receivers and the possibility of accessing and processing raw GNSS data promise great improvements in the near future. Although high -precision measurements using smartphone GNSS with accuracies of a few centimetres is an on- going research topic, e.g. Wanninger and Heßelbarth (2020), it is already possible to get position values with accuracies of a few decimetres, e.g. Zangenehnejad and Gao (2021), Aggrey et al. (2020), especially when fusing with new 5G location services, e.g. Dwivedi et al. (2020). This would already significantly improve the registration of camera and synthetic image and thus on- the-job calibration.
If the pending developments described briefly in chapter 4 and in detail in Elias (2021) are carried out for a final release, OWL should be advertised for crowdsourcing and used for a large-scale test before including in existing hydrometric networks. Furthermore, it could complement similarly designed applications, such as the Europe-wide successful CrowdWater project (Strobel et al., 2019, Etter and Strobel, 2018).
7. REFERENCES
- Aggrey, J., Bisnath, S., Naciri, N., Shinghal, G., and Yang, S. (2020). “Multi-GNSS precise point positioning with next-generation smartphone measurements”, Journal of Spatial Science, 65(1), pp. 79–98.
- Akiyama, T.S., Junior, J.M., Gonçalves, W.N., Bressan, P.O., Eltner, A., Binder, F. and Singer, T. (2020). “Deep learning applied to water segmentation”, Int. Arch. Photogramm. Remote Sens. Spatial Inf. Sci., XLIII-B2-2020, pp. 1189–1193.
- Bertalan, L., Sardemann, H., Mader, D., Szopos, N.M., Nagy, B. and Eltner, A. (2020). “Geomorphological and hydrological characterization of a meandering river by UAV and UWV applications”, EGU General Assembly 2020, p. EGU2020-18069.
- Bowles, N. (2017). This startup wants to make a Google Street View for rivers, lakes, and bays, Vice, viewed 20 January 2022, https://bit.ly/3tLnFtM.
- Bruinink, M., Chandarr, A., Rudinac, M., van Overloop, P.J. and Jonker, P. (2015). “Portable, automatic water level estimation using mobile phone cameras”, 2015 14th IAPR International Conference on Machine Vision Applications (MVA), pp. 426–429.
- Bruno, N. and Roncella, R. (2019). “Accuracy assessment of 3D models generated from Google street view imagery”, Int. Arch. Photogramm. Remote Sens. Spatial Inf. Sci., XLII-2/W9, pp. 181–188.
- Burghardt, D., Nejdl, W., Schiewe J. and Sester, M. (2018). “Volunteered Geographic Information: Interpretation, Visualisation and Social Computing (VGIscience)”, Proceedings of the ICA, 1, pp. 1–5.
- Chikatsu, H. and Takahashi, Y. (2009). “Comparative evaluation of consumer grade cameras and mobile phone cameras for close range photogrammetry”, Proc. SPIE 7447, Videometrics, Range Imaging, and Applications X, 74470H, pp. 130–141.
- Dwivedi, S., Nygren, J., Munier, F. and Gunnarsson, F. (2020). 5G positioning: What you need to know, ericsson.com, viewed 24 January 2022, https://bit.ly/3GYjgXR.
- Dusmanu, M., Rocco, I., Pajdla,T., Pollefeys, M., Sivic, J., Torii, A. and Sattler, T. (2019). “D2-Net: A Trainable CNN for Joint Detection and Description of Local Features”, arXiv Preprint, 1905.03561.
- Eckerson, W. W. (1995). “Three Tier Client/Server Architecture: Achieving Scalability, Performance, and Efficiency in Client Server Applications”, Open Information Systems, 3, pp. 46–50.
- Elias, M. (2021). “On the use of smartphones as novel photogrammetric water gauging instruments. Developing tools for crowdsourcing water levels”. PhD thesis. Technische Universität Dresden.
- Elias, M., Eltner, A., Liebold, F. and Maas, H-G. (2020). “Assessing the Influence of Temperature Changes on the Geometric Stability of Smartphone- and Raspberry Pi Cameras”, Sensors, 20(3), p. 643.
- Elias, M. and Maas, H.-G. (2020). “Investigation on multi-sensor fusion strategies for improved orientation determination in mobile phone imaging applications”, ISPRS Ann. Photogramm. Remote Sens. Spatial Inf. Sci., V-1-2020, pp. 181–1870.
- Elias, M., Kehl, C. and Schneider, D. (2019). “Photogrammetric water level determination using smartphone technology”, The Photogrammetric Record, 34(166), pp. 198–223.
- Eltner, A., Sardemann, H. and Grundmann, J. (2020). “Technical Note: Flow velocity and discharge measurement in rivers using terrestrial and unmanned-aerial-vehicle imagery”, Hydrology and Earth System Sciences, 24(3), pp. 1429–1445.
- Eltner, A., Elias, M., Sardemann, H. and Spieler, D. (2018). Automatic image-based water stage measurement for long-term observations in ungauged catchments. Water Resources Research, 54, pp. 10,362– 10,371.
- Etter, S. and Strobl. B. (2018). CrowdWater, viewed 10 January 2022, https://crowdwater.ch/de/home/.
- Forlani, G., Dall’Asta, E., Diotri, F., Morra di Cella, U., Roncella, R., and Santise, M. (2018). “Quality Assessment of DSMs Produced from UAV Flights Georeferenced with On-Board RTK Positioning“, Remote Sensing, 10(2), p. 311.
- Haklay, M. (2013), Crowdsourcing Geographic Knowledge: Volunteered Geographic Information (VGI) in Theory and Practice. Springer, NL.
- Harman, M. (2022). Open Camera – Camera app for Android, Version 1.38, Soureforge, viewed 21 January 2022, https://sourceforge.net/projects/opencamera/.
- Heipke, C. (2010). “Crowdsourcing geospatial data”, ISPRS Journal of Photogrammetry and Remote Sensing, 65(6), pp. 550–557.
- International Hydrographic Organization (IHO, 2022). Importance of Hydrography – Definition of Hydrography, viewed 30 March 2022, https://iho.int/en/importance-of-hydrography.
- Kirchner, J.W. (2006). “Getting the right answers for the right reasons: Linking measurements, analyses, and models to advance the science of hydrology”, Water Resources Research, 42, p. W03S04.
- Kröhnert, M. and Meichsner, R. (2017). “Segmentation of environmental time lapse image sequences for the determination of shore lines captured by hand-held smartphone cameras”, ISPRS Ann. Photogramm. Remote Sens. Spatial Inf. Sci., IV-2/W4, pp. 1–8.
- LAWA (2018). Leitfaden zur Hydrometrie des Bundes und der Länder – Pegelhandbuch, Bund/ Länderarbeitsgemeinschaft Wasser (LAWA), Ministerium für Umwelt, Klima und Energiewirtschaft Baden-Württemberg, viewed 10 January 2022, https://bit.ly/3JYZLjM.
- Lehmann, J., Coumou, D. and Frieler, K. (2015). “Increased record-breaking precipitation events under global warming”, Climatic Change, 132(4), pp. 501–515.
- Lin, Y.-T., Lin, Y.-C. and Han, J.-Y. (2018). “Automatic water-level detection using single camera images with varied poses”, Measurement, 127, pp. 167–174.
- Luhmann, T., Fraser, C. and Maas, H.-G. (2015). “Sensor modelling and camera calibration for close-range photogrammetry”, ISPRS Journal of Photogrammetry and Remote Sensing, 115, pp. 37–46.
- Maiwald, F. and Maas, H.-G. (2021). “An automatic workflow for orientation of historical images with large radiometric and geometric differences”, The Photogrammetric Record, 36(174), pp. 77–103.
- Mayer, L., Jakobsson, M., Allen, G., Dorschel, B., Falconer, R., Ferrini, V., Lamarche, G., Snaith, H. and Weatherall, P. (2018). “The Nippon Foundation—GEBCO Seabed 2030 Project: The Quest to See the World’s Oceans Completely Mapped by 2030”, Geosciences, 8(2), p. 36.
- Merry, K. and Bettinger, P. (2019). “Smartphone GPS accuracy study in an urban environment”, PLOS ONE, 14(7), p. e0219890.
- Morgenschweis, G. (2018), Hydrometrie: Theorie und Praxis der Durchflussmessung in offenen Gerinnen. 2nd ed., Springer, DE.
- Mueller, E.N. and Pfister, A. (2011). “Increasing occurrence of high-intensity rainstorm events relevant for the generation of soil erosion in a temperate lowland region in Central Europe”, Journal of Hydrology, 411(3–4), pp. 266–278.
- Muntenescu, F. (2016). Android Architecture Patterns Part 2: Model-View-Presenter, upday, viewed 21 January 2022, https://bit.ly/3AhjaZ2.
- National Oceanic and Atmospheric Administration (NOAA, 2020). Citizen science and crowdsourcing, NOAA Office of Education, viewed 10 January 2022, https://bit.ly/3rmQv0L.
- Nielsen, J. (2006). The 90-9-1 Rule for Participation Inequality in Social Media and Online Communities, Nielsen Norman Group, viewed 21 January 2022, https://bit.ly/3KvNnZ3.
- Pavić I., Mišković J., Kasum J. and Alujević D. (2020). “Analysis of Crowdsourced Bathymetry Concept and It’s Potential Implications on Safety of Navigation”, TransNav, 14(3), pp. 681–686.
- Revaud, J., Weinzaepfel, P., De Souza, C., Pion, N., Csurka, G., Cabon, Y. and Humenberger, M. (2019). “R2D2: repeatable and reliable detector and descriptor”, arXiv Preprint, 1906.06195.
- Sardemann, H., Eltner, A. and Maas, H.-G. (2018). “Acquisition of geometrical data of small rivers with an unmanned water vehicle”, Int. Arch. Photogramm. Remote Sens. Spatial Inf. Sci., XLII-2, pp. 1023–1027.
- Sarker, M.R.A., Hassanuzzaman, M., Biswas, P., Dadon, S.H., Imam, T. and Rahman, T. (2021): „An Efficient Surface Map Creation and Tracking Using Smartphone Sensors and Crowdsourcing“, Sensors, 21, p. 6969.
- Spilcker, A. (2021). Blick in Ermittlungs-Akten offenbart das furchtbare Versagen in der Flutnacht, Special Flutreporter, Focus online, viewed 10 January 2022, https://bit.ly/3t9B52l.
- Strobl, B., Etter, S., van Meerveld, I. and Seibert, J. (2019). “The CrowdWater game: A playful way to improve the accuracy of crowdsourced water level class data”, PLOS ONE, 14(9), p. e0222579.
- Tyszkiewicz, M.J., Fua, P. and Trulls, E. (2020). “DISK: Learning local features with policy gradient”, arXiv Preprint, 2006.13566.
- United Nations (2021), The United Nations World Water Development Report 2021: Valuing Water, UNESCO, Paris, FR.
- UNESCO and UN-Water (2020), The United Nations World Water Development Report 2020: Water and Climate Change, UNESCO, Paris, FR.
- von Ahn, L. and Dabbish, L. (2004). “Labeling Images with a Computer Game”, CHI ’04: Proceedings of the SIGCHI Conference on Human Factors in Computing Systems, pp. 319–326.
- Wanninger, L. and Heßelbarth, A. (2020). “GNSS code and carrier phase observations of a Huawei P30 smartphone: Quality assessment and centimeter-accurate positioning”, GPS Solutions, 24(2), pp. 1–9.
- cWright, A. (2021). Google Maps is trying to be painfully clear about how crowdsourced data powers navigation, Android Police, viewed 17 January 2022, https://bit.ly/3AhCOUA.
- Zangenehnejad, F. and Gao, Y. (2021). “GNSS smartphones positioning: advances, challenges, opportunities, and future perspectives”, Satellite Navigation, 2(24), pp. 1–24.
8. AUTHORS BIOGRAPHY
Dr. Melanie Elias is a PostDoc at the Institute of Photogrammetry and Remote Sensing at the TU Dresden. She received her PhD in Photogrammetry from TU Dresden in 2021 investigating the potential smartphones as novel geodetic measuring instruments. In this regard she developed and implemented an innovative water gauging method based on smartphones and photogrammetry for the spatio-temporal densification of hydrological measurement networks via crowdsourcing. Her research interests cover Photogrammetry, especially image-based 3D scene reconstruction in close connection with 4D change detection, Augmented Reality, Remote Sensing and Geoinformatics. The focus is mainly on environmental monitoring using and developing low-cost tools and solutions. Email : melanie.elias@tu-dresden.de
Prof. Dr. habil. Hans-Gerd Maas is Professor for Photogrammetry and Dean of the Faculty of Environmental Sciences at TU Dresden, Germany. His research is on image analysis techniques for the automation of image measurement tasks, combined with strict geometric and stochastic modelling for optimizing solutions. The focus of the photogrammetry group of TU Dresden is on the integration of sensors and processing algorithms for the development of efficient solutions for new measuring applications, with special emphasis on environmental monitoring tasks in forestry, glaciology and hydro sciences. Email: hans-gerd.maas@tu-dresden.de