
Abstract
1. INTRODUCTION
1.1 The highest astronomical tide
The Highest Astronomical Tide (HAT) is the uppermost of the various defined tidal levels (or tidal planes) used in Australia. HAT is represented within diurnal and semidiurnal tidal regimes. The IHO dictionary (IHO, 2022) (and the Australian National Tide Tables (ANTT, 2011)) defines HAT as:
‘The highest tidal level which can be predicted to occur under average meteorological conditions and any combination of astronomical conditions.’
The times of maximum tidal range occur when the earth is the closest to the sun (perihelion), the moon is the closest to the earth (lunar perigee) and the sun and moon are both in about the same position (above the equator) at zero declination. Zero lunar and solar declination occurs at the same time as lunar perigee, with a period of around 18.6 years and is known as the nodal cycle (Doodson, 1921).
HAT is used as a vertical reference level for a variety of purposes in Australia. In some precincts HAT is used to define overhead clearances for bridges and power lines on maritime charts. Heights given for bridges are the maximum height of the underside of the bridge above HAT, while power lines use the minimum height above HAT minus a safety margin. This distance gives an indication of the minimum height likely to be encountered and if this height is sufficient then there will be enough clearance at all other times during normal meteorological conditions.
The Australian Bureau of Meteorology (BoM) use HAT as a vertical reference level in the Storm Tide Warning System during severe weather when a storm tide may bring inundation and flood- ing. A storm tide is a storm surge superimposed on the astronomical tide (Pugh and Woodworth, 2014), and the likelihood that this will exceed HAT is used as the basis for activating the warning (DSITIA, 2013). The storm tide heights indicated in the warnings are given with reference to both HAT and the Australian Height Datum (AHD). The standard storm tide advice is issued when the storm tide is expected to be greater than 0.5 meters above HAT.
HAT represents the maximum height that tidally influenced water is expected to reach under nor- mal conditions. It can hence be used to define the boundary between land and water. In Queens- land the tidal boundary (HAT) is used to determine the boundaries of properties that are bordered by tidally influenced water in the absence of a physical feature (DNRM, 2018). Along with Lowest Astronomical Tide (LAT) HAT is used in the design of marine facilities such as boat ramps and in the design of sea defences such as sea walls.
The process of calculating HAT begins with a harmonic analysis of sea level observations, the resulting tidal constituents can be used to generate tidal predictions (Pugh and Woodworth, 2014). The longest practical tidal cycle, the nodal cycle is approximately 18.6 years (Doodson,1921). The period used for the basis of HAT is generally rounded to the nearest full year of 19 years as proposed by Marmer (Marmer, 1951) and applied by NOAA in the USA (Swanson, 1974). A 19-year Tidal Datum Epoch (TDE) is also utilised in Australia in the Australi- an National Tide Tables (ANTT, 2011). For the purpose of this work and to accommodate gaps in the observed record, 20 years (1992 to 2011) of tidal predictions were produced and HAT estab- lished as the highest predicted tide level within this period. Tidal predictions are used to deter- mine HAT rather than directly using 20 years of sea level observations as sea level observations contain non-tidal components such as abnormal weather conditions, whereas HAT is the highest tide based on average meteorological conditions (ANTT, 2011).
1.2 Pilot study
A pilot study that aimed to determine the Lowest Astronomical Tide level (LAT) as a datum from various short datasets found that the LAT to HAT level decreased with increasing dataset length (Pedderson, 2001). By increasing dataset length from 35 days to 12 months reduced the tide pre- diction derived HAT by 2.5 percent. The study was based on data from one site with only one sample per dataset length of 35 days, 2, 3, 6 and 12 months from the Gladstone (Auckland Point) tide gauge. Outcomes of the study suggest that the longest dataset give the best LAT datum (Pedderson, 2001).
As 20 years is often an impractical length of time to wait to formulate tidal levels after establishing a tide gauge, much shorter observed datasets are often used to establish tidal levels. As an ex- ample, the Torres Strait region of Northeast Australia consists of many islands with only short- term tidal data records. To generate HAT from these datasets would introduce an unknown de- gree of error, and it is somewhat impractical to install tide gauges for 20 years on all of the Torres Strait islands. The establishment of a coherent tidal datum (Metters and Pedderson, 2011) across the Torres Strait region and collection of simultaneous datasets enabled the transfer of HAT using the standard method (Marmer, 1951) from a site with a long-term dataset at Thursday Island. Alt- hough the degree of uncertainty in transferring datum by this method has been documented (Swanson, 1974) deriving HAT using this method come with unknown certainty.
Procedures to determine tidal datum and tidal levels (or planes) are well established. Marmer proposed two methods to calculate tidal datum (and tidal levels, also referred to as tidal planes) (1) using tidal constituents and (2) the standard method (Marmer, 1951). The standard method is used in the USA and involves applying differences in monthly mean water level between short-term (with a minimum of two years of data) and long-term sites to tidal levels of the long-term site. This gives an estimate of tidal levels at the short-term site and hence tidal datum can be transferred to the short-term site. Swanson (Swanson, 1974) assessed the standard method on shorter datasets of 1, 3, 6 and 12 months of data, the generalised datum accuracy improved with in- creasing data length based on the standard deviation of the difference.
The purpose of this study is to investigate the difference associated with calculating HAT, using tidal constituents, from data sets shorter than 20 years and comparing these to HAT from obser- vations spanning the full 20 years.
2. METHODS
2.1 The datasets
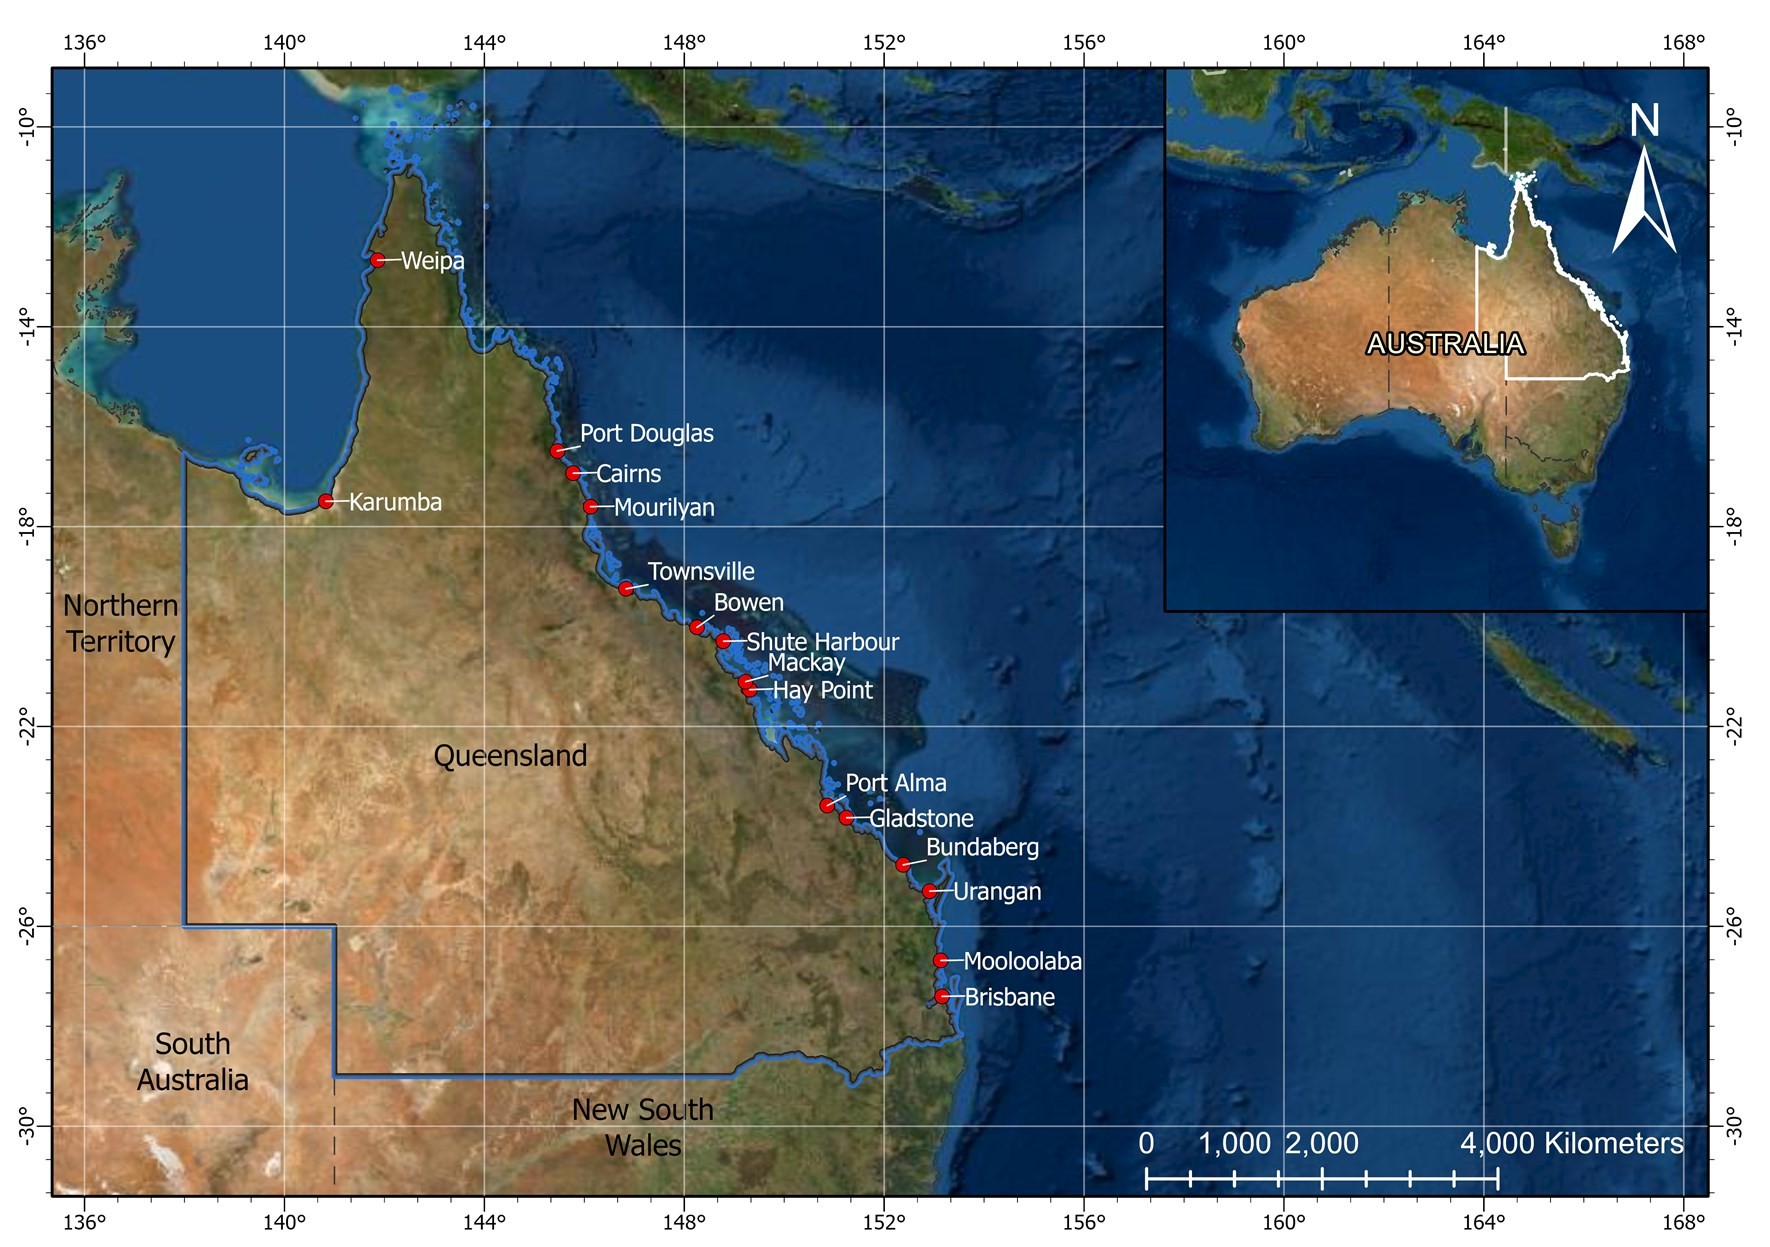
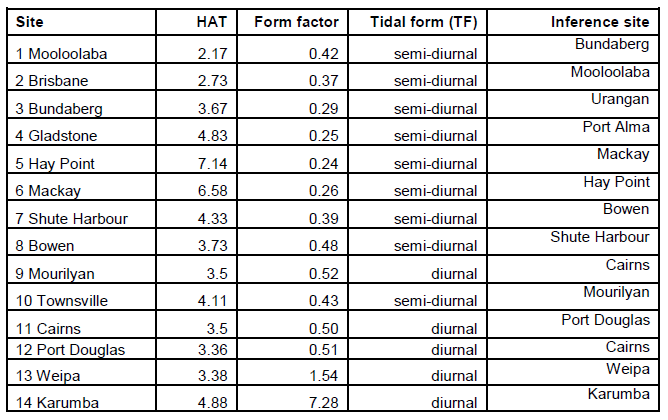
Sea level observations from 14 port-based tide gauge sites (Figure 1) were used as the basis datasets for this study. The tide gauge sites were chosen such that each site has a secondary site with similar tidal characteristics that could be used for inference of shallow water tidal constituents. The sites used for inference are listed in Table 1. The sea level data were checked for errors and any issues that may have been logged in recording water level as part of regular quality checks. Errors such as spikes were removed and data gaps of more than 50 per cent of any particular short dataset rendered it unusable. For each tide gauge site, a minimum of 20 years of good quality observed historic data for the period 28 December 1992 to 24 September 2011 were used. In order to provide a fair comparison between sites and between data lengths, the same number of samples that covered the same time period were used.
For each site the time series data was split into differing lengths of 35, 90, 180 and 400 days. In order to capture at least one full lunar tidal cycle of 28.52 days, and to cover the commonly used length of short-term tide gauge deployments the time series data length of 35 days was chosen. The 90- and 180-day data lengths were included to identify if there is an improvement in using datasets longer than 35 days and shorter than one full year. The 400-day dataset length was included here as it incapsulates one full lunar year of water level observations. Analysis of the 400-day datasets will then include shallow water tidal constituents and the seasonal constituents Sa and SSa. For each short dataset length there were ten datasets giving a total of 40 datasets per site.
2.2 Harmonic analysis
Each short dataset was put through harmonic analysis via the Foreman package (Foreman, 2004). The Foreman Package for tidal height analysis and prediction can produce up to 146 possible tidal constituents from a tidal analysis, 46 of these are purely astronomical in origin while the remaining 101 are shallow water constituents. The actual number of tidal constituents from any particular analysis varies according to the Rayleigh Criteria, which essentially increases the inclusion of more constituents as data length increases (see Foreman, 2004 for a full description of how the Rayleigh criteria is implemented). Here 20 years of tidal predictions were generated (from 1992 to 2011) based on the output tidal constituents.
As the tide enters shallow water its progression is modified by friction with the bottom and other physical interactive processes. These distortions can be expressed as simple harmonic constituents that are either multiples, sums, or differences of the speeds of the astronomical constituents. Analysis of such a short dataset will not identify some shallow water tidal constituents hence these must be inferred from a nearby site with a long dataset (Pugh, 1986). A set of shallow water tidal constituents from a nearby site with long observed datasets were included in the harmonic analysis (called inference from here on). The inference sites are listed in Table 1, note that the two sites in the Gulf of Carpentaria: Weipa and Karumba used the shallow water constituents from tidal analysis of long datasets (from Weipa and Karumba) as there are no sites near them with similar tidal dynamics. All of the sites in this study have long datasets behind them. The inclusion of inference here is intended to show whether inference can improve the HAT generated from short datasets.
The highest predicted tide level in the 20 years of tidal predictions then becomes Highest Astronomical Tide Short Data Length (HATSDL) and calculated for each of ten shorter datasets for each data length of: 35, 90, 180 and 400 days for each site. The difference between HAT and the average HATSDL of ten shorter datasets was determined, this is expressed as HAT-HATSDL. HAT for the 20-year dataset was taken as the official published HAT for each site (MSQ, 2010).
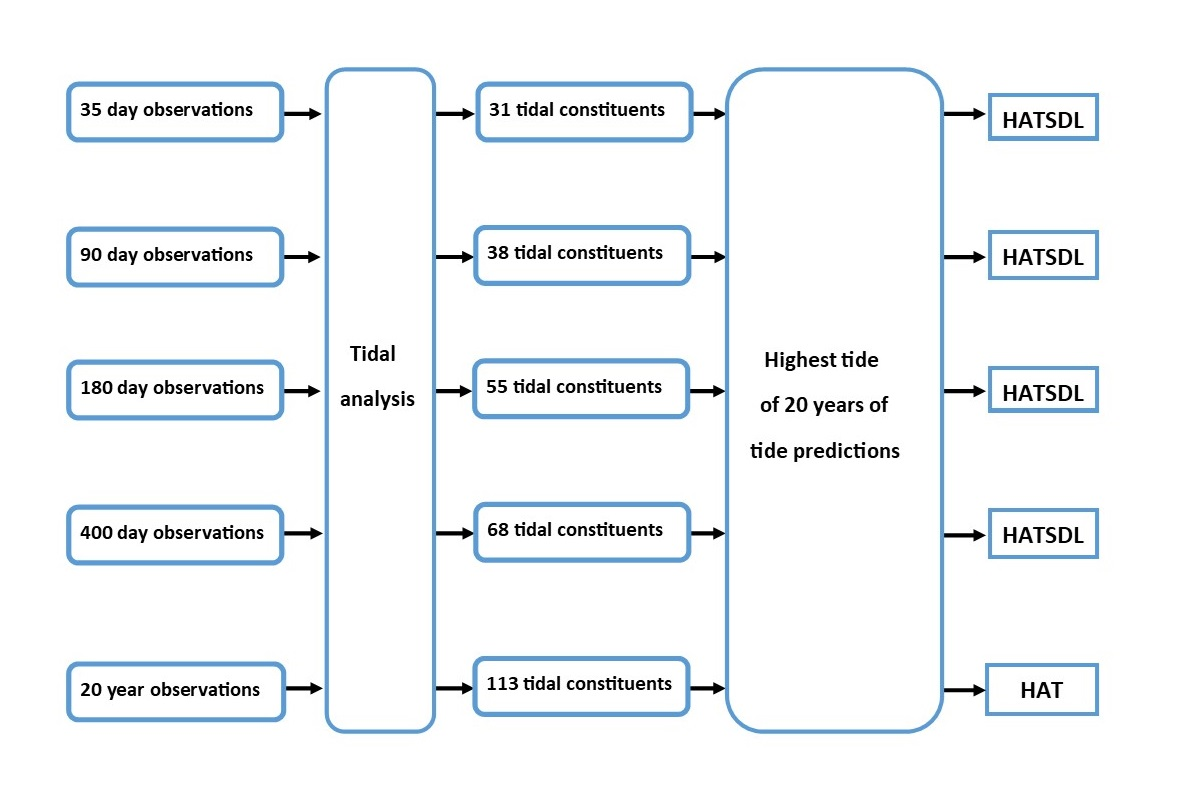
The workflow of data in simple terms is outlined in Figure 2, from sea level observation datasets then through tidal analysis which generates tidal constituents. The tidal constituents are then used to generate 20 years of tide predictions of which the highest level is the Highest Astronomical Tide level. For the short datasets HAT is referred to HATSDL here.
The relative importance of the diurnal and semidiurnal tidal constituents is expressed in terms of the tidal form factor (Pugh and Woodworth, 2014). Essentially the tidal form factor is a measure of how diurnal or semidiurnal the tide is at the site of interest. The tidal form (TF) of each site was calculated using Equation 1. The four major tidal constituents (K1, O1, M2, S2) used to calculate TF are based on long term datasets of 20 years or more and published in the Australian National Tide Tables (ANTT, 2011).
Equation 1 calculation of tidal form:
TF=(K1+O1)/(M2+S2)
When F ≤ 0.5 then semi-diurnal
When F > 0.5 then diurnal (ANTT 2011).
The tidal form was compared to HAT-HATSDL to investigate whether the site based tidal form influences the calculation of HAT from short datasets.
3. RESULTS
3.1 Comparison of short to long datasets
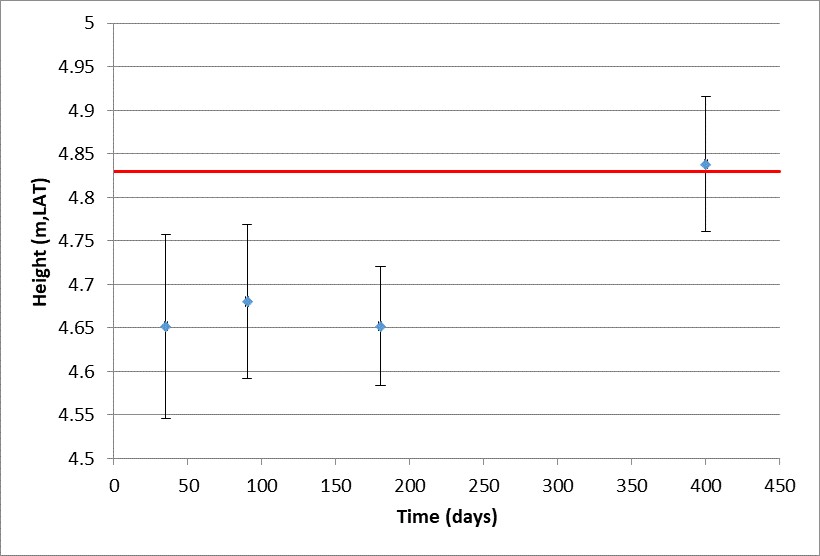
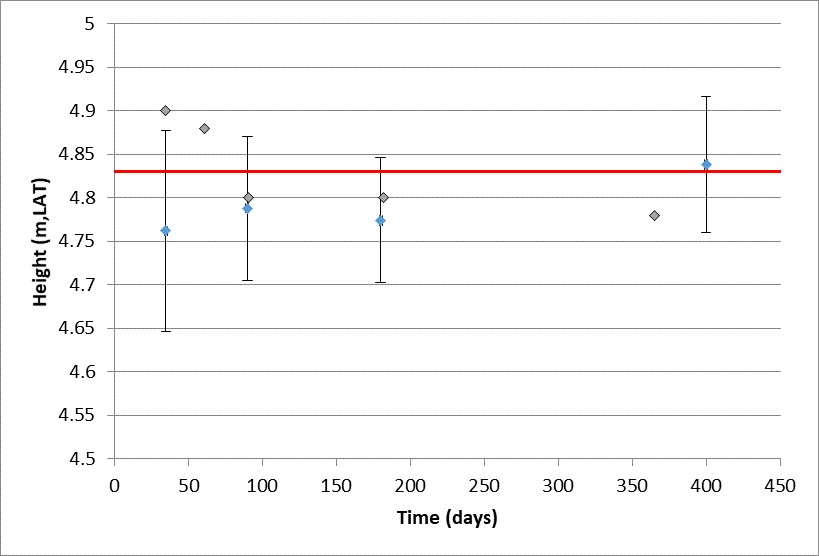
The pilot study mentioned in the introduction is the only work that could be found (based on online searches) that compares the use of datasets of differing length to formulate tidal levels. The pilot study was based on the Gladstone site and is an important comparative study. Hence a more specific and detailed summary of HATSDL from Gladstone follows. The average HATSDL using 35-day datasets without inference for Gladstone was 4.65 m whereas HAT from the 20-year dataset was 4.83 m (figure 3). This represents an average underestimate of HAT of 0.18 m. By using the 90-day datasets, the average HATSDL increased to 4.68 m, 0.15 m lower than HAT from the 20-year dataset. Using the 180-day datasets gave a HATSDL of 4.65 m which did not improve HATSDL compared to using the 35 and 90-day datasets. Using the 400-day datasets improved average HATSDL to 4.84 m just 0.01 m above HAT for Gladstone.
Inclusion of shallow water tidal constituents from the nearby port site of Port Alma increased HATSDL to 4.72 m for 35-day datasets (0.11 m lower than HAT), 4.79 m for 90-day datasets (0.04 m lower than HAT) and 4.77 m for 180-day datasets (0.06 m lower than HAT) (Figure 4). The results of the pilot study from the Gladstone site found HATSDL to be higher than HAT for one- and two-month datasets, and lower than HAT for 3-, 6- and 12-month datasets. The standard deviations of the shorter 35-, 90- and 180-day datasets appear to overlap hence it is difficult to make conclusions about the relative HAT-HATSDL difference.
The average HAT-HATSDL without inference over all sites was 0.24 m for short datasets of 35 and 180-days in length. The average HAT-HATSDL with datasets of 90 days in length was slightly lower at 0.23 m. With datasets of 400 days HAT-HATSDL decreases to 0.06 m (Figure 5). The use of short datasets to derive HAT (HATSDL) without inference resulted, on average, in an underestimate of HAT in all but the 400-day datasets as is evident in Figure 5.
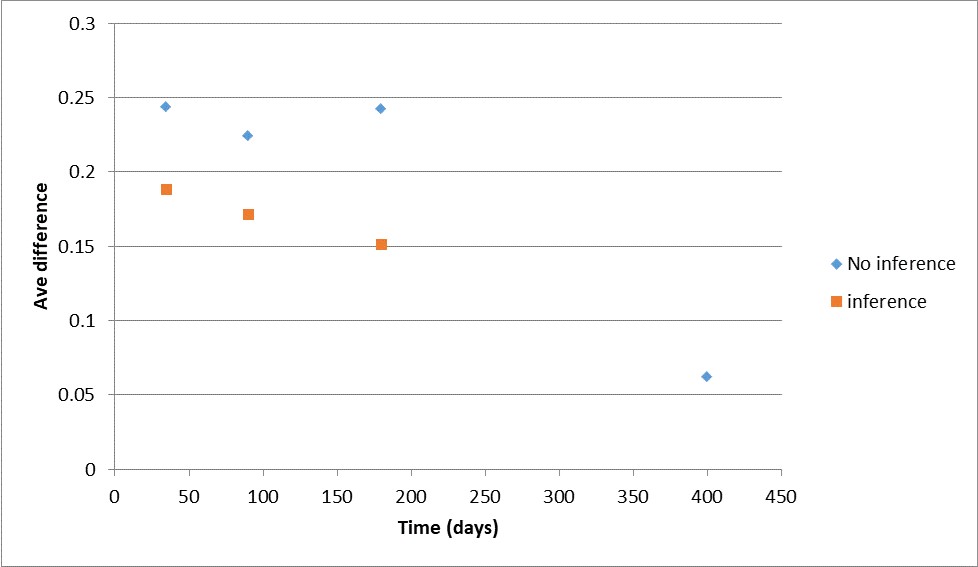
The inclusion of shallow water tidal constituents from the nearest site with a long dataset (inference) resulted in a reduction of the average HAT-HATSDL for 35, 90 and 180-day datasets. Inference was not used with the 400-day datasets as tidal analysis on a dataset of 400 days gives a full set of tidal constituents including seasonal and shallow water constituents. The largest aver- age HAT-HATSDL using inference was 0.19 m with datasets of 35 days, followed with 0.17 m for 90-day datasets and 0.15 m for 180-day datasets. This represents an improvement in HATSDL over non-inclusion of inference of 0.05 m, 0.06 m and 0.09 m respectively.
3.2 Tidal form
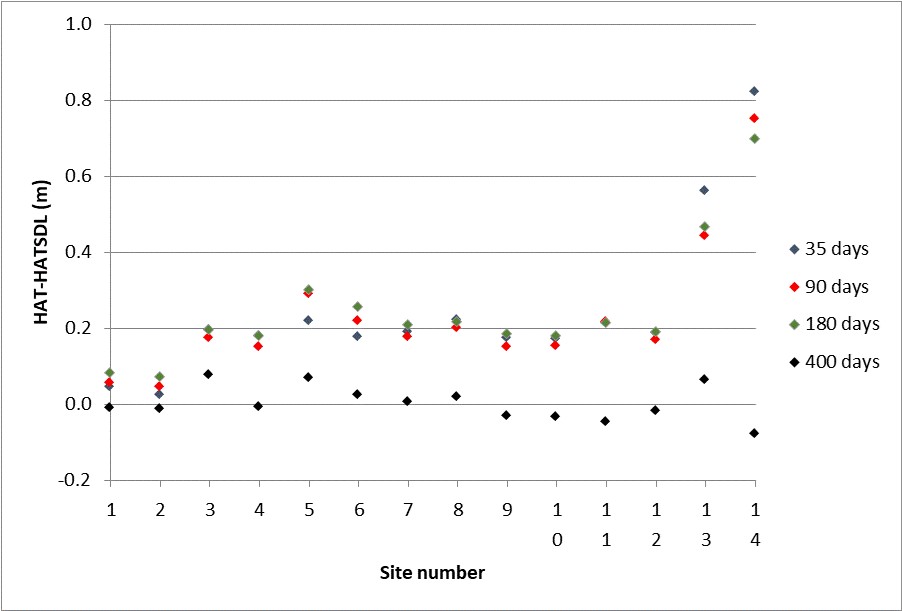
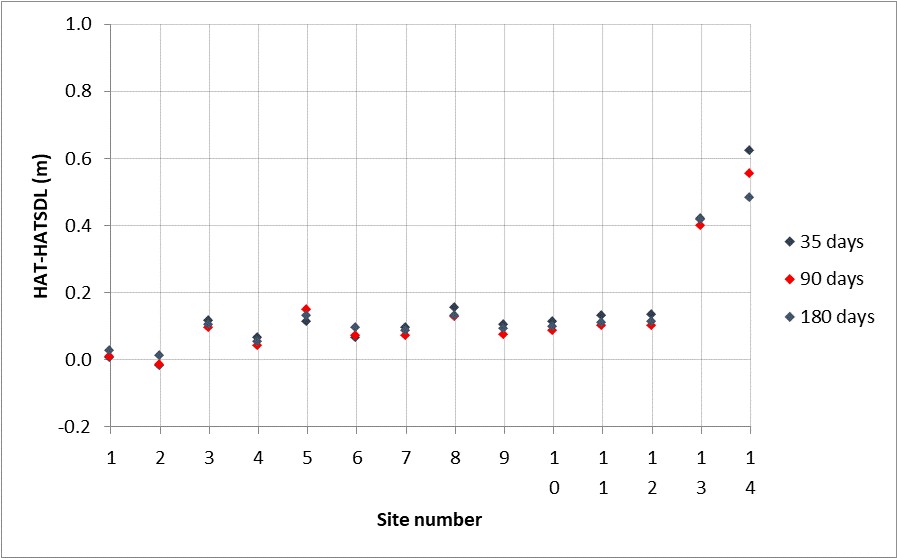
The TF varied around the coast such that; nine sites on the east coast are semi-diurnal and three are diurnal although the form factor is just over the 0.5 threshold for the three diurnal sites. Dividing the sites based on a regional basis reveals that the two sites in the Gulf of Carpentaria are more diurnal in form than the east coast sites. The two sites in the Gulf of Carpentaria have a dominant diurnal tidal form (see Table 1) with form factor of over 1.5. The average HAT-HATSDL for these sites was larger than all the other sites. The form factor at Weipa is 1.54 while the difference was 0.56 m for 35 days, 0.44 m for 90 days, 0.47 m for 180 days and 0.06 m for 400 days. The form factor at Karumba is much larger at 7.28 while the HAT-HATSDL was 0.82 m for 35 days, 0.75 m for 90 days, 0.70 m for 180 days and 0.08 m for 400 days (Figure 6). The inclusion of inference for these two diurnal sites improved HATSDL over non-inclusion of inference an average of 0.2 m for Karumba and 0.07 m for Weipa (Figure 7).
4. DISCUSSION
The variance (standard deviation) of each average dataset length is seen to be overlapping for the Gladstone site, so the change in HATSDL from 35 to 90 to 180 days could be considered statistically non-significant. This is verified by the fact that the average HATSDL increased at Gladstone with an increase in dataset length from 35 to 90 days, however the average HATSDL decreased with a further increase in dataset length from 90 to 180 days. This is contrary to the observation of Pedderson in the pilot study for Gladstone (Pedderson, 2001) where a decrease in the range of HAT followed an increase in dataset length. The Pedderson study was based on a sample of one, whereas this study was based on a sample of ten datasets per short dataset length. The Pedderson data points fall within ± 1 standard deviation of the mean of this study sug- gesting that the trend of decreasing range of HAT in the pilot study was a random coincidence. The inference of shallow water constituents improved HATSDL considerably.
The improvement in accuracy with increasing dataset length with inference confirms the findings of Swanson where accuracy of the standard method increased with increasing dataset length. The standard method of Marmer (Marmer, 1951) uses datum transfer by monthly mean levels but doesn’t provide a means of improving accuracy beyond using longer datasets. As shown here inference does provide a means of improving tidal level accuracy for short dataset lengths. This demonstrates the value in using inference and in the absence of long datasets, it would be wise to consider using inference from a site with long term datasets.
The reason behind the improved accuracy of tidal levels with increases in data length most likely lies with the increase in the number of tidal constituents that are output from tidal analysis. The average number of constituents here increased from 31 constituents from a 35-day analysis to 38 constituents from a 90-day analysis to 55 constituents from analysis of a 180-day dataset and to 68 constituents from analysis of a 400-day dataset. Although the shallow water constituents are small in amplitude (Foreman, 2014) the inclusion of more must intuitively be additive when generating tidal levels. The complicated interactions of the shallow water constituents and the impact of increasing the number of constituents on tidal level deserves further attention. It won’t be until the deployment length is equal to or longer than the long tidal period of the nodal cycle that a high level of accuracy n tidal levels can be realised.
The length of data from any tide gauge deployment should be considered prior to the deployment. This study has shown that without the use of inference, which is not always possible, a deploy- ment for 35 days will give a similar level of confidence in the derived tidal level (demonstrated for HAT here) as would a deployment of 90 or 180 days. A deployment of 400 days should improve the confidence in any derived tidal level over the confidence in using shorter deployments.
5. CONCLUSIONS
The use of short datasets to derive HAT using harmonic analysis methods will give differing re- sults when compared to the use of longer 20-year datasets. The findings of this study suggest that decreasing the base dataset length to 180 90 and 35-day dataset length reduces the range of HAT. The average HATSDL generated via 35 and 180-day datasets for Gladstone was lower than HAT by 0.18 m, and lower by 0.15 m for datasets of 90 days. The average HATSDL (for Glad- stone) generated from 400-day datasets was very close (slightly higher by 0.01 m) to HAT. The inclusion of shallow water tidal constituents in the harmonic analysis of Gladstone short datasets improved average HATSDL to 0.11 m below HAT for 35-day datasets, 0.04 m below HAT for 90- day datasets and 0.06 m below HAT for 180-day datasets.
The results presented here for all 14 sites suggest that when using short datasets of 35, 90 and 180 days in length to determine the HAT level, the level will be on average an underestimate of the HAT that is derived from a longer dataset. The average HAT-HATSDL was 0.24 m for short datasets of 35 and 180-days in length and 0.23 m for datasets of 90-days. The use of 400-day datasets decreased the average HAT-HATSDL to 0.06 m. So, by increasing a tide gauge deployment beyond 35 days will not improve the accuracy of tidal levels until it is longer than 180 days. The highest accuracy can be achieved with deployments of at least one year in length (shown to be 400 days here).
Including shallow water tidal constituents from a nearby site (inference) with long term datasets reduced HAT-HATSDL for 35, 90, and 180-day dataset lengths. The average HAT-HATSDL with inference was 0.19 m with datasets of 35 days, followed by 0.17 m for 90-day datasets and 0.15 m for 180-day datasets.
The average HATSDL over all sites improved with inference in a linear manner with HATSDL fall- ing from 35 days to 90 days and from 90 days to 180 days. This was contrary to the way that HATSDL changed without inference. On average inference reduced HAT-HATSDL by 0.05 m for the 35- and 90-day datasets and by 0.09 m for the 180-day dataset.
The tidal form appears to have influenced HAT-HATSDL particularly for sites with a strong diurnal tidal form. The HAT-HATSDL was larger for the two sites in the Gulf of Carpentaria, which are strongly diurnal, than for the east coast sites that are either semi-diurnal or weak diurnal tidal form.
6. REFERENCES
ANTT, (2022). Australian Hydrographic Service publication. Australian National Tide Tables 2022.
DNRM, (2018). Natural resources and other legislation amendment act 2010, viewed 30/01/2022, https://www.legislation.qld.gov.au/view/pdf/asmade/act-2010-012.
Doodson A.T., (1921). “The harmonic development of the tide-generating potential”, Proc. Roy. Soc. Ser. A, 100, pp. 305- 329.
DSITIA, (2013). Tropical Cyclone Storm Tide Warning – Response System 11th Edition 2013, State Disaster Management Group and the Australian Bureau of Meteorology, Queensland government internal document.
Foreman, M.G.G., (2004). Manual for Tidal Heights Analysis and Prediction (2004 revision). Pacific Marine Science Report 77-10, Institute of Ocean Sciences, Patricia Bay, Sidney, B.C., pp. 58.
IHO, (2022). S-32, the International Hydrographic Organisation hydrographic dictionary, viewed 28/03/2022, http://iho-ohi.net/S32/.
Marmer, H. A., (1951). Tidal Datum Planes, Special Publication No. 135, Revised (1951) Edition, U.S. Dept of Commerce, Coast and Geodetic Survey, Government Printing Office, Washington, D.C..
Metters, D. and Pedderson, R. (2011). “A coherent tidal datum for the Torres Strait”. International Hydrographic Review (IHR), number 5 (2011) pp. 33-42.
MSQ (2010), The Official Tide Tables and Boating Safety Guide, Maritime Safety Queensland, Queensland Government publication.
Pedderson, R.L., (2001). Determination of LAT from short term tidal analysis. Maritime Safety Queensland, Queensland government unpublished internal report.
Pugh, D.T. (1986) (revised 1996). Tides, Surges and Mean Sea Level, John Wiley and Son pp. 472.
Pugh, D. and Woodworth, P., (2014). Sea-Level Science: understanding tides, surges, tsunami and mean sea level changes. Cambridge University Press, pp 156-157.
Swanson, R.L., (1974). Variability of tidal datums and accuracy in determining datums from short series of observations. NOAA technical report NOS 64.
7. AUTHOR BIOGRAPHY
Daryl Metters is a Senior Scientist in the Queensland Government Hydraulics Laboratory within the Queensland Government Department of Environment and Science. Daryl has a BSc (Hons) in Marine Science from Flinders University. Daryl has worked in the National Tidal Centre, Australian Bureau of Meteorology as a Tidal analyst, and as Manager Spatial Information (Tidal services) in Maritime Safety Queensland. His work includes monitoring sea levels and tidal levels in Australia and the South Pacific region, data management and operational aspects of tide gauge and wave monitoring networks in Queensland.
Email: daryl.metters@des.qld.gov.au