
Abstract
At present, we only know in detail about 19% of the world seafloor. Concerning the Portuguese maritime spaces this knowledge is approximately 55%. In line with previous efforts, Instituto Hidrográfico has launched the SEAMAP 2030 program, aligned with the Seabed 2030 project, to complete this mapping by 2030. This article presents the strategic plan of SEAMAP 2030, describing its vision, its mission and some of the actions that are being conducted. Beyond the broad and plain execution of hydrographic surveys, this program is also innovating in how bathymetric data is being acquired, stored and used to generate new products.
1. Introduction
Currently, about 81 % of the Earth’s ocean floor remains to be mapped at high resolution, based on observed data. In 2017, when the Seabed 20301project, a joint initiative of the Nippon Foundation and the General Bathymetric Chart of the Oceans (GEBCO), started, this percentage was 94 % (Seabed 2030, 2020). This global mapping refers to a full bathymetric coverage of the seafloor, with high resolution, normally achieved through hydrographic surveys with multibeam echo sounders (MBES). At the end, Seabed 2030 aims to achieve 100 meters data resolution up to 1500 meters depth, 200 meters resolution up to 3000 meters depth, 400 meters resolution up to 5750 meters depth and 800 meters resolution beyond 5750 meters depth. This lack of seafloor knowledge has a special meaning when compared with the level of knowledge, for example, of the surface of Mars: we know the surface of that planet better than the surface of the Earth, under the oceans (Seabed 2030, 2017).
SEAMAP 20302program, led by Instituto Hidrográfico3(IH), aims to contribute to this worldwide knowledge of the seabed morphology by completing the high-resolution mapping of the Portuguese maritime spaces by 2030. IH is a Portuguese Navy body and a Marine Research Laboratory committed to the knowledge of the oceans, having recently celebrated its 60th anniversary in 2020. Its mission and activities are strategically framed by three main themes: mapping, observing and forecasting of the ocean. Therefore, SEAMAP 2030 is one of the two programs associated with the mapping of the ocean theme (another major program is SEDMAR, which aims to map the marine surface sediments of the geological continental shelf and slope) (Soares, 2020).
SEAMAP 2030 is part of a global context that recognizes and understands the importance of the oceans and their increasing value in the future. It adds to the Seabed 2030 project that seeks to complete the high resolution mapping of the Earth’s ocean floor by 2030. In addition, the United Nations (UN) has declared the period 2021-2030 as the Decade of Ocean Science for Sustainable Development4. This announcement is included in the 2030 Agenda for Sustainable Development5, regarding the sustainable development goals6 (SDG), namely its 14th goal: conserve and sustainably use the oceans, seas and marine resources7.
The conservation and sustainable use of the oceans implies their comprehension and respect. This can only be achieved through scientific research carried out at sea and that is based and usually driven by the detailed knowledge of the seafloor morphology. Thus, strategically, the aim of the Seabed 2030 project is upstream of the 14th SDG. Similarly, the objective of the SEAMAP 2030 program is upstream of the objective of the Seabed 2030 project, comprising, in addition to a national enterprise, an important contribution to world prosperity.
This article has the objective of presenting the strategic plan of the SEAMAP 2030 program, describing the following basis:
– The vision: 100 % of the national maritime spaces mapped by 2030;
– The mission: contribute to the conservation and sustainable use of the sea, supporting research and promoting development;
– The objectives: concrete actions that can enhance the success of the mission, concerning: data acquisition, data management and data products.
2. The Vision – Where are we mapping
2.1 The maritime spaces
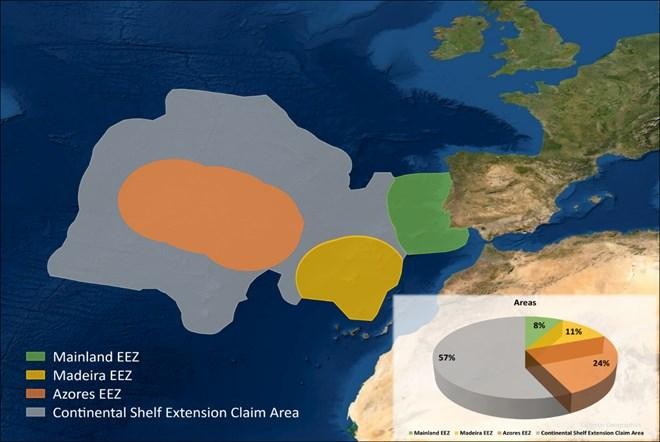
The Portuguese maritime spaces are characterized by four prominent regions: the exclusive economic zones (EEZ) of the mainland, Madeira and Azores; and the continental shelf extension claim, submitted to the UN Commission on the Limits of the Continental Shelf (CLCS), that is still waiting for deliberation. The maritime spaces are illustrated in Figure 1. The total area of these maritime spaces is approximately 4 075 166 km2, which is over 44 times the terrestrial area of the mainland.
2.2 The actual coverage
Today’s bathymetric coverage of the Portuguese maritime spaces is around 55%, which exceeds the Earth’s estimated global coverage (around 19 % as stated in the introduction). This coverage is shown in Figure 2.
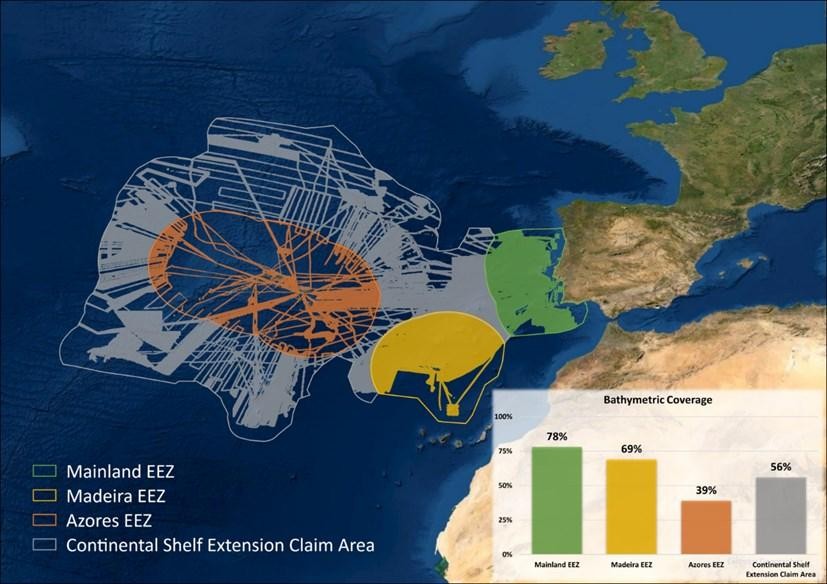
The area with the best bathymetric coverage is the mainland EEZ (78%) and the one with the poorest coverage is the Azores EEZ (39%). In the last two years, the efforts have been directed to this archipelago, in order to level up its coverage.
High resolution seafloor mapping campaigns in the Portuguese waters started in 2005, in an effort to acquire the necessary data to support the continental shelf extension claim. Between 2005 and 2009, which was the deadline to present the claim at the CLCS, over 900 survey days were executed, averaging more than 150 survey days per year. In the following years, the hydrographic surveys were continued with less frequency and in 2017, aligned with the Seabed 2030 project, the SEAMAP 2030 program was launched.
2.3 Hydrographic survey effort
The surveys are being conducted with MBES8installed on the gondola of Portuguese Navy hydrographic vessels NRP “D. Carlos I” and NRP “Almirante Gago Coutinho”. The MBES allows for full bathymetric coverage and has a standard angular aperture of 120°. This means that the swath width is approximately 3,5 times the nadir depth and it implies that the time needed to complete the bathymetric coverage (survey effort) depends on the depth of the area.
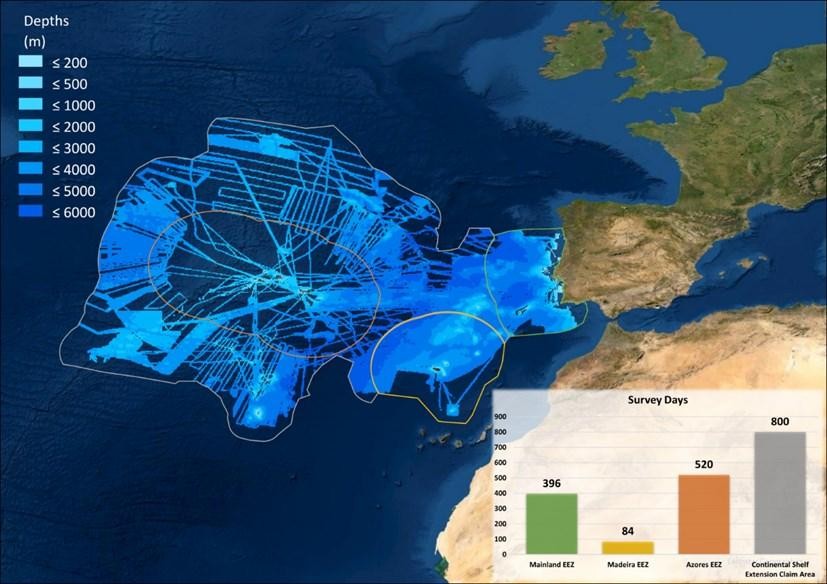
Figure 3 shows the depth intervals of the bathymetric coverage already achieved. The survey effort estimation made for the remaining areas shows that: the Madeira EEZ only needs 84 days of hydrographic surveying to be complete; mainland EEZ needs an additional 396 days; Azores EEZ needs 520 days; and lastly, the continental shelf extension claim area needs approximately 800 days.
The SEAMAP 2030 project is scheduled to end in 2030. This leaves 10 years to complete 1 000 to 1 800 survey days:
– 100 survey days per year, considering the complete bathymetric coverage (from 30 m depth outwards) of the territorial sea and the EEZ;
– 180 survey days per year, considering the complete bathymetric coverage (from 30 m depth outwards) of the territorial sea, the EEZ and the continental shelf extension claim area.
3. The Mission – Why are we mapping
For several years, the use of bathymetric information has primarily been directed to the production of nautical charts. The actual quest for geographic information and its usefulness, value and sharing is spreading worldwide, makes seafloor mapping not only important for the safety of navigation but also for many other domains.
Thus, the detailed knowledge of the seabed morphology enhances:
– Scientific research, backing up and guiding all the multidisciplinary research carried out in the oceans, and the consequent developments in technology, economics and culture. Seafloor mapping is the first step in exploring the oceans (National Oceanic and Atmospheric Administration, 2015). Before we begin a more comprehensive exploration, we need to understand the terrain, to be able to focus on a specific investigation aspect and on a certain method. Seafloor maps illuminate the study area and increase the scope, efficiency and pace of ocean exploration, saving both time and money while growing our chances for significant discoveries (National Oceanic and Atmospheric Administration, 2015). Seafloor mapping supports coastal, lacustrine and marine geologic research (United States Geological Survey, 2020) and bathymetric data can be applied in several ways, from water transportation or biological oceanography to the study of climate change (Schmidt Ocean Institute, 2021);
– Sustainable management, expanding the information about marine resources and improving the efficiency of their exploration and preservation. Once a seafloor region is mapped, scientists or resource managers can make better decisions on where and how to conduct targeted and more detailed exploration using more precise tools such as remotely operated vehicles (ROV). An example of this advantage was the discovery of the hydrothermal vent Luso in 2018 by the hydrographic vessel NRP “Almirante Gago Coutinho”. This finding was made possible by planning a ROV route based on the inspection of a high-resolution bathymetric model of Gigante seamount in Azores, as shown in Figure 4.
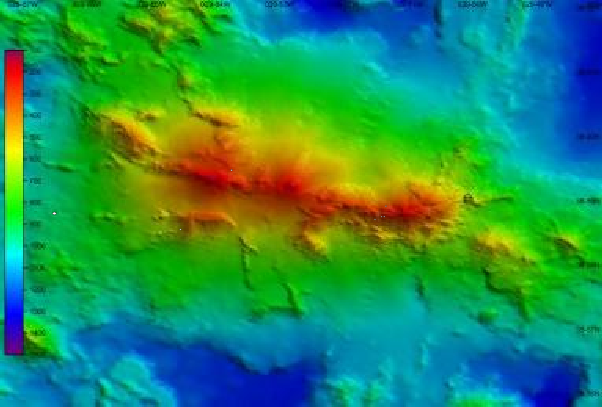
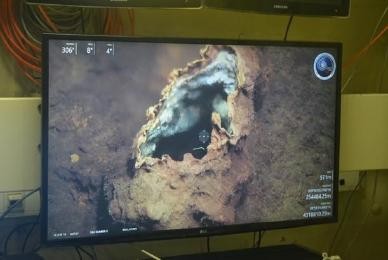
On the right, video capture of the hydrothermal vent, obtained with the ROV.
Another example of the importance of seafloor mapping is the identification of submarine structures (hydrothermal vents, seamounts, etc.) with scientific, environmental and conservation interest and the establishment of marine protected areas (MPA). MPA are areas of the ocean set aside for long-term conservation aims. They are the only area-based measure to increase the quality and the extent of ocean protection, for example, offering a nature-based solution to support global efforts towards climate change adaptation and mitigation. Thus, their establishment is critical to maintain climate change resilience and rebuild ecological and social flexibility. Currently, 6,35 % of the Earth’s ocean is protected (International Union for Conservation of Nature, 2021). The European Union (EU) has acted on this responsibility of maintaining the health of its seas, agreeing on a target of 10 % of coastal and marine areas protected by 2020 (Aichi Target 11 under the Convention on Biological Diversity) (European Environment Agency, 2018). Nowadays, Portugal has 4,4% of its marine areas (inside the EEZ) protected (76 765 km2 in 167 zones) (Marine Conservation Institute, 2021) and the aim is to increase this protection (Garcia, 2014). So, seafloor mapping is crucial to know where and what to protect;
– Decision support, ensuring a level of aw areness that can enable effective actions in economy, safety, security and civil protection. Knowledge is the source of successful decisions and bathymetric data is essential to ensure that we have the necessary and adequate information, products and services to prepare for and prosper in an ever-changing environment (National Oceanic and Atmospheric Administration, 2015). For example, the Global Risks Report has included the extreme weather events, climate action failure and natural disasters in the top 5 global risks in terms of likelihood in the last three years (World Economic Forum, 2020). Seafloor mapping can be an important tool to mitigate these risks, as it helps to: identify geologic faults and submarine landslides, providing baseline information for assessing and diminish natural hazards impacts such as earthquakes and tsunamis; establish baselines for long-term monitoring of environmental deviations due to climate change, weather events, and human influences; develop models to determine coastal flooding risks from sea-level rise and storms; and heighten public awareness of ocean and coastal issues (National Oceanic and Atmospheric Administration, 2015).
4. The Actions – How are we mapping
4.1 Data acquisition
SEAMAP 2030 project data is being acquired with MBES installed on the two Portuguese Navy hydrographic ships but, due to existing ship commitments, several alternatives are being considered.
The first one is getting access to other data sources other than those vessels. Every year, numerous scientific cruises carry out research campaigns in the Portuguese waters. Although the purpose of these cruises is not always to collect bathymetric data, they almost always end up doing it to support their studies. This means that the true bathymetric coverage of the Portuguese maritime spaces is bigger than the one reflected in IH’s current data.
In recent years, the IH has been contacting other cartography and bathymetry agencies that are responsible for the archive and management of the data from these cruises. A few examples are the National Oceanic and Atmospheric Administration (NOAA), the Federal Maritime and Hydrographic Agency of Germany (BSH) and the Royal Netherlands Institute for Sea Research (NIOZ). Access has been provided to the raw data and metadata. Then, the IH has been processing the data, comparing it with its own data, where possible, for quality control purposes. This procedure has revealed three main advantages: it raises the bathymetric coverage where there was no data; it increases sounding density, which can enable better bathymetric products, where there was already some data; and it preserves IH’s data quality standards in the processing stage. So, this is not just volunteered geographic information (VGI) or crowdsourced bathymetry since it has gone through a quality management procedure and it can be used for nautical charting purposes. As this is part of a global effort (Seabed 2030), this procedure would be a lot faster if every data administrator (the agencies that produce the data or the ones that manage it) would voluntarily share its data and information.
Another alternative to increase data acquisition efficiency is the use of unmanned systems. The use of these systems is being adopted worldwide, namely unmanned surface vehicles (USV) and unmanned underwater vehicles (UUV). The use of these vehicles can bring two main advantages to the SEAMAP 2030 project: the first one is that these systems can act as force multipliers, increasing survey’s efficiency and reducing survey effort time; the second one is that the mobility of UUV in the water column allows them to improve resolution, the closer they are to the bottom, making high-resolution even higher where needed.
4.2 Data management
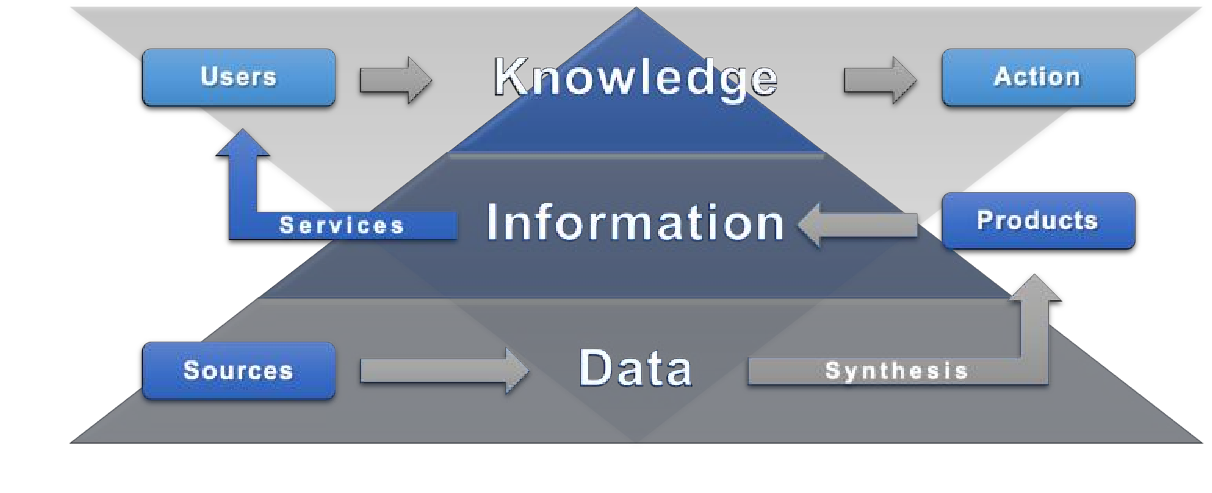
One of the many challenges in dealing with geographic data is how to make the most out of it. We know that a certain amount of data generates a smaller quantity of information and an even less volume of knowledge. Thus, knowledge transfer represents a small part of the potential of the original data. This can be reversed by diversifying products and services, that is, making the data more cost-effective, using it for different applications (International Hydrographic Organization, 2017). For example, bathymetric data can generate knowledge in areas as diverse as engineering, geology, chemistry, biology, or in concrete actions such as sustainable development and decision support. Figure 5 illustrates these concepts.
In order to accomplish this, the IH has developed a new spatial database to store the oceanic and coastal bathymetric data. In the past, the survey’s dataset that was being stored was the final bathymetric surface, corresponding to a gridded raster. Now, in a parallel database called MarPT, it is also being stored as point clouds with all the validated soundings from the surveys. This al- lows combination of soundings from multiple surveys, enhancing sounding density and creating new and specific products, dedicated to support, for instance, scientific research.
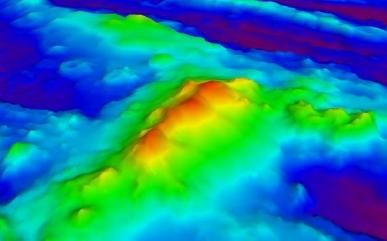
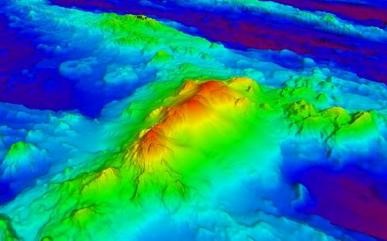
The mapping of seamounts has been an example of the utility of this database. Lately, the scientific interest in seamounts has been increasing. They represent important ecosystems and their morphology is particularly relevant, since it influences their ecology and biodiversity, their hydrodynamics and, consequently, the deposition of sediments and organic matter. Figure 6 shows an example of two bathymetric models of the same seamount with different resolutions. The worse resolution is enough for the nautical charts production, as long as it captures the minimum sounding relevant to the safety of navigation. However, a better resolution is needed, for example, to conduct a scientific study in the seamount.
4.3 Data products
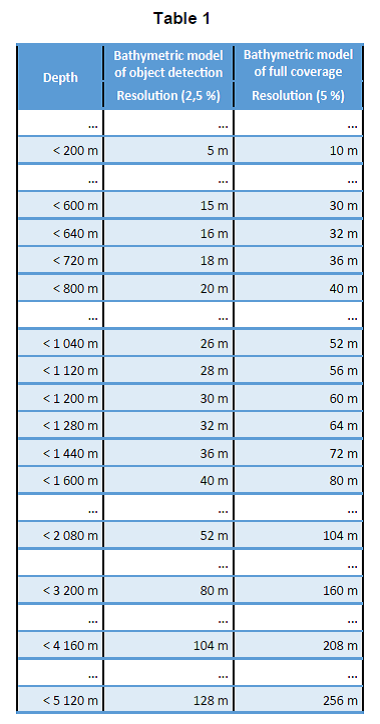
High-resolution mapping of the seafloor means that the soundings acquired in the hydrographic surveys will have enough density and the equipment used will have enough angular resolution to be capable of generating high-resolution bathymetric models. This kind of modeling has a horizontal resolution between 2,5% to 5% of the depth. For example, in a depth of 800 m, the horizontal resolution should be between 20 m and 40 m.
IH is producing two different bathymetric models: bathymetric model for object detection, with a horizontal resolution of approximately 2,5% of the depth; and bathymetric model of full coverage, with a horizontal resolution of approximately 5% of the depth. This was made possible with the recent availability and implementation of variable resolution surfaces (Teledyne CARIS, 2018), where the resolution of the bathymetric model changes with depth: lower depths have higher resolutions and higher depths have lower resolutions.
Table I describes the resolutions used in the IH’s bathymetric models. We can see that they are considerably better than the ones proposed to the Seabed 2030 project: grid resolution of 100 m to 1 500 m depth; grid resolution of 200 m to 3 000 m depth; grid resolution of 400 m to 5 750 m depth; and grid resolution of 800 m to 11 000 m depth (Mayer, et al., 2018).
5. Conclusion
SEAMAP 2030 is one of the two IH’s major mapping programs. Its vision is to achieve high resolution 100% mapping of the national maritime spaces by 2030. At the present, the national seafloor mapping coverage is about 55 %, considering the three EEZ and the continental shelf extension claim area. To succeed, it will be needed, on average, to carry out 100 (for the three EEZ) to 180 (for the three EEZ and the continental shelf extension claim area) survey days per year, using the available hydrographic ships, equipped with MBES. This survey effort could be optimized if the use of unmanned systems becomes more reliable and less expensive, and if information held by other hydrographic agencies or research institutions allows filling some coverage gaps.
The goals of SEAMAP 2030 are aligned and upstream the ones advocated by the world project Seabed 2030 and they are both part of a bigger picture framed by the UN’s Decade of Ocean Science for Sustainable Development. Specifically these initiatives are essential for improving scientific research, sustainable management and decision support. Globally they are crucial for the conservation and sustainable use of the sea.
The SEAMAP 2030 program has revealed to be more than just hydrographic surveys to complete seafloor mapping. This challenge is bringing innovation and shortening the implementation of new concepts, in the way data is:
– Acquired: actively searching for data sources, processing the data and controlling its quality; and planning the use of alternative survey platforms, like unmanned vehicles;
– Stored: creating new databases, adaptable to the future improvements of bathymetric modelling;
– And used: generating new and specific products with other purposes beyond the production of nautical charts and the safety of navigation.
SEAMAP 2030 and Seabed 2030 will require a big human and economic effort. So, in addition to focusing all its efforts on surveying the unknown, hydrographic agencies and research institutions should also share, as much as possible, their data holdings. The return over this widespread collaboration, in the near future, will surely pay off.
6. References
– European Environment Agency, 2018. Marine protected areas. [Online] Available at: https://www.eea.europa.eu/themes/water/europes-seas-and-coasts/assessments/marine-protected-areas [Accessed 26 january 2021].
– Garcia, R., 2014. Portugal vai ter 400 mil quilómetros quadrados de áreas marinhas protegidas. [Online] Available at: https://www.publico.pt/2014/07/03/ecosfera/noticia/portugal-podera-ter-400-mil-quilometros-quadrados-de-areas-marinhas-protegidas-1661374 [Accessed 26 january 2021].
– International Hydrographic Organization, 2017. C-17 – Spatial Data Infrastructures – The Marine Dimension. 2.0.0 ed. Monaco: International Hydrographic Organization.
– International Union for Conservation of Nature, 2021. Marine protected areas and climate change. [Online] Available at: https://www.iucn.org/resources/issues-briefs/marine-protected-areas-and-climate-change [Accessed 26 january 2021].
– Marine Conservation Institute, 2021. Marine Protection Atlas – Marine Protection by Coun-try. [Online] Available at: https://mpatlas.org/countries [Accessed 26 january 2021].
– Mayer, L. et al., 2018. The Nippon Foundation-GEBCO Seabed 2030 Project: The Quest to See the World’s Oceans Completely Mapped by 2030. Geosciences, Volume 8(2): 63.
– National Oceanic and Atmospheric Administration, 2015. Seafloor Mapping: The Foundation for Healthy Oceans and a Healthy Planet. [Online] Available at: https://oceanexplorer.noaa.gov/world-oceans-day-2015 [Accessed 26 january 2021].
– Schmidt Ocean Institute, 2021. Seafloor Mapping. [Online] Available at: https://schmidtocean.org/technology/seafloor-mapping [Accessed 26 january 2021].
– Seabed 2030, 2017. The Nippon Foundation: GEBCO Seabed 2030 Mission Statement. [Online] Available at: https://www.gebco.net/documents/seabed2030_brochure.pdf [Accessed 27 august 2020].
– Seabed 2030, 2020. Nearly a fifth of world’s ocean floor now mapped. [Online] Available at: https://seabed2030.gebco.net/news/gebco_2020_release.html [Accessed 27 august 2020].
– Soares, C. V., 2020. O Conhecimento Científico do Oceano. Instituto Hidrográfico, Conhecer o Mar para que todos o possam usar. Cadernos Navais, Volume 57.
– Teledyne CARIS, 2018. HIPS and SIPS Technical Note – Variable Resolution Surfaces. s.l.:Teledyne CARIS.
– United States Geological Survey, 2020. Sea Floor Mapping Group. [Online] Available at: https://www.usgs.gov/centers/whcmsc/science/sea-floor-mapping-group?qt-science_centerobjects=0#qt-science_center_objects [Accessed 26 january 2021].
– World Economic Forum, 2020. The Global Risks Report 2020. [Online] Available at: http://www3.weforum.org/docs/WEF_Global_Risk_Report_2020.pdf [Accessed 26 january 2021].
________________________________________