
Abstract
1. Introduction
1.1 Bathymetry Generalisation for Nautical Charts Generation. A Required Process
Topographic maps usually represent both natural and manmade features, making them very useful for professional and recreational use. The quality of these products can be directly verified by both the maker and the user, so it is highly unlikely that the user (e.g. a plane) crashes into a feature (e.g. a mountain) because the information was not correctly represented on the map. However, the situation is very different in the case of nautical charts. Apart from the fact thatcartographers cannot directly verify all the objects portrayed on a chart, mariners are sailing blind as regards to what is below the water surface. Unless vessels are fitted with a forward-looking sonar, most of the submerged hazards cannot be directly detected in advance, so the quality of information provided by charts is critical for safe navigation, otherwise a vessel may run aground. Undoubtedly, the nautical chart quality will depend strongly on the quality of data sources that have been used in its creation. As illustrated in Figure 1a, modern high-resolution equipment acquires hundreds of millions of soundings during a survey, thus providing a very detailed seafloor morphology. Nevertheless, it is necessary to make a generalisation of the bathymetric information to represent the seabed relief without cluttering the chart, in other words, as stated by the International Hydrographic Organization (IHO) (2018a), removing the least essential information. The unprocessed high-resolution raw dataset is usually cleaned by eliminating uncertain data and gridded to a raster digital elevation model (DEM) to reduce the data and improve the visualisation, making it more suitable for the intended charting product (Figure 1b). Then, a first selection of soundings is typically performed according to the product scale to reduce the huge amount of excess data from the gridded surfaces. Finally, the last level of generalisation takes place when the final chart soundings are carefully selected according to the international cartographic standards IHO S-4 (2018a) and IHO S-57 (2000) (Figure 1c). So, it is also important to consider for the final chart quality, how this process of generalising data sources has been performed.).
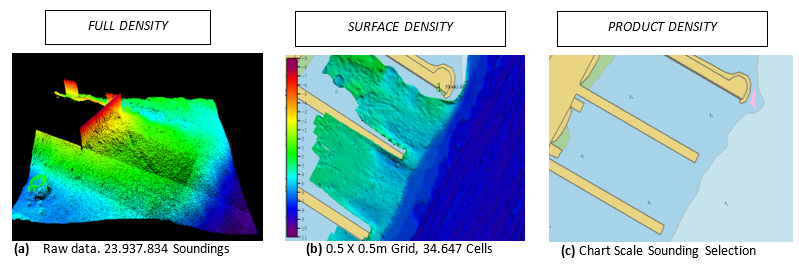
Figure 1. (a) Full density dataset from a high resolution multibeam echosounder.
(b) Raw dataset gridded to a raster digital elevation model, (c) Final chart soundings selection.
1.2 The Bathymetric Compilation Process
IHO S-44 (2008) describes the standards for hydrographic surveys, as well as some basic guidelines for quality control and data processing. On the other hand, IHO S-4 (2018a) specifies the chart specifications, as well as general rules to perform the generalisation of the bathymetry information and includes everything essential for safe navigation without over-crowding charts. However, what happens after processing datasets and before performing the bathymetry genera-lisation? In other words, what about the steps that are necessary for a quality bathymetric compilation? The word “compilation” in cartography is defined by IHO (2019) as “the selection, assembly, and graphic presentation of all relevant information required for the preparation of a MAP or CHART”. Figure 1 explain the “generalisation” of a single source. But, what happens when there are more sources available within the same geographic area? At this point, outcome the definition of the Bathymetric Compilation Process, as the steps that defines the appropriate selection of the participating sources, deconfliction of the overlapping and adjacent areas between sources, stablishing sources priorities, the combination of sources to create one harmonized model of the seafloor, and finally, the creation of cartographic product through generalisation of the original high density combined sources (e.g. soundings and depth contours) (Figure 2).
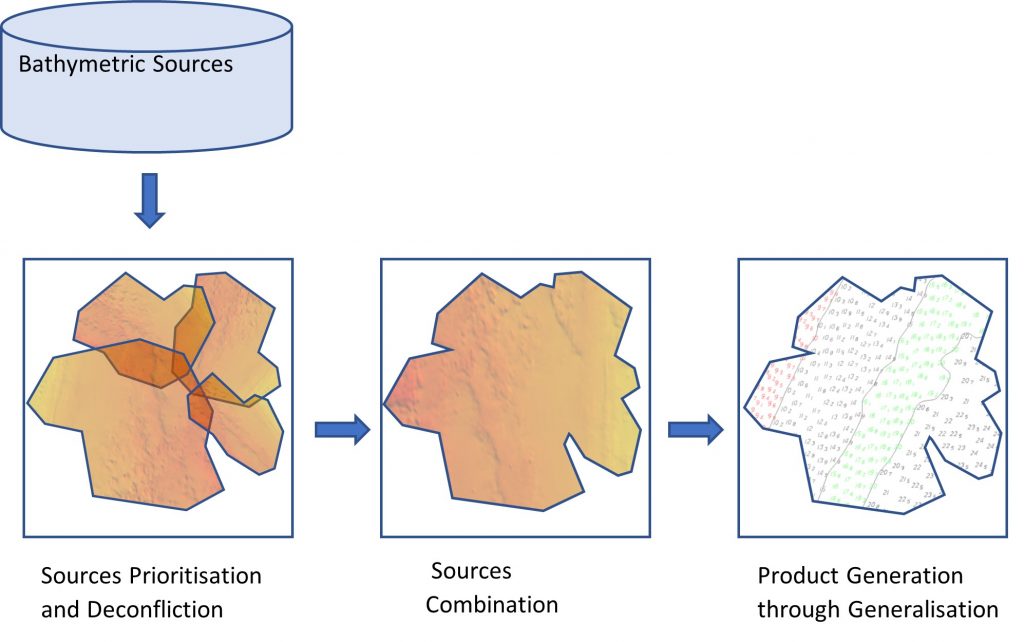
From BDB sources extraction to bathymetric product generation. Figure generated by the author.
1.3 The Bathymetric Compilation. A complex and inefficient process
The different tasks to carry out a compilation of bathymetry to select the relevant soundings and other information and ensuring a final quality product according to the IHO S4 (2018) cartographic standards, has always been a complex and time-consuming process that requires a high level of human intervention (Orass, 1975; Owens and Brennan, 2012; Wilson et al, 2016; Lovrinčević, 2016; Kastrisios and Calder, 2018; Wilson et al., 2018; Kastrisios et al., 2019). During the last few years, this process has become even more challenging, due to the increase in data volume (Wilson et al., 2016). This issue and the ever increasing number of sources that can be integrated into a bathymetric compilation made it necessary for the Instituto Hidrográfico de la Marina (IHM) to acquire specific and industry-endorsed software tools as well as proper databases, to store, manage and distribute the bathymetric information. Even so, the bathymetry compilation process continues to be one of the most serious bottlenecks, and the main concern is now how to reduce times in developing high-quality bathymetric compilation products to be used in the nautical chart. This inefficiency is caused by the necessity of getting over a series of difficulties that emergen during this process. This paper will focus on determining all those possible issues encountered when carrying out a modern bathymetric compilation for charting, and, to determine whether this situation is an issue common to other Hydrographic Offices (HOs). Additionally, it will gather possible solutions that currently may exist to make this process more efficient, emphasizing those areas that may still be subject to improvement.
2. Methodology
2.1 Degree of Complexity in Bathymétic Compilations according to IHO Members
A basic initial survey was sent to those IHO Members States (67) which according to IHO Yearbook Publication P-5 (2020) are publishing paper charts or ENC, hence probably involved in bathymetric compilation tasks. The main goal was to determine if other HOs, apart from the author’s experience, were or were not currently considering the process of bathymetry compilation as something complex and challenging. To evaluate the possible answers appropriately, other supporting questions were used, such as the types of sources used for compilations or the origin of the datasets (own surveys or from external organizations) to be used in the compilation process, as depending on these factors the stated degree of complexity in the compilation could be different. Numerous surveys could not be delivered due to restrictions or email security issues, and some HOs decided not to participate in the research. However, among the 67 Member States respondents, 43 (64.2%) answered the survey (see Figures 3 and 4).
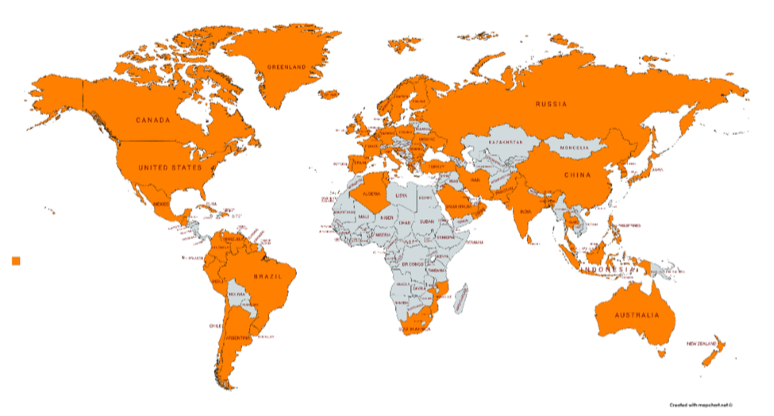
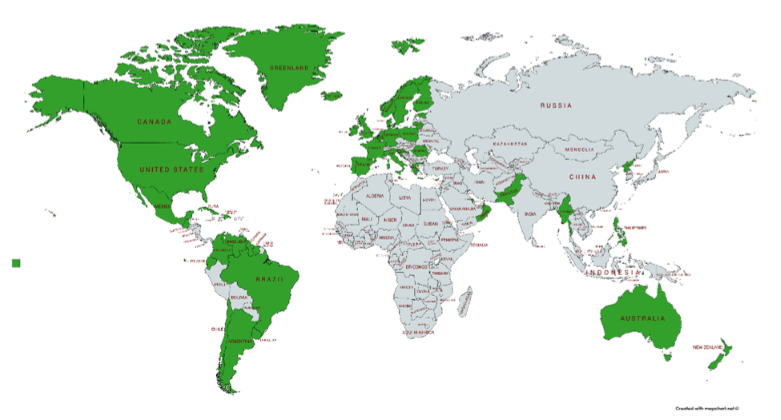
(Figure generated with website Mapchart).
2.2 Searching for possible issues during a real Bathymetric Compilation Case Study.
In this paper, the word “issues” will refer to all possible bottlenecks that may hinder the bathymetric compilation process, from managing bathymetric sources to obtaining the final chart products after their generalisation. To determine as many issues as possible, a true compilation case study was performed within a geographic area located at the Northwest corner of Spanish territorial waters, in particular on the Ferrol estuary, within the Galicia Region (Figure 5). This compilation was selected due to the complexity from the author’s perspective, because of the high number of available sources into the IHM bathymetric database (BDB) derived from the multiple surveys performed over the last 40 years. The bathymetric sources extraction was performed using the Teledyne CARIS Bathy DataBASE Server 4.3 framework and the compilation tasks were carried out using the software Teledyne CARIS Bathy Editor 4.4
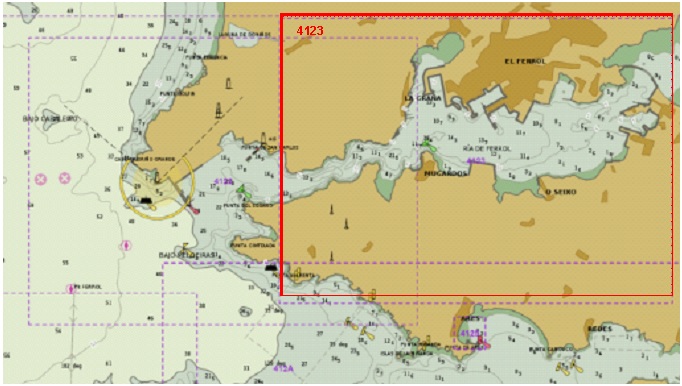
to be compiled. Visualization scale (1:60K)
The steps carried out in the compilation are not definedin any standards, previous work, or software manual. They are a general guide created by the author during the process to ensure the best possible results in the final product (Figure 6).
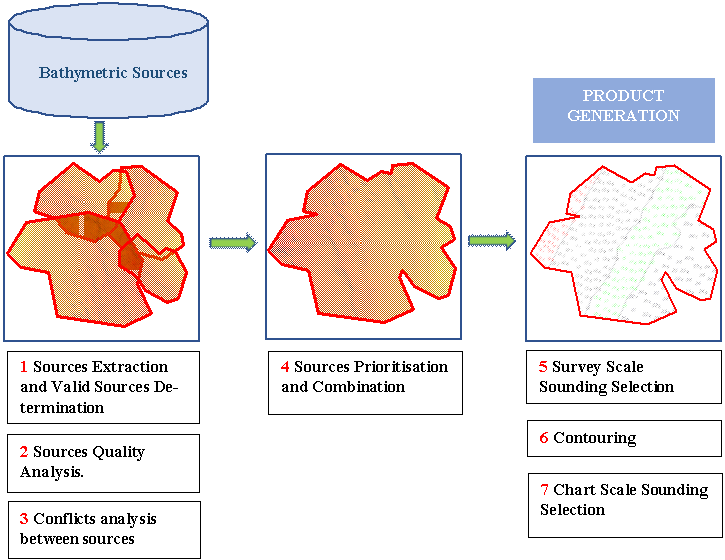
Figure generated by the author.
A total of 26 sources were extracted from the BDB, where 4 of which corresponded with gridded surfaces from modern high-resolution multibeam echosounder (MBES) equipment, and 22 point clouds (PC) datasets from traditional single beam echosounder (SBES) surveys (see Figures 7 and 8). The first issue came with the high number of historical datasets not necessary for the compilation. Determining which sources would be selected for the compilation implied a manual process, checking every source one by one, and being extremely rigorous to avoid errors. The criteria for sources selection were mostly the age of the source, but also the level of confidence and IHO standards compliance. After finishing this step, from the initial 26 sources, only 11 were selected for the compilation. Some soundings were rescued from legacy sources to complement lack in data of selected sources.
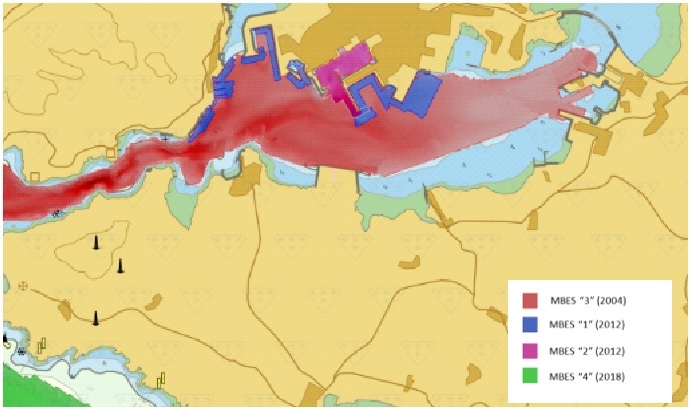
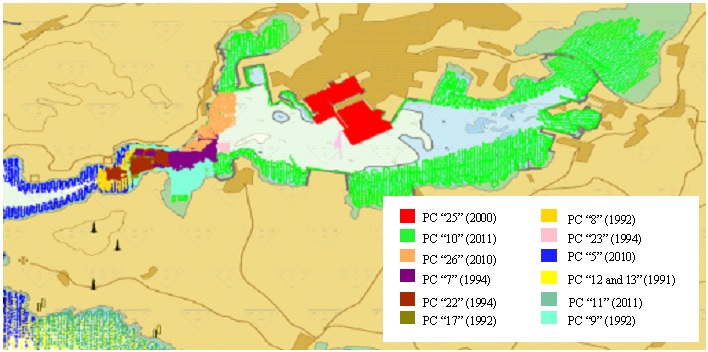
Sources are represented by different colours. Some sources are not represented as they are older and fully overlapped by others more recent. (Source: Author`s compilation case study)
Once valid sources had been determined, an individual analysis for every source was carried out to detect possible errors that might affect the quality of the final bathymetric product. Example of these issues are data gaps in gridded surfaces or “holidays”, and spurious soundings or “fliers”, generated from noise in the water column or incorrect settings in the sonar parameters (NOAA, 2014). Additionally, it is important to mention those datasets close to berthing areas that were not properly cleaned and could generate wrong final soundings. This problem usually rises when gridded surfaces contain multiple outliers in areas close to vertical and solid structures because of acquisition equipment noise (Makar, 2019) (Figure 9). The main challenge when detecting these kinds of issues was the necessity to go back to the cleaning software (e.g. CARIS HIPS) and correct the problems before continuing with the compilation.
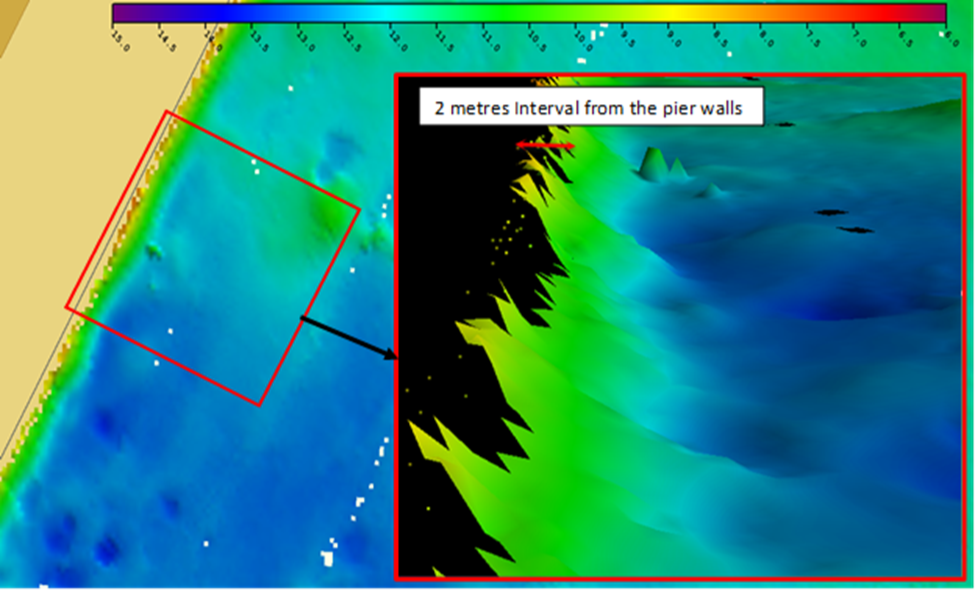
Figure 9. An example of a 1m MBES grid dataset reaching the walls of a pier in the case study. The 3D area visualized is indicated in a red square.
All data within a 2m interval distance would be rejected. (Source: Author´s compilation case study).
In the next step, the vertical coherence was analyzed between adjacent and overlapping sources to detect other possible errors or seabed variations over time, as a significant difference in height could generate important issues in sounding selection values or irregular depth contours. Differences between gridded surfaces were analysed with software automated tools; however, when the origin of those differences were unknown, it required stopping the compilation and going back again to the original projects to check the errors. On the other hand, comparing Point Cloud sources came out as a challenge that required performing a visual check due to an irregular and different soundings distribution. It is also important to mention the discrepancies detected along some boundaries between gridded datasets (Figure 10). This issue is usually referred to as “residues”, a concept defined by the author as a small portion of gridded sources close to the shoreline not fully covered by more modern surveys. If there is an important depth difference (due to inappropriate data processing or due to a seabed area being subject to changes) the rest of the old surface that remains after the combining step may generate wrong depths or irregular depth contours.
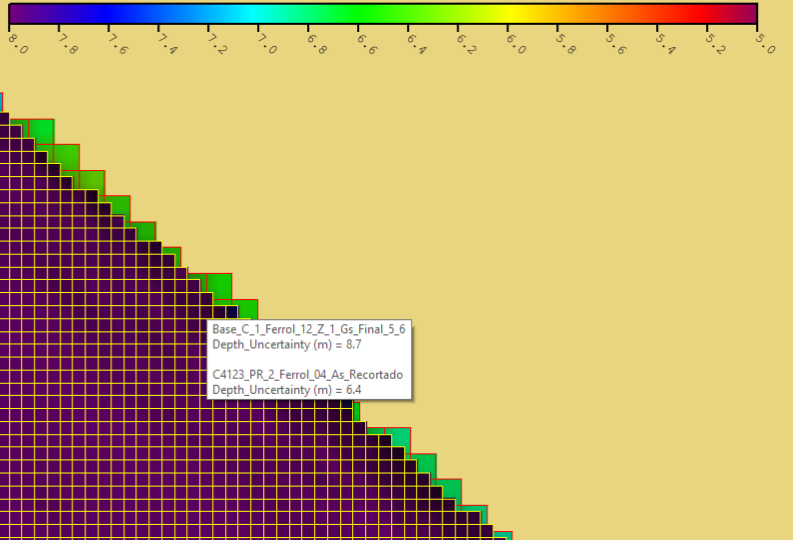
The most modern source (2012) has a reduced coverage not reaching the pier walls and it has a difference of 1.3 metres in height with the 2004 source. The part of the old surface that could remain after the combining step may generate wrong depths alongside berths (Source: Author´s compilation case study).
The next step was establishing priorities among valid sources and the combination into a single source. Priorities were set manually according to sources date, IHO standards compliance and sources level of confidence. This process could be done manually; however, when managing a huge number of sources, automated tools or rules could be necessary. Before running the CARIS combination tool, it was checked that all the sources were covering the area to be compiled. Surprisingly, there were depth values included in the published chart not included into the available BDB sources datasets. Those isolated soundings lacked accessible information apart from depths values and the chart sources diagram reporting about the acquisition year. This situation came up as a new delay issue, and those depths had to be recovered from the previous compilation file and treated as new sources. For the final combination process, the CARIS tool “Combine Surfaces” was used (Teledyne CARIS, 2019 and applying the different priorities in sources with overlapping areas.
The following steps will focus on generating the bathymetric products based on the S-57 objects and attributes structure described in IHO (2000). The first product was creating the survey scale sounding selection from the combined source, the preliminary sounding selection before the definitive in the chart. It was performed using the shoal-bias algorithm as indicated in IHO S-4 (2018a). This algorithm works choosing the shallowest depths among those of the highest priority, indicates others with the same priority within a radius of the selected one as ‘to be suppressed, goes to the second shallowest value doing the same routine, then the third-shallowest and more of the same (Lovrinčević, 2016). In this case, the radius suppression value used was of millimetres at the map scale, varying with depth ranges.
Then, it was carried out one of the most complex steps in the process, creating the depth contours. As contours must be generalised or “smoothed” to remove complexities that may confuse mariners (IHO, 2018a), the starting point was creating a “generalised surface” from the final combined surface at the same scale of the compilation and default resolution. CARIS automated contour generation tool was used as a starting point. Then, those initial contours were then smoothed in different passes to reduce superfluous bends and sharp angles, as well as merging those tiny, closed contours near to the main larger depth contour. It was considered a shoal- biased pattern (including deeper water within shoaler contour) to ensure the safety constraint and preserving a rational seabed representation according to IHO S-4 (2018a). The next step for validating contours was creating the S-57 objects “Depth Areas” (DEPARE acronym) from the previously created contours. This step was necessary to run the customised validation quality control (QC) Tests (Teledyne CARIS, 2019). Defaults CARIS QC Tests were also used to validate the S-57 data structure (e.g. removing intersecting contours), mostly based on IHO Electronic Nautical Chart (ENC) data structure validation checks recommendations according to IHO S-58 (2018b). However, the final version required a time-consuming and manual process until obtaining a final smoothed reliable depth contours, according to QC Tests, and other detected issues (e.g. removing those closed contours containing isolated deeper depths and not significant, or absorbing closed contours isolating single shoaler depths and close to the main contour) (Figure 11).
Finally, the last step in the process was to determine the final sounding selection to be placed in the chart product. This process was not performed by the author as it is usually a step carried out by cartographers within the IHM Cartography division. The starting point was using the sounding selection tool available in the software CARIS Hydrographic Production Database (HPD). The automatic selection algorithm used was also the shoal-biased varying with depths but testing manually different values until achieving an appropriate sounding distribution according to the seafloor slope, and preventing an irregular distribution close to depth contours. The final allocation of soundings was performed manually, removing those over contours or other cartographic features, or adding other supportive soundings, to accomplish the standards established in IHO S-4 (2018a).
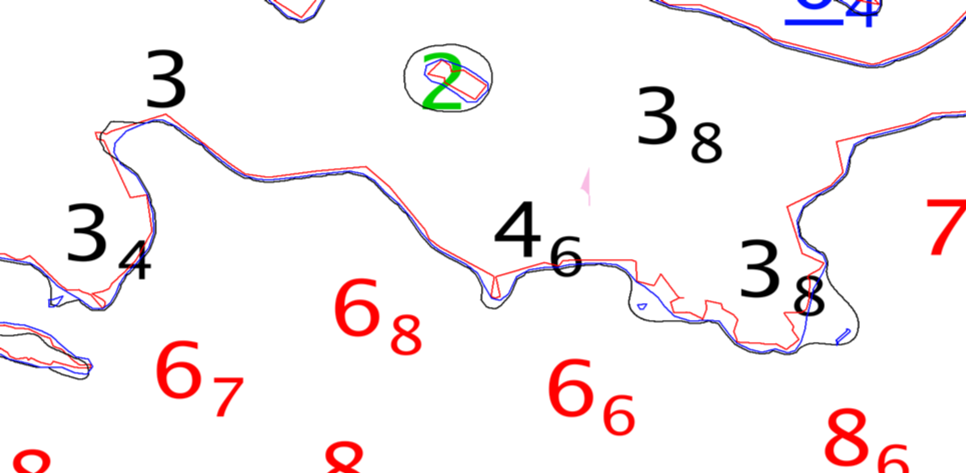
Figure 11. An example of depth contours evolution along the different generalisation stages. The red contour is derived from the generalised surface, the blue contour is the result after several smoothing passes, and the black contour is the final manually adapted version. (Source: Author´s compilation case study).
2.3 Second Survey. Contrasting the Results Among IHO Member States
Once gathered all the possible issues determined during the compilation case study, a second survey was sent to the 43 IHO members that participated in the first survey. The aim was to contrast with other agencies those issues identified in the author’s case study and finding those considered to be most challenging and requiring improvement. All issues were identified by other HOs; however, it is important to note that in this survey the HOs participants were reduced to 18 (42 % of respondents) (probably due to the COVID-19 world pandemic situation which decreased the HOs activities and the collaboration possibilities).
3. Results and discussion
3.1 Degree of Complexity in Bathymetric Compilations according to IHO Members
The results from the first survey sent to diverse HOs clearly show how challenging compiling a bathymetric product for charting is regardless of some considerations such as the types of sources to be used, their origin, or the number of official products to be published. Except for one institution, all agreed or strongly agreed with this statement (see Figure 12 with the results).
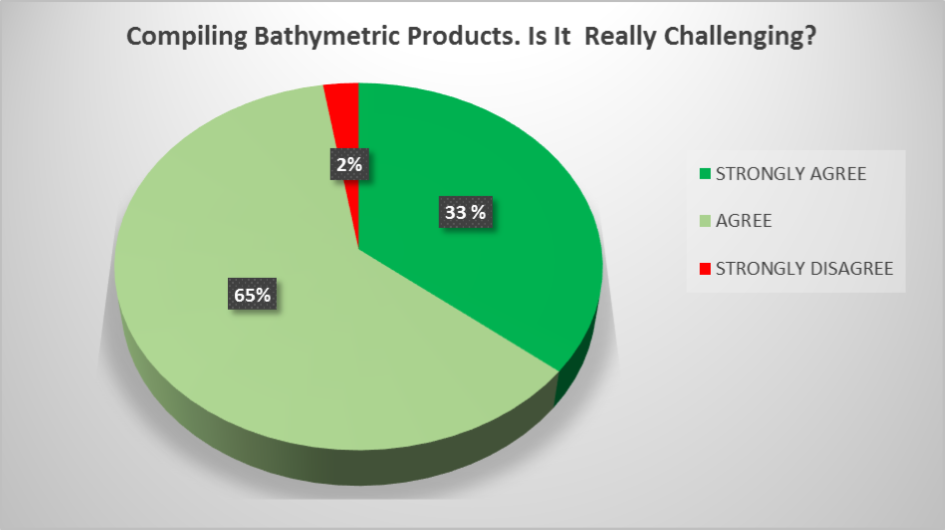
Figure 12. An indicator of the degree of complexity of bathymetric compilations determined by HOs that participated in the first survey.
3.2. Identifying the most challenging steps
Figure 13 illustrates all the different main steps identified in the author’s compilation case study and the percentage of time required to perform every step. In addition, Figure 14 shows those steps that have been identified in the second surveys by other HOs as most challenging, highlighting that that the three most challenging tasks identified by HOs correspond with those tasks identified by the author as more time-consuming through the compilation case study. The results demonstrate that the most challenging steps seem to be common to most HOs (chart scale sounding selection, contouring and sources prioritisation and combination).
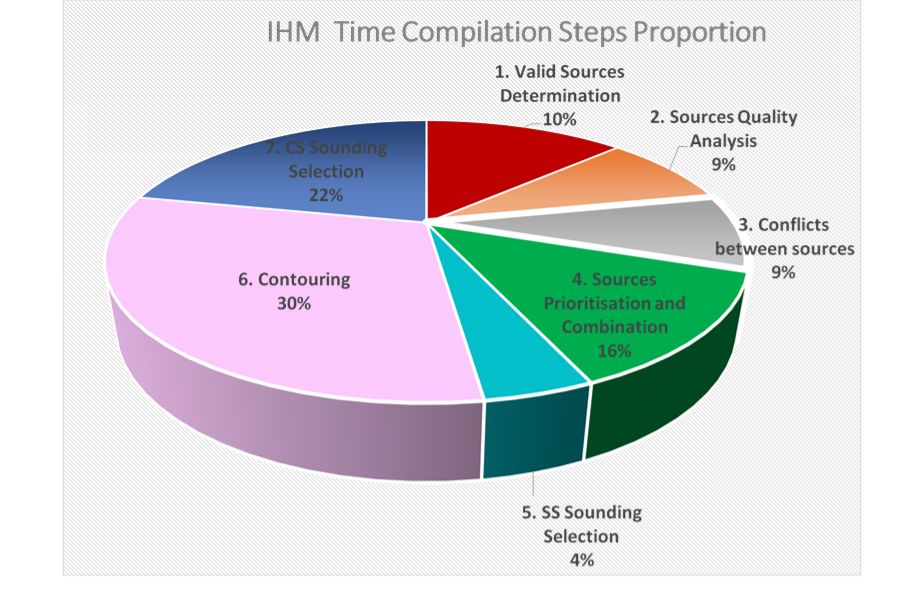
Figure 13. Different main steps identified in the IHM compilation case study and the percentage of time required to perform every step.
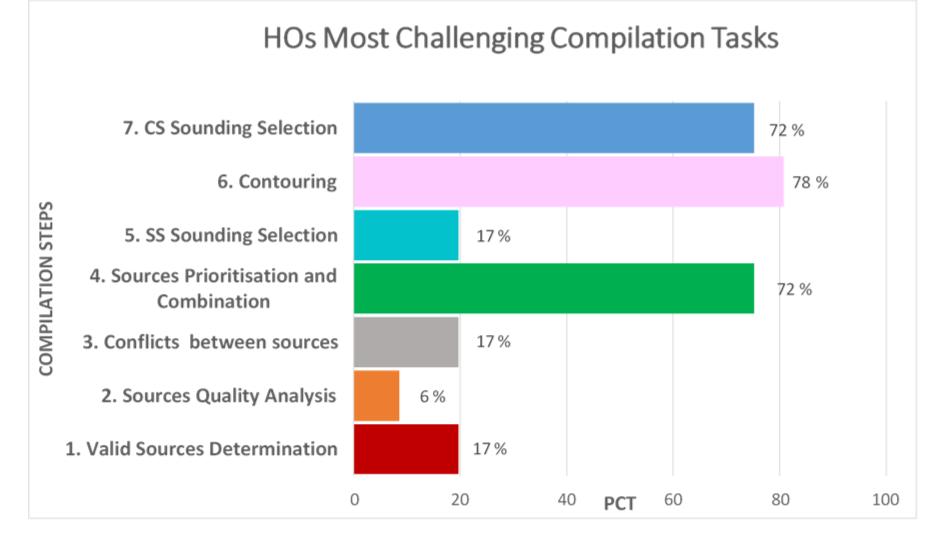
Figure 14. Percentage of HOs that currently consider the different compilations steps as more challenging obtained from the second survey sent to HOs.
3.3. Contrasting the Identified Issues with HOS and discussing possible solutions
An important number of issues or bottlenecks could be also gathered in the compilation case study, and, all of them, were also identified in the second survey by other agencies to a greater or lesser degree. In the following points, those issues stated within the different steps performed in the compilation case study will be discussed.
3.3.1. BDB Sources Extraction and Valid Sources Determination
According to the case study results, this process was among the most time-consuming steps. The different issues, possible origins, as well as the percentage of similarities with other HOs that participated in the second survey are summarized in table 1. An important issue that most compilers must address when managing a massive BDB may be the determination of the appropriate sources for the compilation, mainly when there are a considerable number of historical sources loaded into the IHM BDB, and when there is no metadata available to determine the confidence level. In addition, another important issue was the lack of sources stored within the BDB to cover all the area of the chart to be compiled. In the case study, the remaining coverages had to be recovered from previous compilation charts stored in the IHM Cartography division, and although this information was finally used for the compilation, most of the times those sources lacked from metadata. This issue is the most widespread among the HOs (61% of respondents). Other less significant issue may be when processes working with the BDB Server are too slow, although the solution could be focus on improving the hardware specs according to the manufacturer’s recommendations.
Table 1

Table 1. Issues and possible causes detected from the compilation case study during sources extraction and valid sources determination stage. The last column represents the percentage of the 18 HOs participating in the second survey
that identified the same issue.
3.3.2. Issues during Individual Sources Analysis
This step covered only the 9% of the author’s compilation time and was the least challenging task identified by other HOs (see Figures 13 and 14). However, the issue of “errors in sources” (see Table 2), was something identified in the second survey by almost half of participants. The main difficulties encountered when analysing every source individually were mostly related to inappropriate QC procedures during the processing and acceptance stages (such as holidays, isolated nodes, fliers, or designated soundings). A possible solution may be improving the QC procedures in data acquisition and processing stages. NOAA (2014) and NOAA (2019a) set a very good base for developing good practices regarding these procedures.
Table 2

Table 2. Issues and possible causes detected from the compilation case study during quality sources analysis.
The last column represents the percentage of the 18 HOs participating in the second survey that identified the same issue.
3.3.3. Conflicts Resolution between Overlapping Sources
The compilation concerns at this stage did not present relevant issues and were also little identified by other HOs as significant (only reported as a challenge by 17 % of respondents) (see Figure 14). In the author’s compilation case study, there were no significant differences among gridded overlapping surfaces apart from the usual variations in bottom changes that may happen within a harbour area, such as natural deposition and erosion changes, or human activities (e.g dredging works) (Zuo et al., 2019).
Similar issues have been reported by 33% of HOs (see first issue in Table 2). However, it is important to consider that a perfect matching among surfaces may be almost impossible, as there are factors, such as different equipment, different frequencies, bottom characteristics that may result in relatively low differences (Olson et al., 2007). So, it must be considered before stopping the compilation that those errors or deviations may be within the vertical uncertainties allowed by IHO S-44 acquisition standards (2008). In addition, it is important to mention the issue of “residues” when old gridded surfaces reaching the shoreline are not totally covered by more modern surveys (third issue in Table 3), something explained in detail in point 2.2 and reported by 56 % of HOs, which solution simply implies its detection and consideration during the compilation.
Table 3

Table 3. Issues and possible causes detected from the compilation case study during the analysis performed between overlapping and adjacent sources. The last column represents the percentage of the 18 HOs participating in the second survey
that identified the same issue.
3.3.4. Challenges in Prioritising and Combining Bathymetric Sources. Progress towards a Unique Bathymetry Source
of Truth Approach
This step emerged as one of the most laborious in the compilation case study (13 % of the total time), as well as something stated as one of the most challenging tasks by most of the HOs answering the second survey (77% of respondents) (see Figure 13 and 14). The most challenging issue in this step was the nonexistence of an automated tool for setting priorities among overlapping datasets, and able to cover all possible cases. Searching for an appropriate automated prioritisation tool for combining surfaces is a software limitation that primarily concerns many HOs (72% of respondents) and is generally necessary when combining a huge amount of historic data with more modern MBES datasets. An example of an automated process might be the project presented by Wyllie and Rice (2020) for sources combination within the National Oceanic and Atmospheric Administration (NOAA) project called National Bathymetric Source (NBS), in which the aspects to consider for the sources prioritisation included a temporary factor called “Decay Score” as a changeability model of degradation over time. Wyllie and Rice (2020) state that combining surveys to create a unique and consolidated bathymetric source of truth ensures the best accessible data not only for charting purposes, but also for other fields such as industry or science. However, combining surfaces using this approach might still present several challenges, such as making sure that all sources metadata are correctly introduced, or being able to properly capture those areas that are really changeable (e.g. channels to be dredged).
The idea of survey prioritisation according to their degradation over time have already been presented by different authors and HOs (Gonsalves et al., 2015 and Chenier et al., 2018), although with the aim of identifying priorities to make the planning of surveys more efficient. Using these ideas and managing only the necessary sources would make not only the surveys preparation, but also the cartographic product compilations more efficient. So, if a BDB is appropriately structured and sources properly identified with the necessary metadata or attributes, the approach of developing and maintaining over time a unique and consolidated bathymetric source of truth can be considered as a good solution for preventing performing the whole process of sources determination and setting a prioritisation among sources for every cartographic compilation case (steps 1 to 4 of the compilation process presented by the author in figure 6). Unfortunately, as far as the author is concerned, there is no literature available regarding how to build and properly manage a bathymetric database and neither there is available commercial software to do it.
3.3.5. Depth contours generation and generalisation
Depth contours generation was identified as the most challenging task by all HOs participating in the second survey (78 % of respondents), as well as resulting the most time-consuming process during the IHM compilation case study (see Figures 13 and 14). The main challenge through this process was solving the complex issues of generalisation/smoothing depth contours (e.g. remo-ving or merging small rings, fixing contours intersecting or modifications according to soundings out of depth contours) to achieve a product that met with the safety and morphology constraint stated by IHO S-4 (2018a). Despite using software automated generalisation tools, most of the depth contours had to be revised manually and appropriately modified, as it was not possible to fully accomplish the safety constraint. As Table 4 illustrates, the most common issue among HOs is that software generalisation tools do not cover an automated full solution (78% of respondents), despite the multiple software capabilities. Moreover, the HOs second survey observations
revealed different possibilities for contour generation according to HOs viewpoints or philosophy, so common inputs may generate slightly different results, an issue previously stated by CHS (2011). From the author’s point of view and according to the concern expressed by HOs, although automated software tools are improving the results, the issue of generalising contours continues to be a complex task that has received insufficient attention in the literature, as well as apparently from software developers.
Table 4

Table 4. Issues and possible causes detected from the compilation case study during the process of depth contour generation and generalisation. The last column represents the percentage of the 18 HOs participating in the second survey
that identified the same issue.
3.3.6. Chart Scale Sounding Selection
According to NOAA (2019b), there are up to 5 possible types of soundings on a nautical chart: least depths, critical soundings, deep soundings, and fill and supporting soundings. In the case study was possible to automatically select least and critical depths. However, the distribution of the remaining soundings had to be performed manually by rescuing from the sounding scale survey selection dataset. Besides, unnecessary soundings (e.g., atop contours or over other features) had to be removed, as this issue was not considered by the software algorithm in the process. Diverse authors have considered this process as a challenging task, focusing their
research on finding solutions for automating the process and reducing human subjectivity (Orass, 1975; MacDonald, 1984; Sui et al., 2005a; Sui et al., 2005b; Owens and Brennan, 2012; Lovrinčević, 2016; Lovrinčević, 2019). Most of software algorithms (e.g. Teledyne CARIS, 2019c; Jeppesen a Boeing company, 2012; SevenCs, 2020) are based on the influence circle method in which radius circles are defined selecting the shallowest sounding inside (Lovrinčević, 2019). Other software manufacturers (e.g. SCALGO, 2019) have recently presented an alternative to the traditional shoal-bias algorithm for sounding selection, being able to add automatically “fill” soundings based on previous depth contours and critical soundings.
According to the results derived from the author’s case study and the second surveys (identified as a challenge task by 72% of respondents, see Figures 13 and 14), final chart sounding selection raised another complex and time-consuming process, and, despite using automated algorithms, the process continues to be largely manual. Although it seems that this process has been the object of research and development, improvement in automated selection is still wide open, at least regarding commercial software developers, as according to HOs survey observations, some hydrographic agencies are using bespoke software or running the process largely manually.
4. Conclusions
Compiling a quality bathymetric product for charting continues to be a complex and time-consuming process and, in many steps, subject to human manipulation and subjectivity, something ratified by most of the HOs that are currently publishing paper chart or ENCs.
A semi-automated process for a quality bathymetry compilation from multiple sources was presented in this paper based on a a real compilation case study. Diverse issues or bottlenecks could be determined in every compilation stage, and most of them were similarly also identified among other hydrographic agencies. The methodology to obtain the issues was restricted to CARIS software workflow, although other software tools could also be used. The most complex tasks continue to be those related to the final bathymetric product generation to be portrayed on the nautical chart (depth contours and final chart sounding selection). Despite the existence of ever-increasing software automation tools, both tasks continue to largely be performed manually, generating a time-consuming process, which is subject to human subjectivity. Therefore, there is much needed room for software improvements, and, having a full process and algorithms where the software could create uncluttered soundings and contours that clearly present the safe and unsafe water with the minimum human intervention would be very welcome.
Apart from the previous matters, determining the most appropriate datasets and its correct prioritisation to create a single combined bathymetric surface (the starting point for the generation of the bathymetric products) emerged as an important issue that concerns many of the hydrographic agencies. Maintaining an updated single deconflicted bathymetric source of truth has recently been presented as a good solution to make the cartographic compilation products more efficient. However, the problem remains in how to reach that goal easily and preferably by using more suitable automation tools that currently exists and that may cover most of possibilities. From the author’s point of view, building and managing a bathymetric data base properly for charting purposes, as well as using suitable automated tools, might be key to obtaining efficient and quality chart compilations, and, at the same time, would help in planning the hydrographic surveys for adequate chart updates more efficiently. There were other minor issues detected, that usually hinder the compilations workflow, such as those errors when analyzing individual sources, or lack of vertical coherence between overlapping surfaces. However, those issues are mostly due to unsuitable QC practices during the previous steps that could be removed by establishing clear procedures.
5. References
– Canadian Hydrographic Service (CHS), (2011). Contouring by Automatic Generation tools. Paper for Consideration by CSPCWG (Chart Standarization and Paper Chart Working Group).8th Meeting. November 2011.
– Chenier, R., Abado, L., and Martin, H. (2018) “CHS Priority Planning Tool (CPPT) – A GIS Model for defining hydrographic survey and charting priorities” International Journal of Geo-Information, v. 7, p. 240-234.
– Gonsalves, M., Brunt, D., Fandel, C., and Keown, P., (2015) A Risk-based Methodology of Assessing the Adequacy of Charting Products in the Arctic Region: Identifying the Survey Priorities of the Future, in U.S. Hydrographic Conference 2015.
– IHO (International Hydrographic Organization) (2000). S-57 Appendix A IHO Object Catalogue. Edition 3.1., November 2000, International Hydrographic Organization, Monaco.
– IHO (2008) Special Publication N-44: IHO Standards for Hydrographic Surveys. 5th Edition February 2008. International Hydrographic Bureau. Monaco.
– IHO (2018a). Publication S-4. Regulations of the IHO for international (INT) Charts and Chart Specifications of the IHO. Edition 4.7.0, October 2018, International Hydrographic Organization, Monaco.
– IHO (2018b). Publication S-58.ENC Validation Checks. Edition 6.1.0, September 2018, International Hydrographic Organization, Monaco.
– IHO (2019) S-32 IHO – Hydrographic Dictionary / Multilingual Reference for IHO Publications – (Hydrographic Dictionary Working Group (HDWG) – 2019). Available at: http://iho-ohi.net/S32/engView.php (Accessed: 15 February 2020).
– IHO (2020). Publication P-5. Yearbook. Edition 3 February 2020. International Hydrographic Organization, Monaco.
– Jeppesen a Boeing company (2012) dKart Office Functional Overview. Available at: http://ww1.jeppesen.com/documents/marine/commercial/dKart-releases/dKart_Office_-_Overview_2012.pdf (Accessed: 10 Mar 2020)
– Kastrisios, C., and Calder B. (2018). Algorithmic implementation of the triangle test for the validation of charted soundings. Paper presented at the Proceedings of the 7th International Conference on Cartography and GIS, Sozopol, Bulgaria, June 18-23.
– Kastrisios, C., Calder, B., Masetti, G., and Holmberg, (2019) On the Effective Validation of Charted Soundings and Depth Curves. US Hydro 2019. March 18-21. 10.13140/RG.2.2.18705.89440
– Lovrinčević, D. (2016) “Quality Assessment of an Automatic Sounding Selection Process for Navigational Charts”. The Cartographic Journal. 54. 1-8. 10.1080/00087041.2016.1195031.
– Lovrinčević, D. (2019) “The Development of a New Methodology for Automated Sounding Selection on Nautical Charts”. Naše more. 66. 70-77. 10.17818/NM/2019/2.4.
– MacDonald, G. (1984) “Computer Assisted Sounding Selection Techniques,” The International Hydrographic Review vol. 61, no. 1, pp. 93-109, 1984.
– Makar, A. (2019) Algorithms for Cleaning the Data Recorded by Multibeam Echosounder. International Conference on Geo Sciences GEOLINKS 2019. 10.32008/GEOLINKS2019/B3/V1/29.
– National Oceanic and Atmospheric Administration (NOAA) (2014). NOAA Field Procedures Manual (FPM). Available at: https://nauticalcharts.noaa.gov/ publications/docs/standards-and-requirements/fpm/2014-fpm-final.pdf (Accessed: 20 April 2020)
– NOAA (2019a). Hydrographic Surveys Specifications and Deliverables (HSSD). Available at: https://nauticalcharts.noaa.gov/publications/docs/standards-and-requirements/specs/hssd-2019.pdf (Accessed: 20 April 2020)
– NOAA (2019b) Nautical Chart Manual (NCM) Vol.1. Available at: ftp://ocsftp.ncd.noaa.gov/NAUTICAL_CHART_MANUAL/NCM%20Volume%201.pdf (Accessed: 20 April 2020)
– Olsson, U., Ericson, M.,Nilsson,S., Öiås, H. (2007) A practical approach to quality control and quality analysis of depth data. US_Hydro_2007_paper. Available at: http://citeseerx.ist.psu.edu/viewdoc/download doi=10.1.1.125.1498&rep=rep1&type=pdf (Accessed: 12 Apr 2020)
– Oraas, S. R. (1975) “Automated sounding selection”. The International Hydrographic Review. Monaco. Vol. 52. No. 2. pp. 103-115.
– Owens, E. and Brennan, R. (2012) “Methods to influence precise auto-mated sounding selection via sounding attribution and depth areas”. CHC The Arctic, old challenges new approaches, Niagara Falls,Canada 15–17 May 2012
– Peters, R. Y., Ledoux, H. and Meijers, B. M. (2013) Generation and generalisation of safe depth-contours for hydrographic charts using a surface-based approach, 16th ICA generalisation workshop, Dresden, Germany, 23–24 August 2013.
– SCALGO (2019) SCALGO Nautical Documentation Release 1.22.8. SCALGO.
– SevenCS (n.d.). ENC Bathymetry Plotter. Available at: https://www.sevencs.com/enc-production-tools/enc-bathymetry-plotter/ (Accessed: 20 January 2020)
– Sui, H., Zhu, X., Zhang, A. and Wan, X. (2005a) “A System for Automated Cartographic Sounding Selection”. Marine Geodesy. Vol. 58. No. 2. pp. 159-165. https://doi.org/10.1080/01490410590953695.
– Sui, H., Hua, L., Zhao, H. and Zhang, Y. (2005b) “A Fast Algorithm of Cartographic Sounding Selection”. Geo-spatial Information Science. Vol. 8. No. 4. pp. 262-268.
– Teledyne CARIS (2019). CARIS BASE Editor Manual Version 4.4. Available at: https://www.teledynecaris.com/docs/4.4.14/base%20editor/#page/CARIS%2520BASE%2520Editor%2520Help%2FBE_NOTICES.01.1.html%23 (Accessed: from 25 November 2019 to 01 May 2020)
– Wilson., Masetti, G., and Calder, B. (2016) NOAA QC Tools: Origin, Development, and Future. Canadian Hydrographic Conference. May 16-19,2016. Halifax, NS. Available at http://ccom.unh.edu/sites/default/files/publications/Wilson_Matt_NOAA_QC_Tools.pdf (Accessed: 10 November 2019)
– Wilson, M., Masetti, G., and Calder, B. (2018) “Automated Tools to Improve the Ping-to-Chart Workflow”. The International Hydrographic Review, (17). Available from: https://journals.lib.unb.ca/index.php/ihr/article/view/26291 (Accessed: 20 November 2019).
– Wyllie, K., and Rice G., (2020) Building the National Bathymetry. Available at: https://www.nauticalcharts.noaa.gov/updates/building-the-national-bathymetry/ (Accessed: 16 February 2020)
– Zuo, S., Xie, H., Ying, X., Cui, C., Huang, Y., Li, H. and Xie, M. (2019) “Seabed deposition and erosion change and influence factors in the Yangshan Deepwater Port over the years”. Acta Oceanologica Sinica, 38, 96–106. https://doi.org/10.1007/s13131-019-1461-5
6. Author Biography
Lieutenant Commander Juan Manzano is the head of the Hydrographic Surveys Acceptance and the Bathymetric Database at the Hydrographic Institute of the Spanish Navy (IHM). B.Sc. and M.S. in Naval Sciences (Spanish Naval College, 2005). He completed the Hydrographic Course in Hydrography IHO/FIG/ICA Category “A” (Hydrographic Institute of the Spanish Navy, 2010), and a PgDip and M.Sc. in Advanced Hydrography for Professionals (University of Plymouth, 2020).
Email: jmanru2@fn.mde.es