


Abstract
Preamble
The following work was presented at the Hydrographic Conference HYDRO 2023, 7–9 November 2023, Genoa, Italy in the oral session Blue Transition.
1 Introduction
Climate change and food security are among the most pressing challenges for life on earth today. The oceans, specifically the seafloor, play a key role in tackling exactly those two challenges. Yet, we are facing a major problem: there is a severe lack of detailed data on the seafloor to maximize its potential. Policymakers require data to make informed decisions on ocean policies (e.g. pollution regulation), attract new investments in the sustainable blue economy (e.g. offshore wind), and scale nature-based solutions through the upcoming blue carbon and biodiversity credit markets (e.g. seagrass meadows and kelp forests).
There are technologies that can map the seafloor at scale, including satellite imagery and airborne mapping. To add credibility to what is observed from a distance, these methods are dependent on so- called ‘ground-truth’ data. Observations close to the seafloor verify the done remote measurements and add information about the health state of habitats. Not having credible, objective, high-detail ground- truth data reduces the opportunity our seafloor provides in tackling climate change and food security. As this has been a manual and time intensive process, the availability of ground-truthing data is limited.
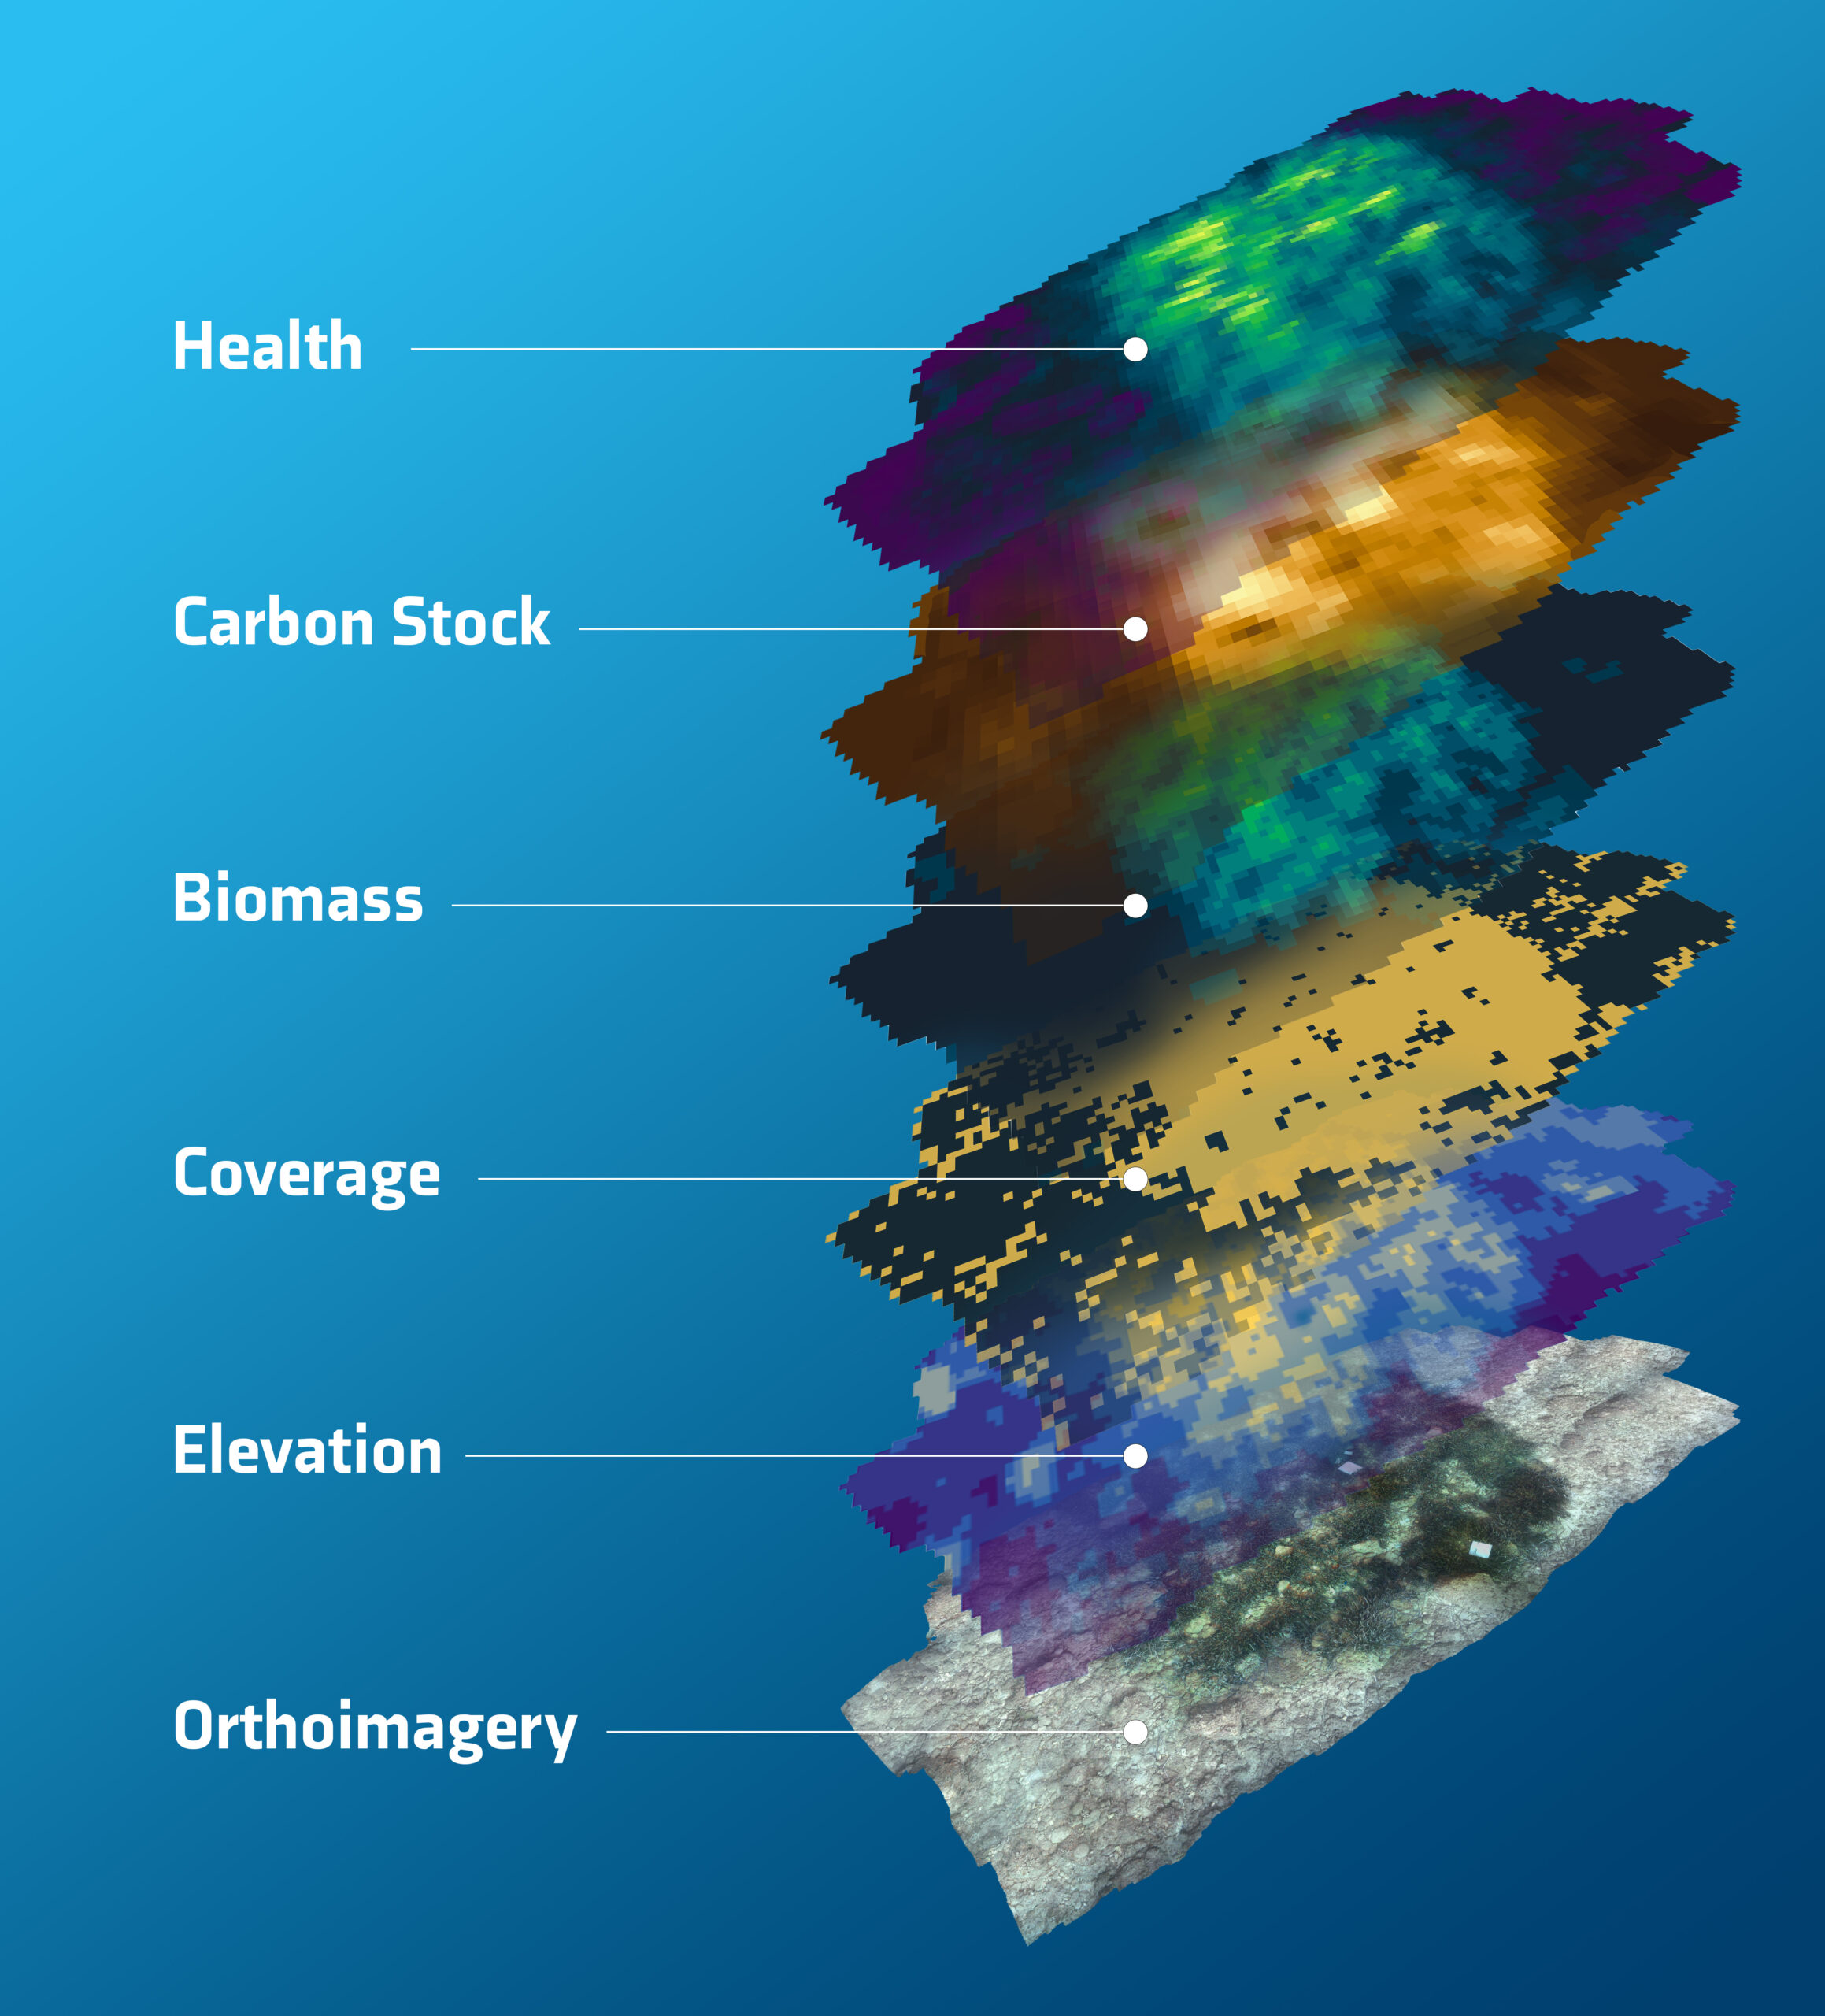
PlanBlue has developed a solution to bridge this knowledge gap (Fig. 1). They combine advanced imaging, underwater navigation, and machine learning into a full automated data processing methodology. The result is geo-referenced seafloor maps, which provide, for the first time, highly detailed insights on health, biomass, carbon sequestration potential, biodiversity, pollution, and human-made materials. The technology is fast and scalable, significantly improving time-to-data from weeks or months to just hours.
This article goes further into the role of the ocean for climate change and food security, the pivotal role of data, the barriers to access this data, and how PlanBlue’s solution can help close the (data) gap. We discuss the challenges they overcame to ensure the results are accurate. Lastly, we will look ahead where the future of these advanced data products can bring us, from adding credibility to the blue carbon market, to delivering data to support aquacultural regulations, and enabling more ecosystem friendly development of offshore infrastructure.
2 The seafloor, an undervalued and underfinanced carbon sink
Seventy percent of Earth’s surface is covered by the oceans. They regulate climate, are major sinks for carbon dioxide, provide food, and support biodiversity. The seafloor, as far as we know, is the best carbon sequester, as it can fix CO2 up to 30x faster than for example trees on land. Notably, seagrass exhibits remarkable carbon dioxide capture efficiency. Despite their pivotal role in mitigating climate change, seagrass meadows face inadequate recognition and protection due to limited data on their health state. For most people seagrass meadows are out of sight, out of mind. They are underrepresented in policy making and finance decisions around climate mitigation. Of all United Nations Sustainable Development Goals, Goal 14 “Life Below Water” has received the least amount of public money (UN, 2022). To tap into the large carbon sequestration potential of the ocean, we need funds for seafloor restoration and preservation projects. Access to credible data is essential to accelerate the blue carbon market, including blue carbon credits and National Determined Contributions (NDCs) to meet the Paris Agreement. Monetizing the seafloor can foster the flow of funding into ocean conservation.
3 Feeding the world, safeguarding access to protein and livelihoods
The oceans feed more than 3 billion people and provide a livelihood for 10–12 % of the world’s population. The global population is still growing and access to protein is high on the agenda of world leaders. Protection of wild fish stocks and their habitats is one piece of the puzzle, aquaculture is by many seen as another. However, aquaculture can have huge destructive consequences for ocean life, for example through nutrient pollution (eutrophication) coming from the farms, affecting the seafloor. There is an urgent need for better legal regulations. Poorer coastal communities remain dependent on nature-based food sources, and poorly regulated aquaculture production jeopardizes their food security.
4 In the dark, knowledge that lies on the bottom of the ocean
To stress how little we know about the ocean, often the comparison is made that we know more about the surface of Mars or the Moon than we know about the ocean floor. For this article, we like to give this statement a little more context and depth.
Seabed 2030, an initiative launched with the sole purpose to map 100 % of the seabed by 2030 was founded in 2017 with the awareness that, at the time, only 6 % had been mapped to an adequate resolution. They defined this as the absence of detailed underwater topography, or bathymetric data. In their most recent roadmap, they state that mapping coverage has increased to nearly 20 %, which they now define more specifically as ‘at a resolution of 1km using the echo sounding method’ as a minimum. So more than 80 % of the world ocean floor is still not mapped to this coarse level.
Jon Copley, Associate Professor of Marine Ecology, University of Southampton, digs a bit deeper into the different levels of detail of seafloor mapping in his 2014 article in The Conversation (Copley, 2014). He wrote this article following the release of the new global map of the seafloor (Witze, 2014) published by David Sandwell of Scripps Institute of Oceanography in San Diego and colleagues. With this map, the entire ocean floor has now been mapped to a maximum resolution of around 5 km, which means we can see most features larger than 5km across in those maps.
However, as Copley states, that global map of the ocean floor is admittedly less detailed than maps of Mars, the Moon, or Venus. This is caused by our planet’s watery veil, as he states it. Or in other words, the water is in the way. NASA, for example, mapped 98 % of the surface of Venus to a resolution of around 100 meters. To map the ocean floor in that level of detail, we can’t use satellites. Modern sonar systems aboard ships, however, can map the ocean floor to a resolution of around 100 meters across a narrow strip below the ship. At the time of the writing of that article, in 2014, about 10–15 % of the oceans were covered to that level of detail.
He goes on that if we want to detect things just a few meters in size on the ocean floor, such as the wreckage of missing aircraft, the mineral spires of undersea volcanic vents, or the state of the marine habitat, we need to take our sonar systems much closer to the seabed. Working with data from closer to the seabed, is exactly what the PlanBlue team sets out to do. To understand the carbon sequestration capacity or the state of biodiversity in the marine ecosystems, we require information at marine habitat level, not just the rough topography of the seafloor. At the time of writing of Copley’s article in 2014, less than 0.05 % of the ocean floor had been mapped to that highest level of detail, which is an area roughly equivalent in size to Tasmania.
5 Mapping the seafloor, measuring habitat features, such as health and carbon
With the explicit goal to emphasize the ecologic and economic value of the seafloor, PlanBlue is processing seafloor data from around the globe, using a novel seafloor mapping solution. Founded in 2017 by two former marine scientists and two engineers to enable high-quality seafloor mapping, PlanBlue replaced traditional seafloor mapping methods with highly automated and scalable processing pipelines. Their goal is to add in-depth information to bathymetric maps, including health state of the seafloor, carbon sequestration potential, biomass, pollution, and biodiversity. The technology is capable surveying anything on the seabed and map a diversity of carbon sequestering ecosystems including corals and seaweeds. PlanBlue doesn’t just aspire to add detail to seafloor mapping, but also to do so at scale.
6 Time is running out, adding speed and scale
As the International Panel on Climate Change (IPCC) and the Biodiversity Treaty of Kunming Montreal make clear, we are running out of time to turn the tide on climate change and protect biodiversity. For this reason, an important part of PlanBlue’s mission is to add speed and scale. Their solution replaces manual processes with automated pipelines, based on state- of-the-art computing and AI.
PlanBlue’s core business is to sell data products. Traditional methods of ground-truthing aerial and satellite data require a time intensive process of in-situ collection of data. This means divers going down with a clipboard, doing line transects, underwater counting, and photo and video assessments. PlanBlue’s technology largely replaces this with near in-situ remote sensing, using hyperspectral cameras and a selection of sensors to correct distortions of the images in the water column. By controlling the entire data chain, they can ensure a seamless and speedy process, even in areas with limited internet access during field campaigns. With the streamlined processes PlanBlue can reduce time-to-data from weeks or sometimes months, to a timeline of days or even hours.
7 A new dimension, adding layers of insights to seafloor mapping
With the ambition to create a comprehensive representation of underwater areas and their changes over time, the first step for PlanBlue is the creation of orthoimagery of the seafloor. Through their automated pipelines PlanBlue’s technology can stitch thousands of images together in less than 24 hours after the collected seafloor data has been uploaded to the cloud. For accurate mapping and meaningful data processing, underwater navigation and geo-location are essential. PlanBlue developed their in-house navigation system that ensures precise positioning of the imagery on the seabed, which is essential for the data processing models, to develop geo-referenced maps, and provide year-on-year comparisons.
As PlanBlue is working with hyperspectral data, another challenge comes in. The hyperspectral camera is a push-broom scanner. Because of this, movement of the camera through the water introduces distortions in the captured images. Using data from the navigation and other sensors, PlanBlue adjusts for that motion as part of the data processing. By doing this, PlanBlue can create an overlay of hyperspectral data on top of an RGB image, generating unique maps of the seafloor.
8 Clearing things up, adjusting for turbid water
This is not the only correction of distortion of the observations that PlanBlue’s technology accounts for. PlanBlue’s near in-situ data collection vehicles are typically operated about two meters above the seafloor. To accurately assess the property of the vegetation or sediment, the observations need to be compensated for the water column between the vehicle and the seabed.
While the space community has worked for decades on compensation for the light traveling through the atmosphere, this kind of work is still in early stages underwater. PlanBlue integrated sensors that gather data required to adjust for different conditions like depth, weather, turbidity, and other environmental circumstances.
For data to be meaningful, it should be comparable over time and across locations. The comparability of the insights was demonstrated by two surveys in the Mediterranean Sea with similar ecosystems, observing the same species of seagrass, Posidonia oceanica (Fig. 2). With environmental circumstances ranging from bright and sunny, to cloudy and rainy and observations at a depth of 5–6 meters in one location to 25–30 meters of depth in another, they were perfect circumstances to confirm the coherence of the findings. With these objective measurements that are agnostic to the conditions encountered in the field or caused by the device, PlanBlue can provide invaluable insights that are essential for effective marine spatial planning, and monetization of the seafloor.

9 A multi-layered picture, turning raw data into calibrated and validated insights
To make the outcomes of the analysis visual, the data processing pipelines generate maps and overlays. Based on photogrammetry, PlanBlue provides an accurate elevation model of the scanned area, with a resolution of 1 cm × 1 cm and a vertical accuracy in the sub-cm range. These maps can be used to validate existing bathymetry data of lower resolution and serve as the foundation for example for calculating the canopy height of a seagrass meadow. This can then be used to estimate seagrass biomass. The next overlay distinguishes living and attached seagrass meadows in the orthoimagery, generating a data set that provides the coverage of seagrass as a percent value. PlanBlue is also working on incorporating additional benthic organisms and (human-made) structures into this overlay. Consequent layers can provide a reliable estimation of above-ground seagrass biomass, in kg/m2 and the quantification of carbon content (estimated in kg/m2) within seagrass meadows, operating at a spatial resolution of 10 cm × 10 cm.
Ultimately, they add a seafloor health overlay. The hyperspectral camera can look beyond the mere structure of the seafloor. Through a range of (pre-determined) indices, the data can provide a unique insight into the health and productivity of seafloor habitats, like seagrass meadows. This includes for example chlorophyll data, which helps to determine species’ health. The comparability of the data over time, makes it possible to visualize seasonal changes in marine ecosystems, which are instrumental to better understand the behavior of these valuable habitats, and measure the impact of policy interventions.
10 Adding credibility to marine conservation efforts
The insights about the health, biomass, and density of seagrass, and other key vegetation of the seafloor, can revolutionize marine conservation, preservation, and restoration. Knowing not just whether seagrass, kelp, or coral is present or not, but also the state it is in, can ensure policy makers’ focus on the areas where most impact can be made.
For example, unhealthy seagrass meadows can become net emitters of CO2 and other climate gases, while healthy seagrass sequesters carbon up to 30 times faster than a rainforest. Thorough assessment of seagrass meadows (Fig. 3) can take Blue Carbon projects to the next level and provide the credibility that is needed to attract investors and accelerate the market.
Projects aiming to increase biodiversity require robust baseline information and methods to assess impact for them to be of interest to investors and to be prioritized by governments. New initiatives that intend to enhance biodiversity in offshore energy projects can attract interest of investors with sustainability mandates, and for example issue blue bonds.
Monetizing the seafloor is a viable approach to ensure enough financial means come in to protect and restore these vital ecosystems. However, reliable monitoring and evaluation methodologies are required to get access to these financial advantages.
Another example of use can be found in advancing the developments of aquaculture in a responsible manner. Although by many seen as a key solution, expanding large scale aquaculture has severe risks. To manage this, policy makers are working to improve regulations. Without accurate data this is an impossible task. PlanBlue’s habitat maps can provide standardized data to base new regulations on.

11 Scientific review of the results
While one of PlanBlue’s unique selling points is to significantly scale up the detailed data on the seafloor in a short period of time, added speed and scale are of little value when the outcomes are not accurate, comparable, and meaningful. Scientific validation of the methodology is at the center of the development of PlanBlue’s work. The rigor of the data analysis methodology has been developed and tested in collaboration with internationally renowned research institutes and local experts. Two of these studies have recently been published in peer-reviewed articles.
An article in the journal Restoration Ecology discussed a study of the Université Côte d’Azur in 2020 (Riera et al., 2023), to assess the effectiveness of artificial reefs to simulate natural habitats. The study compared old artificial reefs, with 3D-printed artificial reefs, and natural reefs. PlanBlue’s seafloor habitat mapping technology was used and assessed as part of the study.
The study concluded that PlanBlue’s technology was able to identify the relative differences in the signals of the ecosystem in different habitats, and reduce human effort and time required for these underwater observations. In the study, one diver could sample 24 transects on five different sites at 30-m depth over 3 days, much faster than traditional methods. There were recommendations on how to further enhance visual cross-identification in low light conditions that have since been implemented in the current version of PlanBlue’s technology. Another opportunity that was identified for further development was using spectral fingerprinting to distinguish between photosynthetic and non-photosynthetic organisms. This was an area of focus in the field study with University of Guam, USA, in 2019.
The results of that study were published in Scientific Reports (Mills et al., 2023). The focus of this collaboration with the University of Guam was to assess whether PlanBlue’s technology can be used for effective surveying and monitoring of coral reef ecosystems. The team surveyed eight reefs in Guam, USA, and used two approaches for benthic classification. PlanBlue’s method was compared with manually conducted surveys to determine the accuracy and utility as a proxy for reef surveys.
The findings show that if a well-annotated library is available, underwater hyperspectral imaging can be used to quickly, repeatedly, and accurately monitor and map dynamic benthic communities on tropical reefs using broad benthic categories.
12 Conclusion
PlanBlue’s underwater geo-spatial technology is driving a transformation in the blue carbon industry and seafloor habitat monitoring, speeding up the protection of vital marine ecosystems with almost instant, credible, and accurate data. The seafloor plays a critical role in regulating climate, absorbing carbon dioxide, and supporting biodiversity. However, it remains an undervalued and underfinanced carbon sink, lacking detailed information to drive meaningful conservation efforts.
PlanBlue has tested and improved their innovative seafloor mapping solution, with local partners and international research institutes. Equipped with hyperspectral and RGB imaging capabilities, the company has successfully created objective ground truth data, that provides insights into seafloor health, biomass, carbon sequestration potential, biodiversity, pollution, and human-made materials. The potential of the methodology has been validated in peer-reviewed academic studies, and ongoing collaborations continue to advance the underlying analysis and technology. With reliable data, investors and policy makers can focus their efforts where they can make the most significant impact, both economically and ecologically.
References
Copley, J. (2014). Just how little do we know about the ocean floor? The Conversation. http://theconversation.com/just-how-little-do-we-know-about-the-ocean-floor-32751 (accessed 20 February 2024).
Mills, M. S., Ungermann, M., Rigot, G., den Haan, J., Leon, J. X. and Schils, T. (2023). Assessment of the utility of underwater hyperspectral imaging for surveying and monitoring coral reef ecosystems. Sci. Rep., 13, 21103. https://doi.org/10.1038/s41598-023-48263-6
Riera, E., Hubas, C., Ungermann, M., Rigot, G., Pey, A., Francour, P. and Rossi, F. (2023). Artificial reef effectiveness changes among types as revealed by underwater hyperspectral imagery. Restor. Ecol., 31, e13978. https://doi.org/10.1111/rec.13978
Witze, A. (2014). Gravity map uncovers sea-floor surprises. Nature. https://doi.org/10.1038/nature.2014.16048
UN (2022). Accelerating Investments in SDG 14 and the Sustainable Blue Economy. UN Department of Economic and Social Affairs. https://sdgs.un.org/events/accelerating-investments-sdg-14-and-sustainable-blue-economy-48934 (accessed 15 March 2024).