
Abstract
Preamble
The following work was presented at the Hydrographic Conference HYDRO 2023, 7–9 November 2023, Genoa, Italy in the oral session Collaboration and Partnership, Quality, Enabling Technologies and Ocean Literacy.
1 Introduction
Hydrographic offices are collecting hundreds of terabytes of data every day. This hydrospatial information not only comes from bathymetry data sensors, but also from weather stations, radar, ships, satellites, aerial and drone imagery, and other sensors. With all this data pouring in, hydrographic offices need to be able to automate time consuming processes and adopt new technologies. One such technology is called GeoAI, the intersection of spatial data and artificial intelligence. GeoAI is an enabling technology, in that it allows you collect the data once and apply different algorithms to the data for it to be used for multiple purposes. Data collected from multibeam echo sounders can be analyzed to update Electronic Navigation Charts (ENCs) by finding hazards to navigation, new obstructions such as rocks and shipwrecks. Using that same point cloud, GeoAI can then be used to understand marine animal habitat by identifying underwater structures and seafloor patterns that lead to increased biodiversity. GeoAI can be used to aid in coastal resilience projects by analyzing Satellite-Derived Bathymetry (SDB) data and/or aerial imagery from drones captured in multiple seasons and years for change detection, highlighting the areas that need the most attention. Machine Learning, a part of the GeoAI portfolio, can additionally use that same imagery data set to run predictive analytics, highlighting areas that are susceptible to sedimentation, erosion, flooding, and landslides. Many of the same GeoAI algorithms can be used to help maximize investments in the blue economy by bringing location intelligence to the decision-making process. Models can predict the best locations to establish aquaculture, Marine Protected Areas, and offshore energy production in the hydrospatial domain.
In addition to its applications in coastal resilience projects and maximizing investments in the blue economy, GeoAI offers a wide array of benefits in the domain of hydrospatial data management (Hains et al., 2022). The integration of GeoAI in hydrographic offices revolutionizes the way hydrographic data is processed and utilized. Traditionally, processing and interpreting vast amounts of hydrospatial data, including bathymetry, weather, radar, and imagery, required extensive human resources and time-consuming manual efforts. However, with GeoAI, these offices can automate complex tasks and streamline data analysis, significantly improving efficiency and accuracy.
This paper also aims to answer the question, how? by outlining the systems that need to be in place, the architecture of those systems, and the methodologies required for this analysis. The presentation at HYDRO 2023 used a few of the use cases above as examples to clarify the workflows. It also showed how a modern GIS, a platform that includes desktop, server, and web components, is essential to taking advantage of GeoAI capabilities.
2 What is GeoAI?
GeoAI is the application of Artificial Intelligence (AI) fused with geospatial data, science, and technology to solve geographic based problem sets (ESRI, 2024). AI can be considered an umbrella term for any task performed by a machine that would traditionally require human intelligence, such as perception, reasoning, and learning. To solve spatial problems, we typically turn to two types of AI, Machine Learning (ML) and Deep Learning (DL). Machine learning is a subset of AI that refers to techniques that allow computers to learn patterns withing data and acquire knowledge without being explicitly programmed to do so. As a subset of Machine Learning, Deep learning uses a specific machine learning process called an artificial neural network which is inspired by the layered approach to learning taken by the human brain. The relationship between AI, ML, and DL is best illustrated by the diagram Fig 1a. Spatial analysis tools are integrated with AI Models to help them find patterns, find anomalies, and make predictions. Geographic problems are solved through spatial analysis by using vector data, image and raster data, spatiotemporal statistics, and modeling. A non-exhaustive list of Spatial Analysis techniques is shown in Fig 1b. Put simply, the combining of AI techniques and spatial analysis is GeoAI. GeoAI, therefore, is not a product to be bought and sold, but an integrated method for conducting spatial analysis using the power of computers. As Machine Learning is the method that is best fit for the hydrospatial data collected by hydrographic offices, the focus will be on that process.


3 Machine learning
Machine learning has been tagged as “Revolutionizing”, or “Game Changing”. Removing that hyperbole, Machine learning can be used for five main tasks: Extracting features from imagery and LiDAR, finding patterns and clusters, detecting anomalies, extracting insights from unstructured text, and making predictions. As hydrographic organization are being asked to go beyond chart production and provide additional hydrospatial services such as supplying scientific data, reporting on vessel traffic patterns, and using data to protect and promote the blue economy, leveraging some or all these capabilities becomes essential. For organizations that are beginning their journey of fulfilling these new mandates, the swirling of terms, processes, and technologies can be overwhelming. To get the most return for their efforts and investment, leveraging machine learning and deep learning algorithms integrated with image analysis tools.
4 Image classification
Image analysis is an excellent gateway into the realm of GeoAI for many organizations. Looking at the types and formats of data collected by the hydrographic survey teams and the types and formats of data available to them from other government entities, it is easy to see why. From imagery collected by drones, planes and satellites to data collected by various flavors of echosounders and LiDAR scanners, these offices are sitting on virtual mountains of data in raster or point cloud format. These data formats are rich in information just waiting to be extracted. Furthermore, with GeoAI, the notion of imagery can be expanded to include the visual output from echosounders and the raster output of multidimensional raster datasets.
Image analysis takes many forms, but the end goal is to extract information out of an image. The classic image analysis technique is image classification in which analysts quantify the identification of features or objects in Imagery Classification is lumped into two categories, Supervised or Unsupervised, depending on the interaction with the analyst. Supervised classification involves creating training samples to “teach” the ML algorithm what it needs to find in the imagery or how to classify groups of pixels with the same value. This method can be a more time consuming as you need to create the training samples yourself until you have a representative amount for each class you want to detect. The reward is usually a more accurate result as it is comparing known quantities. There are three main supervised classification algorithms to know and they are simplified here. Maximum Likelihood (ML), Artificial Neural Network (ANN), and Support Vector Machines (SVM). Maximum Likelihood works by calculating a probability score based on the value of the pixel. The pixel gets assigned to the class with the highest probability score (NV5, 2024). Neural Networks are built to function similarly to the human brain. Like your brain, it contains numerous nodes (neurons) that are connected in layers of experience. By leveraging the “experience” of each layer the algorithm makes a guess on the value of the node, checks if the guess was correct. This “path” to the answer is given a higher value. For each data point this feedback loop is repeated until all the pixels have been classified (AWS, 2024). Support Vector Machines work similarly to Neural Networks in that they have input and output layers, but it also considers the number of features in the input data set to find the optimal sets of classification (IBM, 2023). SVM has been found to be more accurate in smaller datasets (Pal & Mather, 2005).
In supervised classification methods the analyst needs to have some subject matter expertise to create viable training samples. In a real-world example, this could be a workflow for identifying the characteristics of the sea floor as it can be used to distinguish between rock, sand, and vegetation which can aid in undersea cable routing or sea life habitat studies. The analyst would provide the samples of what each region “looks” like and feed those into the algorithm. Another example would be shoreline delineation. At the mesh point of land and sea, the littoral zone provides a great opportunity for the usage of GeoAI. The analyst can create training samples of what the water pixels look like and what the land pixels look like. We could even go as far as assigning soil type attributes to the shoreline by comparing the spectral signatures of different materials.
Unsupervised classification, as its name implies, does not rely on input from the analyst or training samples. Instead, it uses clustering algorithms based on the spectral characteristics of the image to assign the classes. The most common of these algorithms is K-Means Clustering (Madhugiri, 2022). K is the only value needed for input and reflects the number of classes in which to sort the pixels. In the Land Classification example, it is necessary to separate water, impervious surfaces, and pervious surfaces, so K would equal three. A centroid is selected for each cluster and distances are calculated. The centroid the methodology, but it is good background information. Unsupervised classification has a couple advantages, one is analysts do not need to create training data as input. Second, it can quickly detect patterns that may be difficult to detect otherwise. These advantages make unsupervised classification perfect for exploratory analysis or anomaly detection (Madhugiri, 2022). In a real-world example, this could be leveraged to find shipwreck or plane crash debris from rasters generated from echo sounder point clouds. Simply point the algorithm at a folder full of images and tell it to look for anything abnormal. This method, however, is less accurate as the algorithm treats all anomalies as equals.
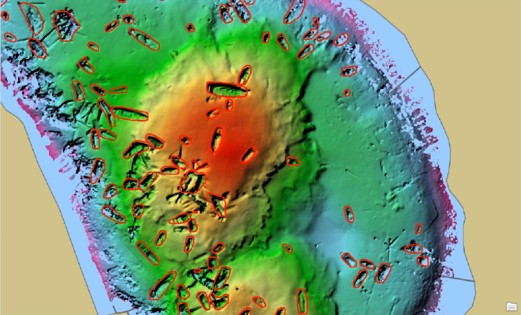
Another method that needs to be discussed is the Object Based Imagery Analysis (OBIA). The key to OBIA is segmentation. Segmentation can mimic the way the human eye can pick out certain objects by grouping similar pixels into objects, rather than assigning individual pixels to classes (GISGeography, 2023). Due to the initial segmentation, objects are classified not only by their spectral signature, but also their shape, size, and spatial properties. Buildings, cars, swimming pools, etc. are all objects that are easily detected by OBIA. For hydrographic purposes, shipwrecks are an example, as are coral reef or sea grass patches. The method for detecting shipwrecks has been well documented by Rohit Singh and Vinay Viswambharan of Esri (Singh & Viswambharan, 2020). The goal of their research was to update the S-57 Chart with new shipwrecks after a disaster such as a hurricane. Manually searching for and digitizing all of the shipwrecks would have been a herculean effort as their study area represented over 100 km2. in Jamaica Bay, NY. By combining segmentation methods with supervised classification, they were able to identify 100s of uncharted wrecks (Fig. 2).
GeoAI does not need to constrained to search for stationary objects on the sea floor. Vessel traffic monitoring is now a common task that has been laid at the feet of hydrographic offices. GeoAI models can be used to detect moving vessels and reconstruct their paths to understand patterns in a given port. Likewise, fragile ecosystems can be monitored with space-borne sensors. Vessels that turn their AIS off hoping to avoid detection can still be found. As seen in Fig. 3, the spectral signature of a vessel (bright white) is easily distinguishable from the black of the sea surface. This imagery is from Synthetic Aperture Radar (SAR) which can penetrate cloud cover and does not rely on light from the sun. Meaning, that critical areas can be monitored in all types of weather and all times of day. By employing GeoAI to sort through the noise, humans only need to be notified if there is a new detection.

5 The case for GIS
The advantages of using GeoAI are numerous. Hydrographic offices can save time and money when updating charts and providing datasets to the public. They can also spare manpower to aid in the conversion to S-100 standards. For all the clarity on the advantages brought by GeoAI, machine learning, deep learning, etc., how to leverage these tools is much less apparent. Integrating GeoAI into your workflows is not without challenge. New skills need to be developed, potentially new hardware needs to be purchased, and legal hurdles need to be cleared. However, the barrier of entry can be lowered by turning to a modern Geographic Information System (GIS). The modern GIS, such as ArcGIS produced by ESRI contains a multitude of tools, wizards, and pretrained models that enable the analyst to leverage GeoAI methodologies in a comprehensive package. From Image management, to training and running the models, to deriving insights, you only need one system. Many users get what they need from a single desktop application called ArcGIS Pro. Analysts do not have to run the analytics in one application, interpret the results in another, and share them in yet another application.
The models, algorithms, and methods described above involve complex mathematics and statistical modeling techniques that have been limited to use by data scientists and statisticians. Using a modern GIS, such as ArcGIS, allows the everyday GIS analyst to leverage the power of GeoAI by using tools that have the algorithms already built-in. For example, the Image Classification Wizard in ArcGIS Pro can take the analyst from training sample creation, to training the model, all the way to final classifications. GIS also can reduce the time it takes to create the training samples for supervised classification. The ArcGIS Living Atlas has over sixty pre-trained models, including shipwreck detection and models for detecting moving vessels. Vessel detection models can be used over streaming datasets for real-time monitoring in traffic management situations or even run on a schedule, only alerting humans if there is a detection as seen in Fig. 4 of an ArcGIS Dashboard. Pre-trained models can also be retrained to cope with the challenges presented by new geographies. With GIS and an integration with Python it is possible to organizations to create their own domain specific models, with the only limitation being the imagination of the analyst.

6 Closing
Hydrographic offices need to be able to meet their main mission of providing for safe navigation for the waters in their country while also meeting the changing of political wills along with the demand for data and analysis. They are constantly being asked to do more with less or unchanging budgets. They must also prepare for the migration to S-100 standards. With all of these pressing needs occurring simultaneously, these offices need to leverage new technology. GeoAI and the associated methods and algorithms provide the tools needed for these organizations to be more efficient in their daily work. GeoAI also provides many options and opportunities for automation. Examples include creating a data pipeline to update S-57 and S-100 charts from the same source data, creating seafloor classification from side scan sonar point clouds, and monitoring coastline changes. GIS provides the starting point and the system for taking advantage of the efficiencies to be gained by using GeoAI. Using GIS, offices can leverage supervised, unsupervised, and object-based classification to find uncharted hazards, detect new patterns from older datasets, and create authoritative mapping of the sea floor for use by other scientific organizations.
References
AWS (2024). What is a neural network?. Amazon Web Services, Inc. https://aws.amazon.com/what-is/neural-network/ (accessed 1 February 2024).
ESRI (2024). What Is GeoAI? | Accelerated Data Generation & Spatial Problem-Solving. https://www.esri.com/en-us/capabilities/geoai/overview (accessed 1 February 2024).
GISGeography. (2023, September 6). Obia – object-based image analysis (GEOBIA). GIS Geography. https://gisgeography.com/obia-object-based-image-analysis-geobia/
Hains, D., Schiller, L., Ponce, R., Bergmann, M., Cawthra, H. C., Cove, K., Echeverry, P., Gaunavou, L., Kim, S.-P., Lavagnino, A. C., Maschke, J., Mihailov, M. E., Obura, V., Oei, P., Pang, P. Y., Njanaseelan, G. P., Sharma, S. L. (2022). Hydrospatial – Update and progress in the definition of this term. The International Hydrographic Review, 28, pp. 221–225. https://doi.org/10.58440/ihr-28-n14
IBM (2023). What are support vector machines (SVMs)?. The International Business Machines Corporation. https://www.ibm.com/topics/support-vector-machine (accessed 1 February 2024).
Madhugiri, D. (2022). Unsupervised learning in Image Classification – Everything to Know. https://www.amygb.ai/blog/unsu-pervised-learning-in-image-classification (accessed 1 February 2024).
NV5 (2024). Maximum Likelihood. Maximum likelihood. NV5 Geospatial Solutions, Inc. https://www.nv5geospatialsoftware.com/docs/MaximumLikelihood.html (accessed 1 February 2024).
Singh, R. and Viswambharan, V. (2020). Detecting Shipwrecks Using Deep Learning. https://www.esri.com/arcgis-blog/products/arcgis-pro/analytics/detecting-shipwrecks-using-deep-learning/ (accessed 1 February 2024).
Pal M. and Mather, P. M. (2005). Support vector machines for classification in remote sensing. International Journal of Remote Sensing, 26(5), 1007–1011, https://doi.org/10.1080/01431160512331314083