


Abstract
1 Introduction
The International Hydrographic Organization’s (IHO) report Status of Hydrographic Surveying and Charting Worldwide (IHO, 2023) reveals that within the depth range of 0–200 metres, 23 % of Canada’s territorial waters are completely unsurveyed, and 66 % require further resurveying. This is especially true in the Arctic, where an internal report (HDACoE, 2023) states that the estimated gaps in Canada’s 100-m resolution bathymetric data elevation model are 87 % in the eastern part of the Arctic and 93 % in the western part.
This situation can be explained twofold: first, Canada has the longest coastline in the world and huge amounts of navigable waters within its boundaries, and second, the Canadian Hydrographic Service (CHS) does not have the resources to survey and chart all these waters. Consequently, CHS decides “which waters to survey and chart in priority, depending on relevant considerations, such as safety of navigation, efficiency and density of maritime traffic, natural features of the area (tides, currents, winds, geography, and hazards), access to ports and waters for oceangoing vessels” (DFO-CHS, 2022).
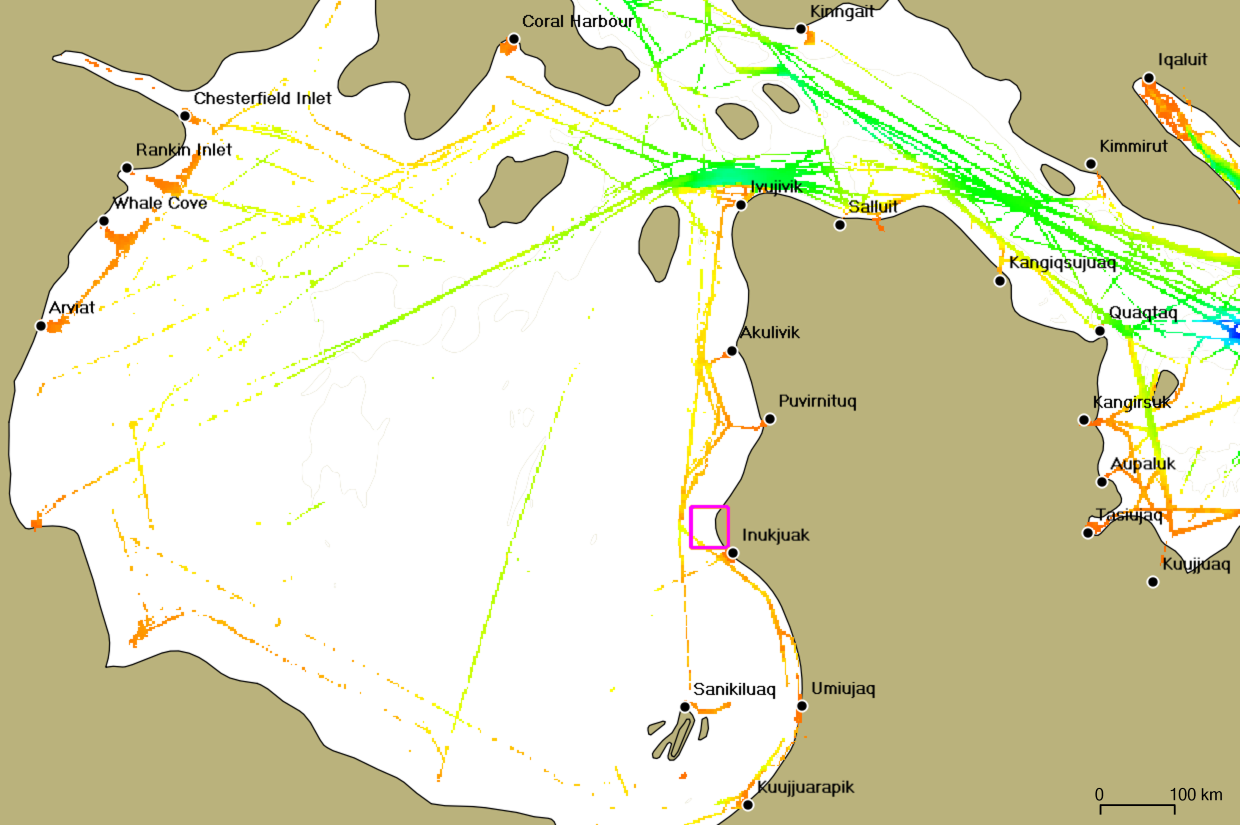
An example of this approach that is specific to the Arctic is the clearly successful strategy implemented under the Phase 1 of the Ocean Protection Plan (OPP). It involved focusing the CHS’ efforts on the corridors used by merchant vessels (Fig. 1, right). As a result, from 2016 to 2022, the CHS succeeded in increasing its bathymetric coverage in the primary and secondary shipping corridors (of the NORDREG Zone specifically) by 12 % (Marshall, 2022), bringing coverage of the latter to 42 % of completion.
Though they obviously depend on shipping corridors for supplies, communities mainly use the nearshore areas for travel, hunting, and fishing. Coastal routes offer shorter transit time and are less exposed to winds and swells and are therefore more convenient for smaller boats. However, these community-used areas, which are often shallower and dotted with shoals and underwater rocks, remain largely unsurveyed (Fig. 1, left).
Though focusing on securing the main shipping corridors, the CHS is attentive to the needs of coastal communities. This is why, the CHS enhanced its contribution to the “Improving Maritime Safety” pillar under Phase 2 of the Ocean Protection Plan (OPP), by creating the Community Hydrography Program. The Program aims to “support Indigenous and coastal communities in the collection and use of bathymetric data to improve the collective understanding of the ocean floor in poorly studied areas” (DFO-CHS, 2023). Section 2 of this paper begins with an overview of past and current community hydrography initiatives in Canada. The method we propose and detail here is aligned with the Community-Led Engagement for Adaptability and Resilience (CLEAR) approach (Stewart, 2023), which proposes to start adaptability and resilience to climate change efforts by fully understanding coastal communities’ needs and cultural practices.
This approach lays the groundwork for the Community Hydrography Program, which the CHS launched in 2022 and that will be presented in Section 3. This latter briefly introduces the concepts for implementing the Program that stem from the takeaways of past and current initiatives. A special focus will be put on the importance of communities seeing rapid results. In Section 4, we will delve into how such a quick turnaround for communities has been efficiently attained, using three main strategies: rapid data routing, automated processing and quality data analysis, and assisted data valorization in the form of bathymetric community maps. Section 5 will examine the case study of Inukjuak Marine Region (IMR) to illustrate how these strategies have come together for community benefit.

2 Community hydrography in Canada: an overview
The first known reference to supporting Canadian coastal communities in bathymetric data collection – the BAThyWeb 2.0 proposal (Roche et al., 2011) – dates back to 2011. Although not implemented, BAThyWeb 2.0 had already theorized, more than ten years ago, the type of solution we see today. It consisted of three segments: bathymetric data acquisition, processing, and dissemination. The data acquisition segment was based on a modified low-cost multibeam fish echosounder for depth measurements, linked to a smartphone for position, time and attitude measurements, as well as for data transmission via a cellular network. The data processing segment was based on a web service approach using open-source software to correct data with predicted tides and synthetic sound speed profiles. The data dissemination segment was based on a web portal offering quality management and visualization tools.
Since 2011, coastal communities’ interest in bathymetric data collection has grown exponentially. We will start by tracing the evolution of notable community hydrography initiatives in Canada, presenting these initiatives in chronological order.
2.1 Fitch Bay, QC – Memphremagog Conservation (2017)
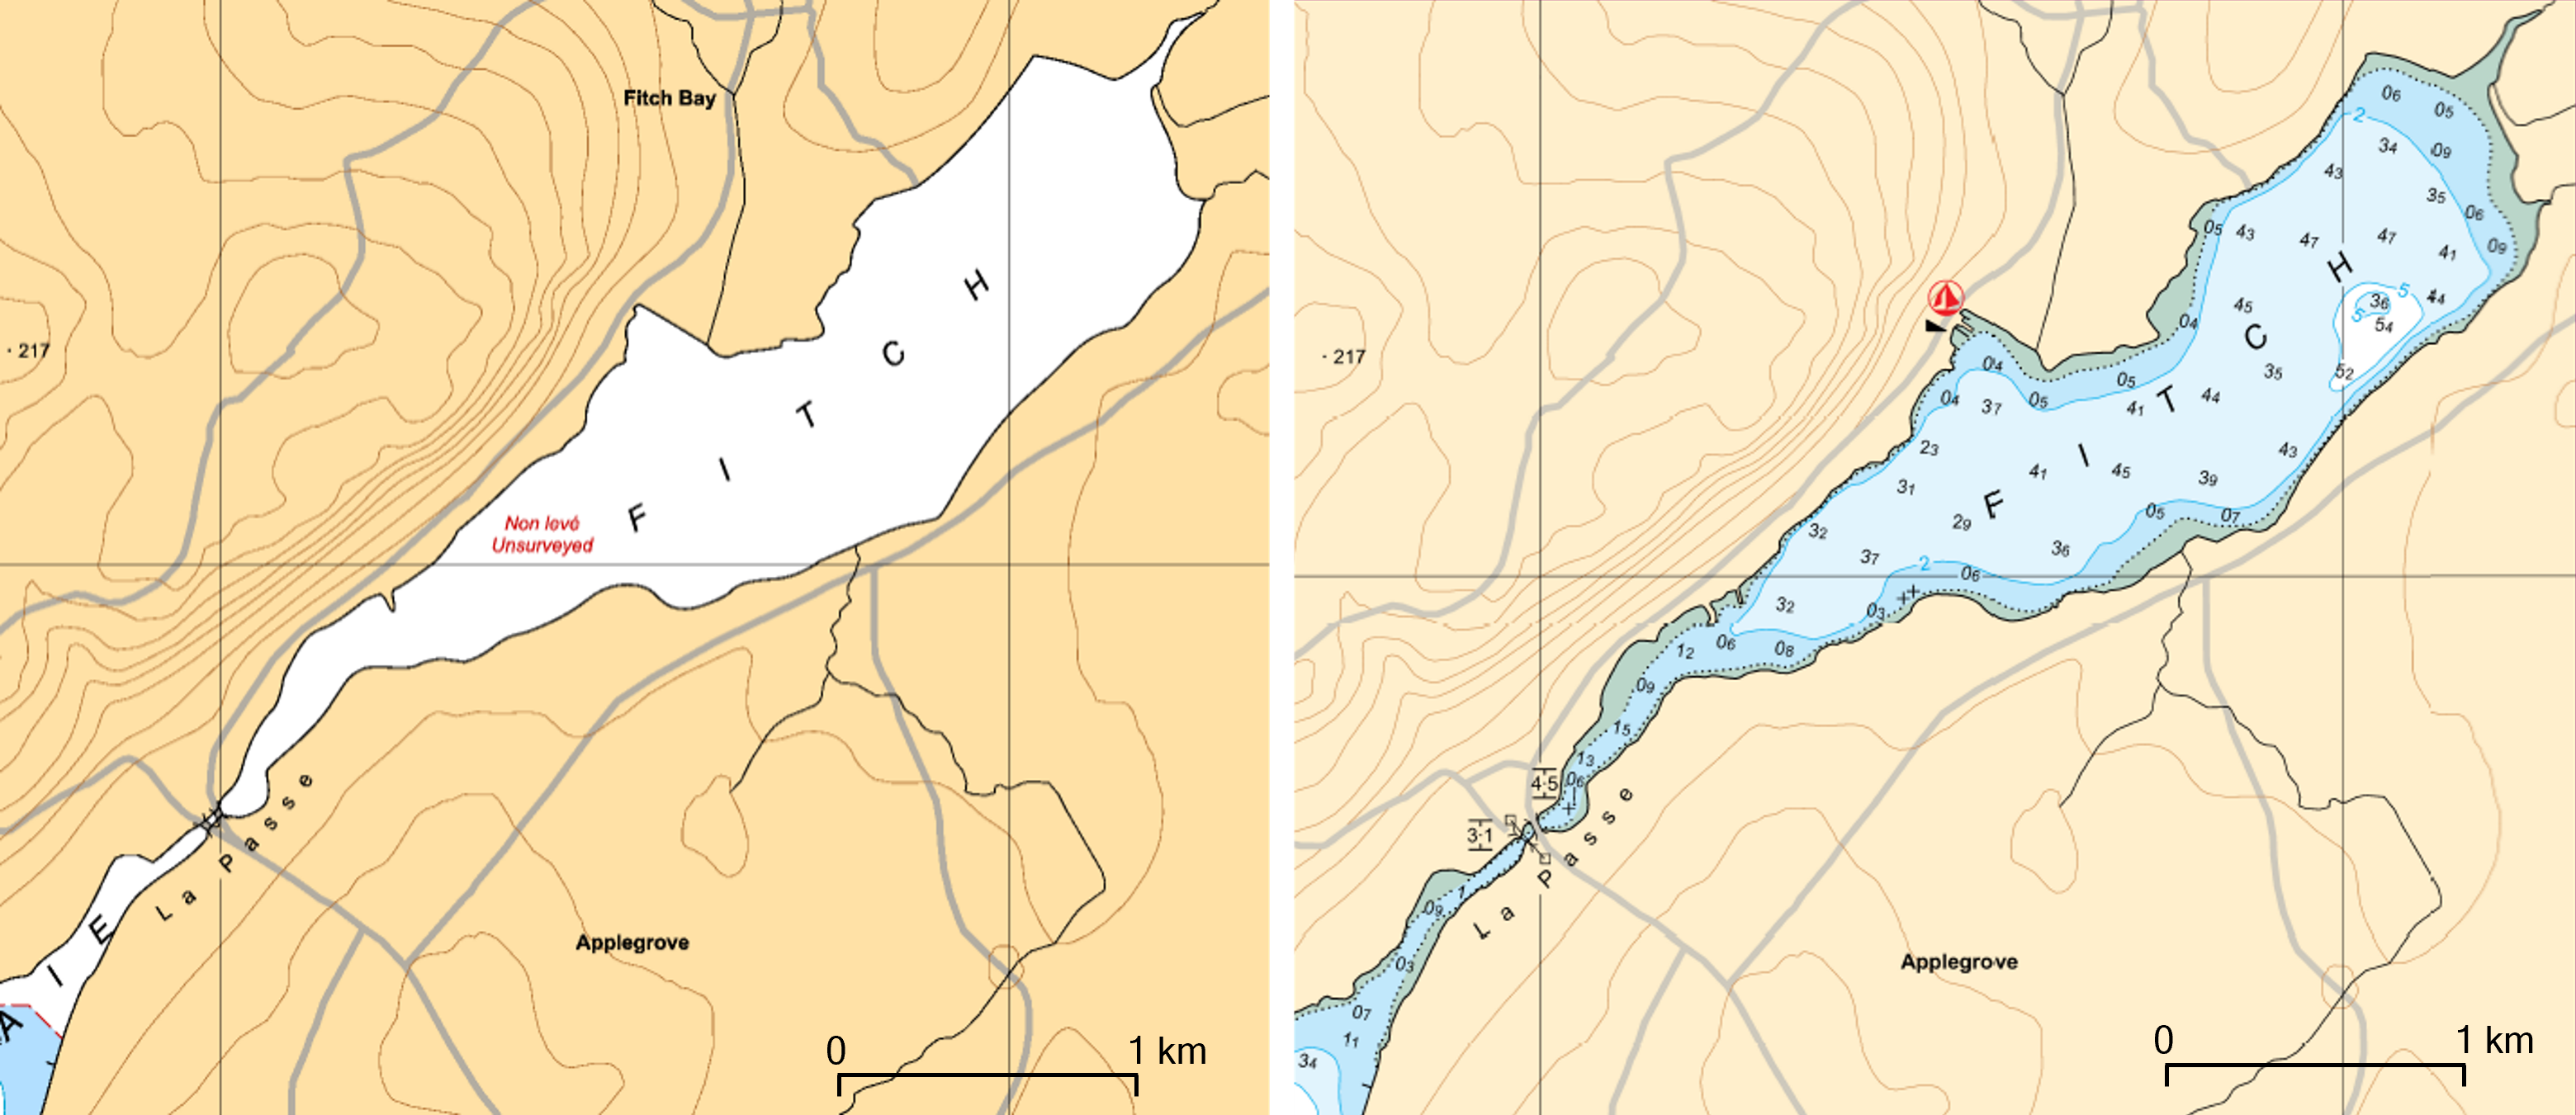
In 2017, the non-profit Memphremagog Conservation requested the CHS to conduct a bathymetric data collection campaign in Fitch Bay of Lake Memphrémagog. Its objective was to gain bathymetric knowledge of this unsurveyed bay, to improve oversight and regulation of navigation, and thus to reduce the impact of waves generated by power-driven pleasure craft along the shore. The CHS loaned two HydroBalls and trained two Memphremagog Conservation employees on bathymetric data collection. The data was then processed by the CHS and the official chart of the lake was updated (Fig. 2). Seeking to strengthen community capacities in hydrographic data collection, this initiative was the first of its kind documented at the CHS (Côté et al., 2018).
2.2 Crowd-Sourced Bathymetry in Northern Canada, COMREN (2017–2019)
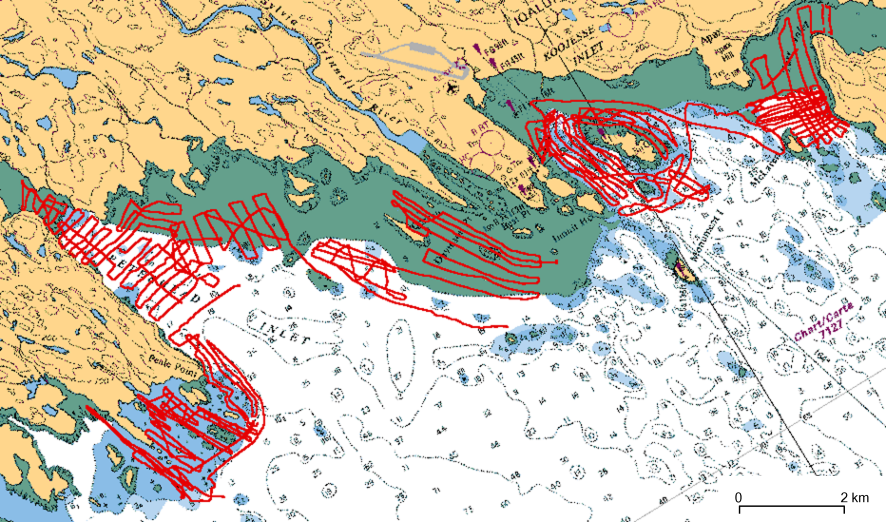
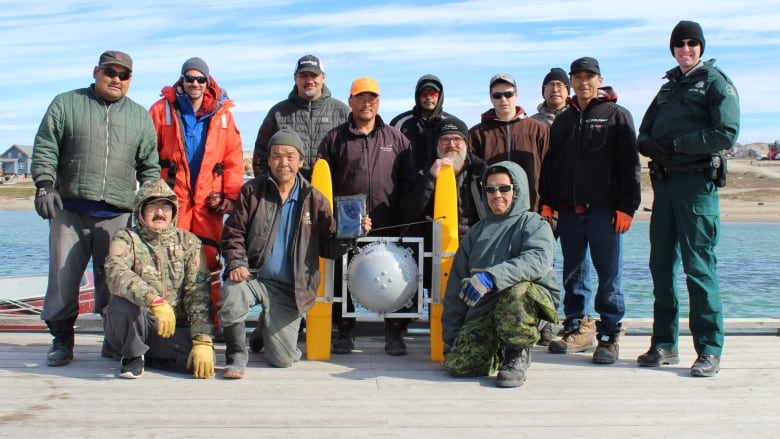
From 2017 to 2019, efforts were made in three communities under the Crowd-Sourced Bathymetry in Northern Canada project funded by the Fund for Innovation and Transformation. The three communities were: 1) Quaqtaq, QC; 2) Gjoa Haven, NU; 3) Iqaluit, NU. Bilingual workshops (English/Inuktitut) were offered to introduce interested participants to crowdsourced bathymetry concepts and benefits, as well as to explain how to deploy the HydroBall and HydroBox bathymetric data collection systems (Desrochers, 2018; Desrochers et al., 2020). In each community, surveys were carried out by trained participants (Figs. 3 and 4).
Here are the four main takeaways from the project report (COMREN, 2019):
- The report validated the concept of pre-qualified bathymetric data collection systems (HydroBall, HydroBox). These systems allowed individuals without expert knowledge and minimal training to collect high-quality data (IHO orders 1b and 2) (Rondeau & Malouin, 2019). However, several areas of improvement were suggested, such as increasing the HydroBall’s survey speed to over four knots, simplifying HydroBox installation with a “universal” pole mount, enhancing compatibility with the NMEA 2000 protocol, automating data transfer when Wi-Fi is available, and reducing acquisition costs to improve accessibility.
- The report delivered a prototype of an automated processing workflow for crowdsourced bathymetric data collected from GNSS-capable loggers (Arfeen, 2019). Additionally, it pointed out the need for developing a water-level reduction algorithm to accommodate data handling from loggers with low-grade positioning capabilities.
- The report referred to an attempt made to create and disseminate maps to the communities via a web portal.
- The report suggested a review of the capacity-building approach used during the project. The usual academic-style support materials (lectures and course notes) for training has shown mixed results and may not be adequate. More interactive media, such as video and animation, should be considered. The report also emphasized the importance of having a local coordinator and that monetary compensation may not be enough to ensure participant engagement. Instead, focus should be placed on tangible results and ongoing evaluation of participants’ efforts and work.
2.3 Arviat, NU – Aqqiumavvik Society (2020–2021)
The community of Arviat, Nunavut, is located on the west coast of Hudson Bay. It is subject to post-glacial rebound. As the seafloor rises, new shoals emerge, increasing safety risks during navigation. Largely used by community members, the nearshore is unsurveyed for the most part.
In spring 2020, under the leadership of the Aqqiumavvik Society, the community of Arviat acquired the means to chart the seafloor in areas of interest to its members (Tagalik, 2022). The community approached the CIDCO R&D centre and the company M2Ocean to buy a HydroBlock bathymetric data collection system, and to receive training and support for collecting, processing, and validating bathymetric data. The community carried out two survey campaigns in 2020 and 2021, and subsequently, two maps were created (Figs. 5 and 6).
The data was transferred to the CHS and to the Data Centre for Digital Bathymetry (DCDB) via M2Ocean, which acted as a trusted node, a necessary intermediary for the DCDB transfer. The data transferred to the CHS were loaded into the National Bathymetric Database (BDB) and appear in the latest Non-Navigational (NONNA) bathymetric data compilation.
With support from M2Ocean, the Aqqiumavvik Society partnered with SIKU, a social network devoted to Indigenous knowledge sharing, to make the two maps available on the SIKU mobile app.
Arviat is a flagship project and an eloquent example of community capacity building for collecting and validating bathymetric data. The strength of this initiative, which has been widely discussed and shared (Baker et al., 2021; Desrochers, 2021; Katz, 2022; Trethewey, 2023), lies in the community’s willingness to move the project forward.


2.4 Rankin Inlet, NU – Canadian Coast Guard (2021-ongoing)
In 2019, the Canadian Coast Guard (CCG) made a request regarding the need to position uncharted shoals (on CHS navigational charts) along the coast between Chesterfield Inlet and Whale Cove in Nunavut. The goal was to ensure safe navigation for search and rescue vessels that must operate in nearshore areas during the navigation season. Offshore, a secondary shipping corridor is charted to link these communities, but a 10–20-nautical-mile strip along the coast is still unsurveyed.
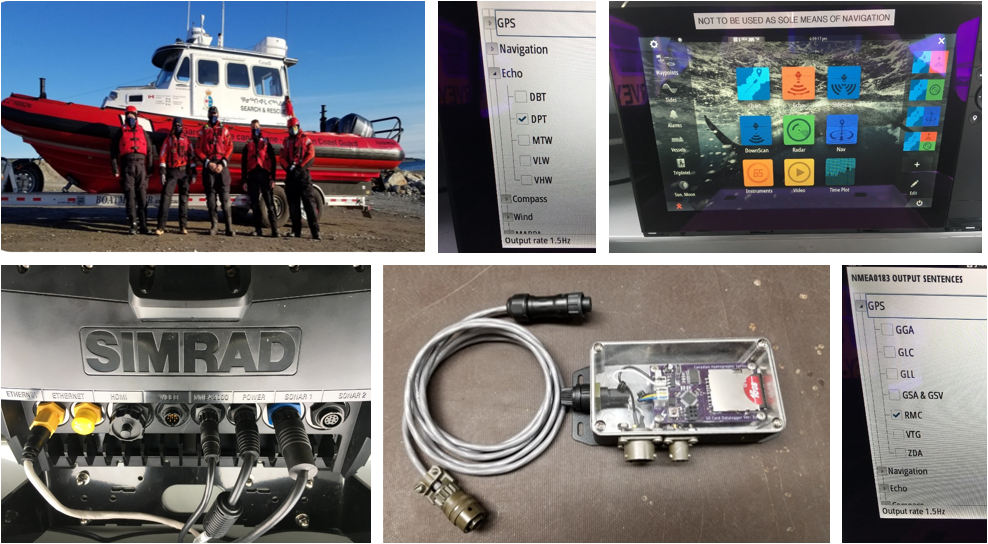
In response, the CHS designed a low-cost bathymetric data logger, called the BlackBox, to equip both CCG Arctic and CCG Auxiliary search and rescue vessels to collect their own bathymetric data.
The BlackBox can be connected directly to navigation instruments and record positional measurements (latitude and longitude), depth, anjustd time. The first logger was installed onboard a CCG search and rescue vessel (Rosborough Roughwater 9.11) at the Arctic Marine Response Station in Rankin Inlet, Nunavut. The data logger was still collecting bathymetric data as of 2023 (Figs. 7 and 8).
An internal report highlights challenges with data routing. On at least one occasion, the data logger’s Secure Digital (SD) card was lost in the mail, causing data to be lost. The report suggests data should be transferred by internet to eliminate the need to mail SD cards and thus mitigate such issues in the future. In addition, this approach would streamline the data routing process to processing facilities and expedite data validation.

2.5 Aklavik, NT (2021–ongoing) – Tuktoyaktuk, NT (2022–ongoing)
Several companies manufacture navigational instruments for the recreational boating and fishing markets, including plotter/sounders. These consist of a multi-function display connected to at least an echo sounder and a GPS receiver. Increasingly, the recreational boaters and anglers are using this equipment to collect their own data and produce and share their own navigation charts in areas with little or no official chart coverage. Companies of note in Canada include:
- Garmin, with the ActiveCaptain crowdsourced bathymetry platform and Navionics SonarChart;
- Lowrance, with the C-MAP Genesis crowsourced bathymetry platform; and
- Humminbird, with the LiveShare Map crowsourced bathymetry platform.
We should mention that these companies operate on a service-based business model by which crowdsourced bathymetry data is re-shared with all service subscribers.
The communities of Aklavik and Tuktoyaktuk, both located in the Inuvialuit Settlement Region (ISR) in the Northwest Territories, have chosen to rely on this approach for their respective projects.
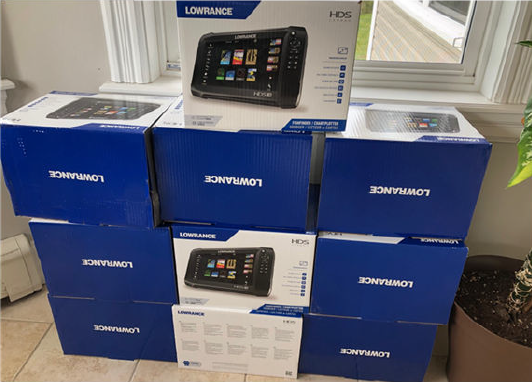
In 2021, Aklavik launched a community-based mapping project (Gruben et al., 2022) that was initially funded by Crown Indigenous Relations and Northern Affairs Canada (CIRNAC) to better understand the rapidly changing waters of the Mackenzie Estuary. The community purchased off-the-shelf recreational sports-fishing-grade sonars (Lowrance HDS; Fig. 9) to equip a fleet of 14 local boats. The local boaters collected 10,400 km of linear opportunistic data. This data was then uploaded into the cloud-based C-Map Genesis platform to create bathymetric maps. These maps are available to view through the publicly accessible C-Map Genesis Social Dashboard.
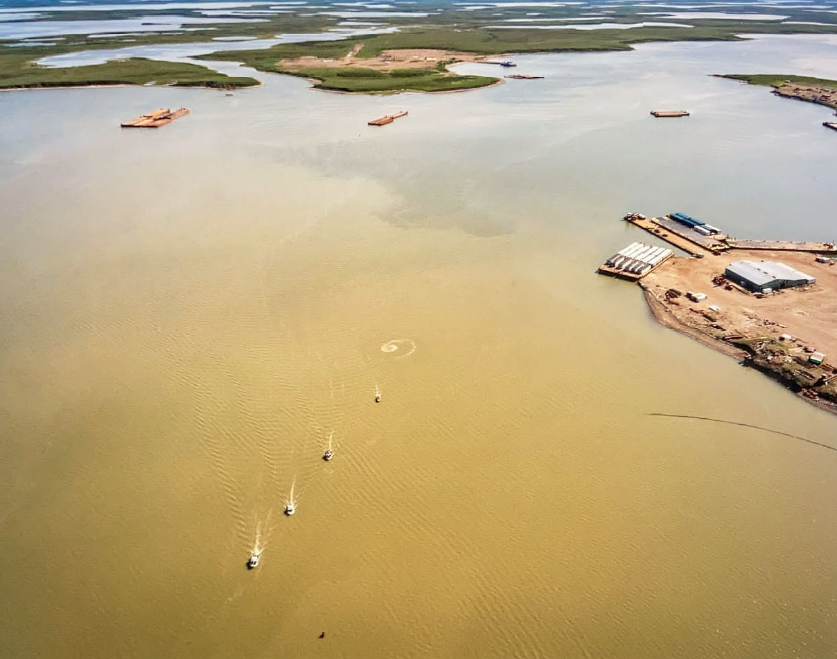
With support from the CHS, Tuktoyaktuk was able to secure funding to conduct their own community-based bathymetry project in 2022. The project took an approach similar to that used in Aklavik: five off-the-shelf sonars (Lowrance HDS) were used to collect bathymetry data using a systematic approach. A coordinated effort was implemented by local boaters to acquire data along prescribed survey lines and areas (Fig. 10). In its first year, the program was able to hire local coordinators to help process and visualize the data in real-time. Real-time feedback of the data and resultant mosaics created a community of practice for sonar operators in the community.
2.6 Paulatuk, NT – Anguniaqvia niqiqyuam Marine Protected Area (2021–ongoing)
The Anguniaqvia niqiqyuam Marine Protected Area (MPA) is the second MPA in the Canadian Arctic to be designated under the Oceans Act, and the first with a conservation objective based solely on Indigenous knowledge.
Bathymetry is recognized as a foundational layer to physical and biological oceanography, which is central to the understanding of MPAs. However, in 2021, the Western Arctic Marine Protected Area Steering Committee, the Anguniaqvia niqiqyuam Marine Protected Area Working Group, and DFO Science identified significant gaps in bathymetry and baseline habitat surveys used to inform the Anguniaqvia niqiqyuam MPA conservation and monitoring strategies. In response to this, a three-year Competitive Science Research Fund (CSRF) project was established by DFO Science, the CHS, and the Paulatuk Hunters and Trappers Committee (PHTC).
To support this project, the CHS: 1) loaned out two portable Norbit multibeam hydrographic survey systems and two bathymetric data loggers; 2) provided training; and 3) supported the community in collecting and processing data to create community maps.
The data collected is bound by a data-sharing agreement articulated around the Ownership, Control, Access, and Possession principles (OCAP®).
2.7 Summary of past initiatives and lessons learned
Hydrography is a complex field of science that requires a specific set of skills for collecting (IHO, 2017a and 2018a) and processing (IHO, 2017b and 2018b) hydrographic data. For this reason, in Canada, the earliest community hydrography initiatives primarily relied on the use of pre-qualified survey systems like the HydroBall (Leighton, 2019). During this initial stage, external projects proponents (universities, research centres, and departments) usually hire community members as subcontractors to assist in data collection. This approach results in a low community engagement.
Over time, a shift to community capacity building was observed. Workshops and training sessions, sometimes given in Inuktitut, were organized. Communities were consulted and their feedback influenced the evolution of data collection methods and tools. However, the main focus stayed on data collection training, with data validation tasks handled externally. While projects were still initiated by external proponents, an increase in community engagement was noted as community members’ participation was encouraged and facilitated.
Since 2020, a noticeable change in leadership has been observed. Communities such as Arviat, Aklavik and Tuktoyaktuk have equipped teams for autonomous bathymetric data collection. Despite strides in data collection, these communities still rely on external support for data validation.
In 2022, the community of Paulatuk, NT, addressed a concern about data sovereignty common in Indigenous communities by protecting their data with a data-sharing agreement. This solution adheres to the principles of Ownership, Control, Access, and Possession (OCAP®), as defined by the First Nations Information Governance Centre (FNIGC, 2010), and as such was a milestone in the evolution of community hydrography initiatives.
3 Deployment of the CHS’ Community Hydrography Program
Community hydrography is an evolving process with technological improvements and lessons learned from past projects informing future work. Reviewing the past initiatives and meetings with various players has helped develop the current Community Hydrography Program around the following four takeaways.
3.1 Data sovereignty
OCAP® principles are of high importance. It is absolutely essential to ensure both the databases and the platforms hosting the communities’ data are secured and aligned with the OCAP® principles. While this can be perceived as counter-intuitive to the open-data concepts promoted by government organizations, applying these principles is a non-negotiable element when building trust with Program participants.
3.2 Synergy with existing initiatives
Communities are heavily solicited. A multitude of projects are presented to them by various federal and provincial agencies, groups, and universities. Consequently, some communities express fatigue and confusion about the number of projects they are asked to participate in. Therefore, it is recommended to align with or fit into programs and initiatives that are already well established in these communities. For example, the Canadian Coast Guard (CCG) and CCG Auxiliary fleets can provide vessels and participants that could be put to use for bathymetric data collection efforts. Similarly, the Enhanced Maritime Situational Awareness (EMSA) portal at Transport Canada, already well implanted and widely used in many communities, could be leveraged for presenting the collected bathymetric data.
3.3 Adequate support
Initiatives focused on academic training have not been particularly successful. The design of training activities and materials should be in line with a given community’s prevailing culture. For instance, a “Western” approach, which is often based on theoretical lessons and paper-based training materials, has not worked well. Knowledge-transfer through demonstration, oral transmission, and experience-sharing, however, has shown better results. A more hands-on approach requires building a relationship and meetings in person. Furthermore, support should not come only in the form of training. To fully engage in collecting bathymetric data, communities need resources. The cost of operating a survey vessel is significant and should not be overlooked. And, as motivated as they may be, community members must be compensated for the time they devote to planning, data collection, and administering the project. The Community Hydrography Program provides resources to some degree (DFO-CHS, 2023).
3.4 Rapid results
To retain and even increase community engagement, it is important for results to be seen quickly. Bathymetric data collection requires a lot of effort and the subsequent steps leading to data utilization should be expected to take time. However, when results from collection efforts are slow in coming or do not come at all, communities disengage from the initial partnership, look for more reactive partners, or try to re organize on their own.
4 Method
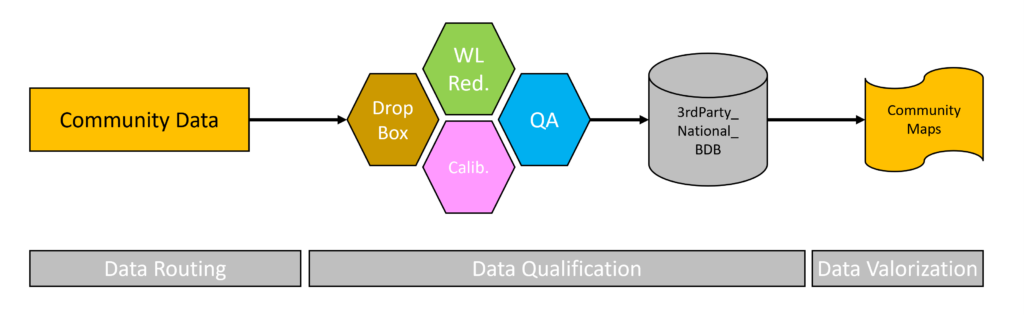
Rapid results seek to reduce the time between data collection and its use without skipping the necessary steps of data processing and validation. Rapid results involve optimizing the time it takes to turn raw data collected by a community into qualified data – that is, data with associated uncertainty – all without losing community engagement (Rondeau et al., 2023). To achieve this, action can be taken at three points in the data value chain (Fig. 11): 1) rapidly routing data from the collection area to a secure data warehouse (Section 4.1); 2) transforming raw data into qualified data using a dedicated processing and quality analysis infrastructure (Section 4.2); 3) converting the qualified data into a value-added product, such as a bathymetric community map (Section 4.3).
4.1 Data routing
As observed in several past initiatives, the manual routing of data hinders rapid results. Therefore, automated data transfer from the vessel to the data warehouse should be preferred. However, considerations of limited connectivity and control over the data lead many communities to prefer offline data loggers. The Community Hydrography Program relies on three types of loggers: the CHS BlackBox, the OFM Mussel Kit and the UNH WIBL. The CHS BlackBox is a basic data logger manufactured in-house. Its current version has no connectivity capabilities. The OFM Mussel Kit is a data logger manufactured by the Canadian company Orange Force Marine (OFM), which works with a subscription-based CSB data collection service. The OFM Mussel Kit is leased to the client and the data collected is transferred to the cloud when in cellular range, where it is processed and made accessible to the client via the Terradepth platform. The OFM solution has been successfully deployed as part of the Lakebed 2030 initiative, supported by the Great Lakes Observing System (GLOS). The Wireless Inexpensive Bathymetric Logger (WIBL) is an open-source project led by the University of New Hampshire (UNH) (Calder et al., 2018; Calder, 2023a). The WIBL data logger has open source hardware and software, and its designs and code are shared on a BitBucket directory (Calder, 2023b).
4.2 Data qualification
Community hydrography data is managed in a dedicated infrastructure where data from the loggers can be safely received, stored, processed, qualified, assessed, and returned to the communities. The infrastructure consists of: 1) a Dropbox™ repository; 2) a processing module for the reduction of water levels; 3) a calibration module that calculates and applies correction for vessel’s draft; 4) a validation/quality assurance module; and, 5) a storage module referred to as the 3rdPartyBDB. The processing workflow has been prototyped in Python language, coupled with Caris HIPS and Caris BE command line libraries, PostGIS and spatial Python libraries. Currently the workflow is functional in the Caris environment with plans to modify some modules within the workflow in the future, so that they are functional outside the Caris ecosystem and can be made available to any community wishing to use this workflow independently.
The workflow for the above-described infrastructure is detailed step by step as follows:
In Step 1, data is deposited on the Community Hydrography team’s Dropbox™ repository. The files must contain, at a very minimum, the time, date, latitude, longitude, and depth for each measured sounding.
The files can be deposited manually (in the case of a data logger without telecommunication capability) or automatically (if the data logger has telecommunication capability). Currently, CHS BlackBox, OFM Mussel Kit and UNH WIBL are the supported data loggers. As soon as a file is deposited in the repository, it is detected and downloaded onto the CHS network, and an email is sent to the Program team to inform members that data is ready for processing.
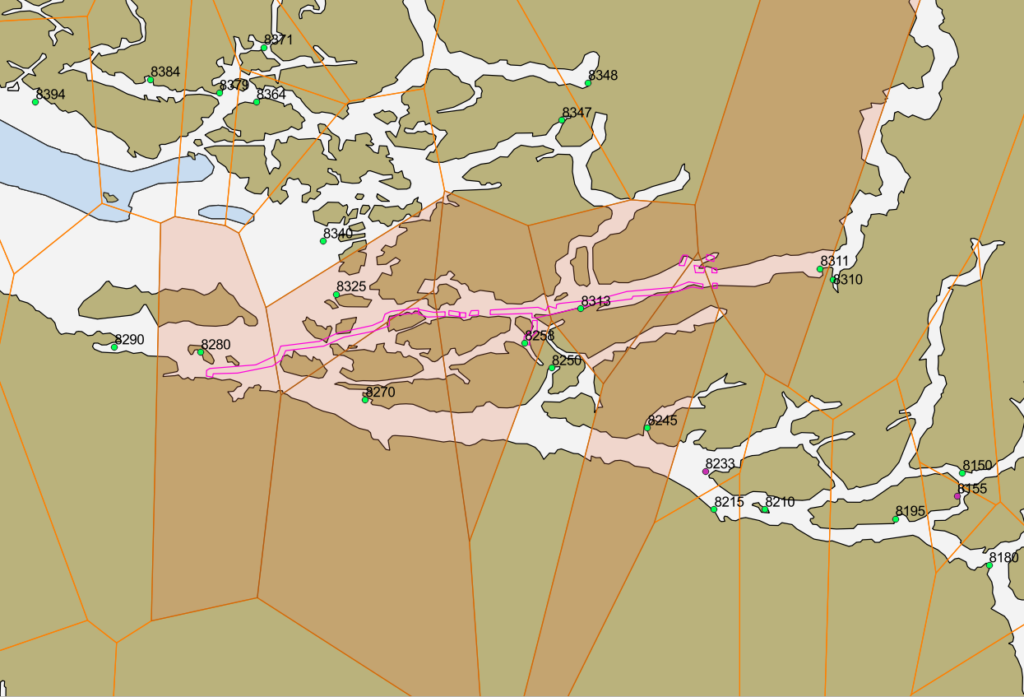
In Step 2, data is reduced for water levels. The approach used is similar to that proposed by NOAA (Klemm & Krabiel, 2023). The Integrated Water Level System (IWLS) web service is queried to receive the position of all available tide gauge stations in Canada at the time of the request. A global influence map using the Voronoi polygon principle is then built for all of Canada (Fig. 12). Each Voronoi polygon represents the area of influence of its associated tide gauge station.
The bounding polygon of the dataset to be reduced is then superimposed on the global influence map (Fig. 13). The Voronoi polygons that touch the survey envelope are retained, and the associated tide gauge stations are queried to see if observation and/or prediction data are available for the time period covered by the dataset. The observation data will be prioritized for a tide gauge station responding with both observation and prediction data.
If a tide gauge station does not respond for observed or predicted tides for the requested time period, its Voronoi polygon is removed and a new influence map is generated (Fig. 14).

= stations for which predictions are available. Pink = stations for which observations are available.
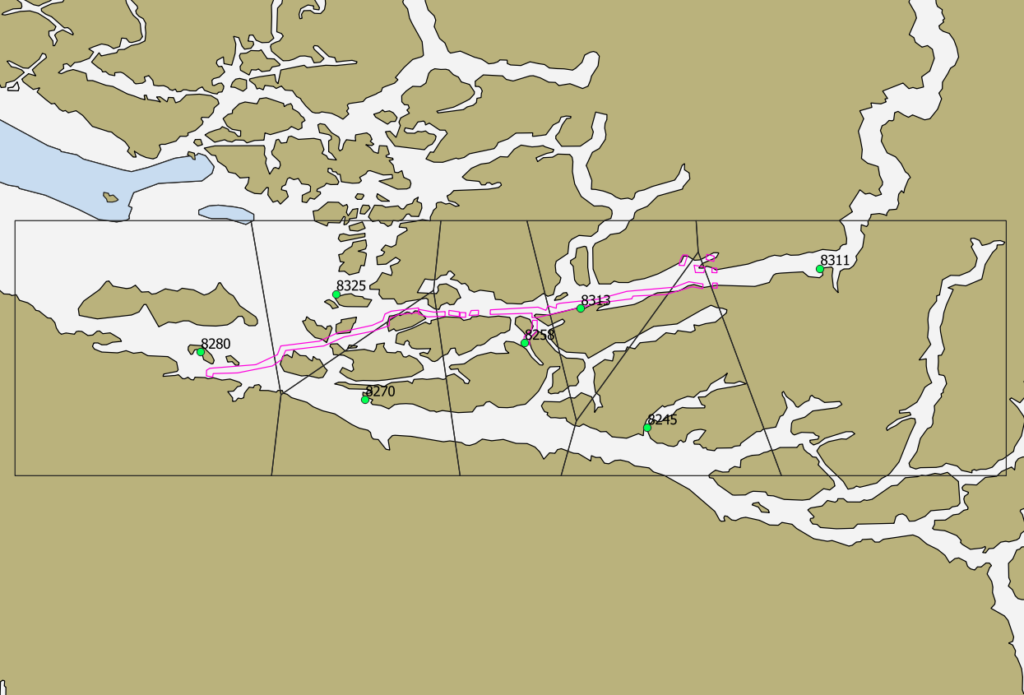
The current approach has certain limitations, particularly in complex coastal areas. A more sophisticated method is currently being considered. This method would no longer rely on the area of influence to select tide gauge stations, but rather on the search for the shortest routes (from soundings to closest tide gauge), all while taking into account constraints related to the coastline’s morphology, such as the prohibition of crossing a land area.
This processing section ends with the generation of a bathymetric surface at 10-, 15-, or 20-m resolution, according to the user’s choice, vertically referenced to Chart Datum.
In Step 3, data is calibrated for the vessel’s draft. Even though it is possible for the user to configure a ship geometry file, the calibration module is relevant for correcting residual errors in the draft measurement or even estimating it completely if the boat’s geometry is unknown. The idea is to systematically compare the dataset to be calibrated with the best bathymetric surfaces available in the CHS databases, as referred to as peer-consistency assessment in Section 4 of B-12 (IHO, 2022). Here again, the implementation principle is similar to that proposed by NOAA (Klemm & Krabiel, 2023). The bounding polygon of the dataset to be calibrated is used to query all the qualified CatZOC A1 bathymetric surfaces available in the CHS regional databases. A surface difference is calculated for each overlapping CatZOC A1 dataset. A graph and statistics are generated for each overlap. The average of the overlap differences is calculated and a shift value is proposed for application. The user running the script must either accept or deny application of the shift.
In Step 4, the bathymetric surface and its metadata are loaded into the dedicated 3rdPartyBDB.
4.3 Data valorization
For community hydrography data to be fully utilized, it must be transformed and represented in the form of a value-added product, such as a map. In the past, the creation of bathymetric maps was a complex, labour-intensive process, necessitating specialized knowledge and tools. However, recent research and developments in cartography have made this task more accessible. A significant example of this progress was observed during the Speed Mapping Challenge (COMREN, 2022), which took place at the Canadian Hydrographic Conference in 2022. This competition demonstrated the feasibility of rapidly producing bathymetric maps using open data and free software. The innovative solution of the winning team was subsequently presented in (Kastrisios et al., 2023).
Building on this demonstration during the Speed Mapping Challenge, the Program team offered its support in developing a plugin to the QGIS software. This plugin helps communities to draft bathymetric community maps, using both their own bathymetric data and open data of interest (Fig. 15).
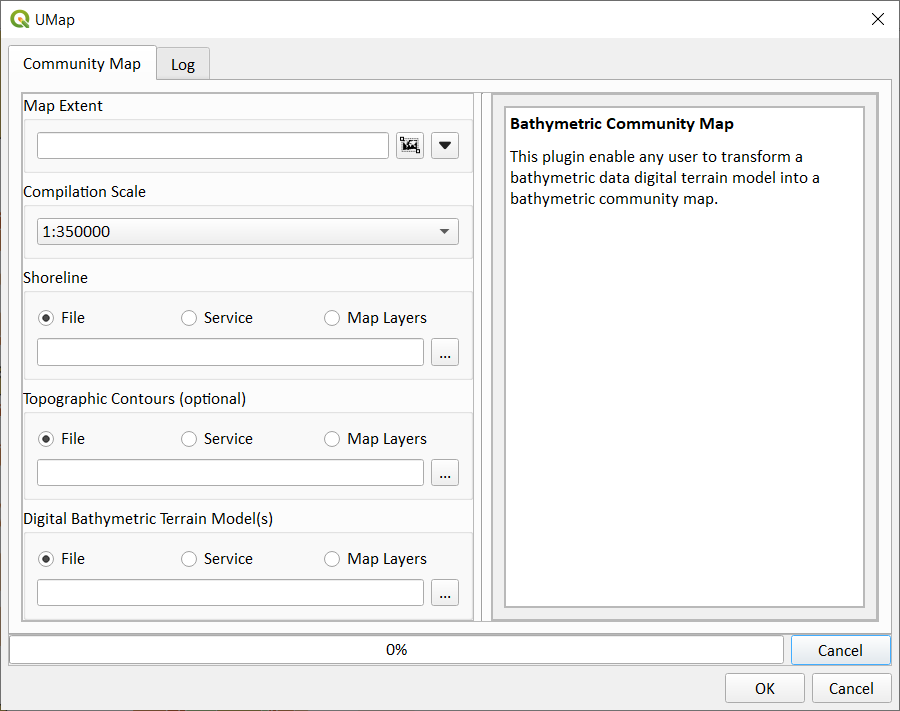
The plugin, named UMap, requires three inputs: 1) the extents of the area of interest to be mapped; 2) the coastline of the area of interest; and, 3) one or more bathymetric digital terrain models.
Users are suggested a compilation scale, depending on the area of interest extents, from the scales 1:8,000; 1:12,000; 1:22,000; 1:45,000; 1:90,000; 1:180,000; 1:350,000. The coastline can be provided as a URL link to a Web Feature Service (WFS) or as a vector file. The bathymetric digital terrain models can be provided as a URL link to a Web Coverage Service (WCS), like NONNA in Canadian territorial waters, or as raster files.
Based on the input data, the plugin can produce a community bathymetric map composed of a shoreline, land areas, bathymetric contours, depth areas, and a sounding selection. Four main behaviours have been coded:
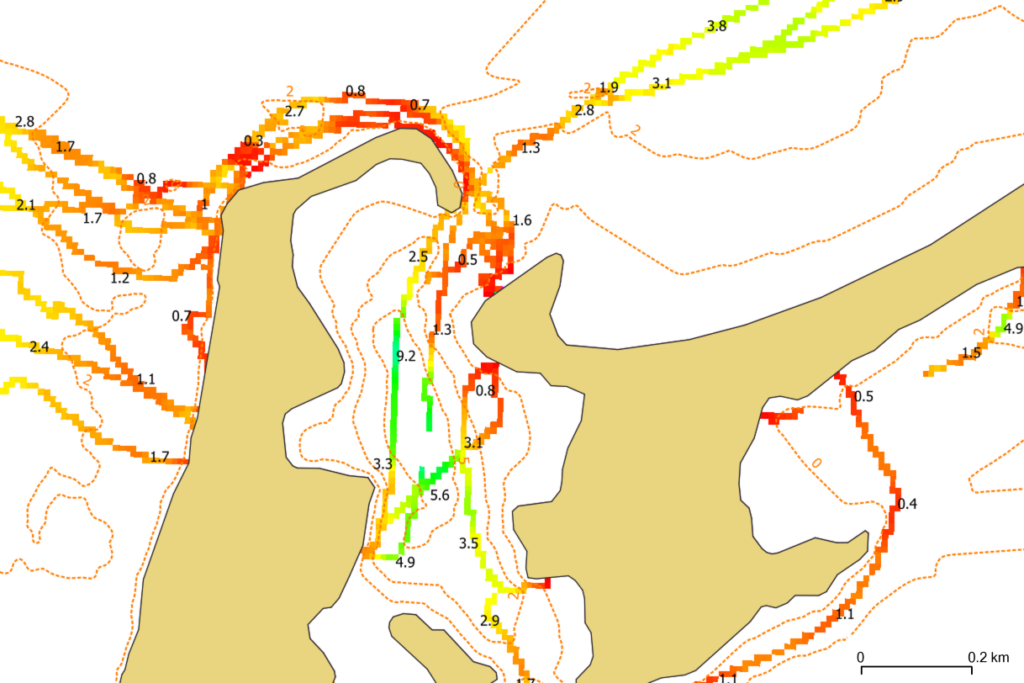
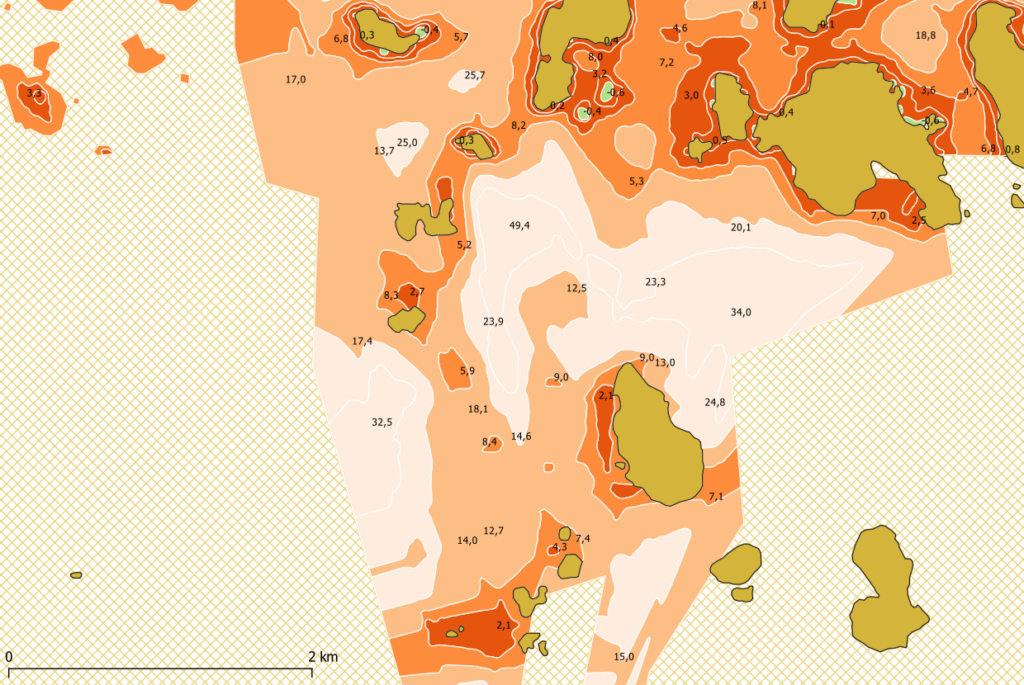
The maps created with the UMap plugin are referred to as “community maps” (Fig. 17), which we define as follows:
- Vertical adjustment: The vertical reference to the map will be that of the reference bathymetric digital terrain model (DEM). If multiple bathymetric DEMs are provided, users must choose the DEM to act as reference. The other DEMs are then shifted toward the reference DEM to ensure overall consistency.
- Deconfliction: In cases where multiple bathymetric DEMs overlap in the same area, the DEM showing the shallowest bathymetry is preferred.
- Management of partially covered areas: In the case of partially covered areas (commonly known as “spaghetti surveys”), the bathymetric contours are interpolated and adjusted with dotted lines. However, sounding selection is forced on measured data only (Fig. 16).
- Contours and sounding selection creation: A good bathymetric map is a simplified but accurate representation of the underwater landscape. With a judicious choice of contours and soundings, a good map will facilitate its users’ comprehension of the general configuration of the seabed topography. In the context of a bathymetric community map production, for purposes other than navigation, the plugin focuses on the following two main principles during the contour generation and sounding selection stages:
a. the bathymetric contours and sounding selection must complement each other for map legibility, and
b. the sounding selection must be limited to show least depths (delineated by a depth contour), shoals, deep and supportive soundings.
“A community map is a map that is created by and for a specific community to support its better understanding of the seafloor topography in a given area. It is most often constructed from open data (for example, non-navigational bathymetric NONNA data in Canadian waters), and can also incorporate data collected by the community. The map uses distinctive symbology to differentiate itself from official navigational products. As it does not adhere to the standards and norms established by hydrographic organizations, a community map is not an official navigational product and should not be used as such.”
5 Results
The Inukjuak North Marine Corridor is an eloquent illustration of the method detailed in this paper. The Northern Village of Inukjuak is a municipality on Inuit lands in Quebec, on the eastern shore of the Hudson Bay. Inukjuak faces the same challenges as the above-mentioned community of Arviat, its neighbour across the bay. As post-glacial rebound occurs all around Hudson Bay, coastal areas are becoming progressively more dangerous for harvesters and other land users. The ever-present reality of shallows transform into shoals, and shoals into islands is the norm.
The project took place in the so-called Inukjuak Marine Region (IMR), a vast, secluded area between Innaliit qikitailu Inutjuap taqrangani, a long north-south island chain [also known as the Hopewell and other islands north of Inukjuak] and the Nunavik mainland on the eastern shore of Hudson Bay. This area is almost completely unsurveyed. The available bathymetric data is very old, if not completely non-existent, which, hinders daily activities in the community. In fall 2023, Inukjuak’s community members who showed interest in increasing their knowledge of their area’s seafloor topography received support from CHS’ Community Hydrography Program.
5.1 From volunteer ping to community map in 18 days
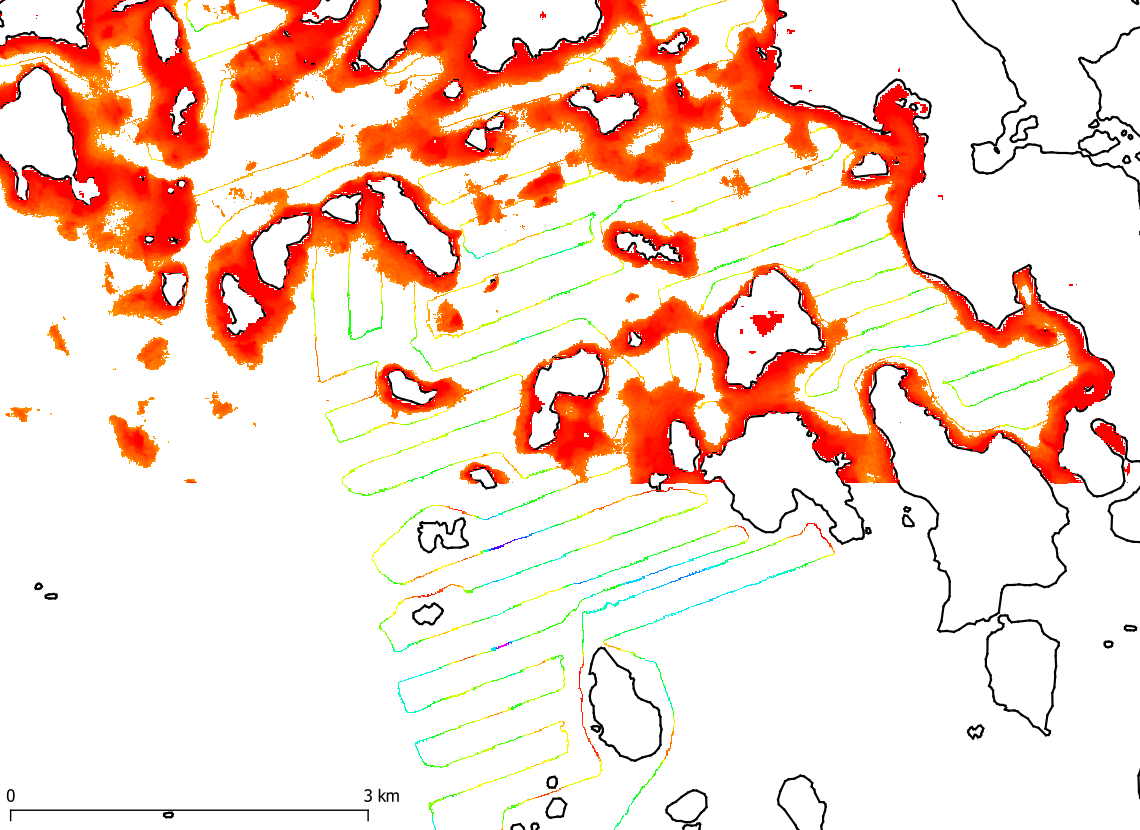
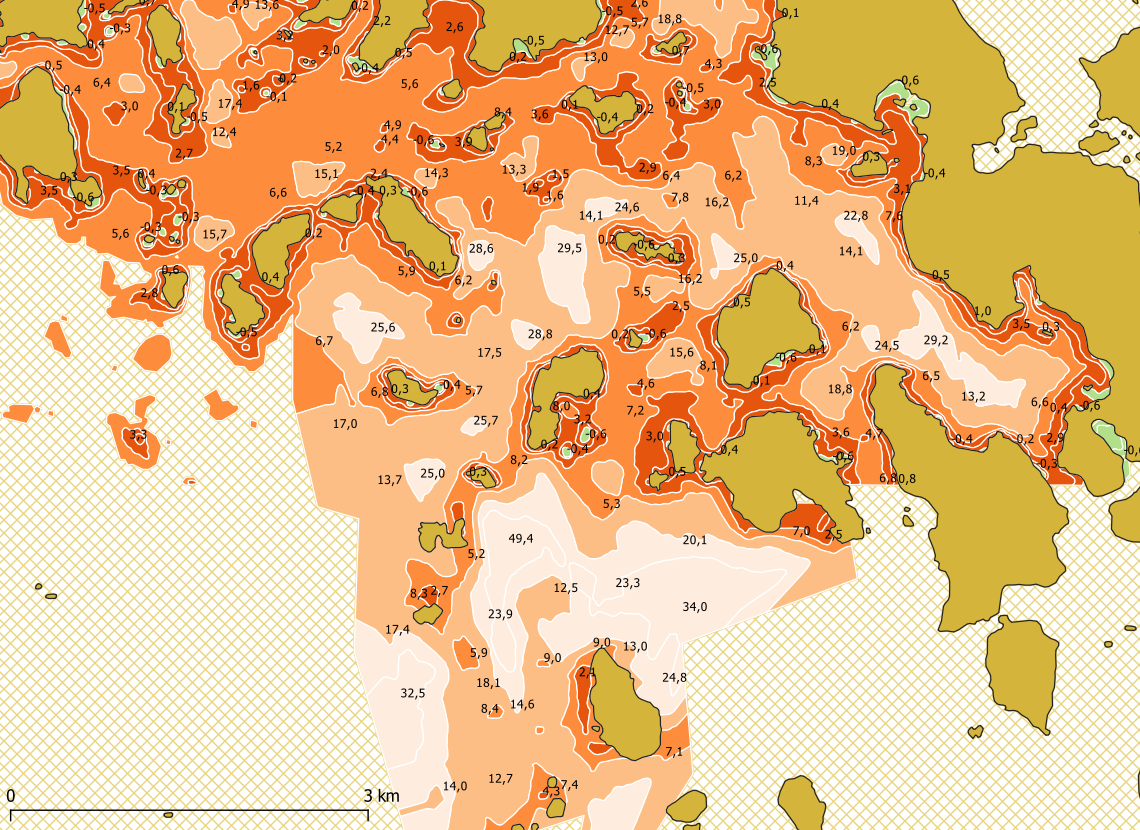
A community map was created in just 18 days. The project unfolded day by day, as follows. On Day 1, Johnny Kasudluak, the project coordinator in the Northern Village of Inukjuak, identified the area of interest. On Day 2, an order was placed by the Program team on the EOMAP SDB-Online service; this was presented in a previous issue of IHR (Hartmann et al., 2022). The Satellite-derived Bathymetry (SDB) for the area of interest was requested and received the following day, Day 3. The SDB was initially used as a reconnaissance survey to securely plan the deployment and route of the vessel Arvik, which had been previously fitted with a CHS BlackBox data logger. A survey-line pattern was drawn jointly by the Program team and Mr. Kasudluak, based on the SDB layer. The line pattern was then sent the same day to the Arvik crew in a GPX format so that it could be displayed by the onboard chart plotter. On Day 8, the Arvik left Inukjuak harbour with a heading to the area of interest. Surveying was started the very same day. After roughly 20 hours of surveying over four days, the Arvik had collected 300 linear kilometres of bathymetric data. At the end of Day 11, just before nightfall, the Arvik docked at Inukjuak harbour. On Day 15, the collected bathymetric data was dropped into the Program’s Dropbox™ account. On Day 16, the data were automatically processed, qualified, and loaded into the 3rdPartyBDB. On Day 18, the community bathymetric surface and the SDB surface were put into the UMap plugin to create a community map (Fig. 18). The map was then published in Inukjuak’s secure space on the Transport Canada’s EMSA platform and made available to community members on their smartphones via the EMSA mobile app.
Such rapid results generate engagement and interest for hydrography in coastal communities in Canada. The efficient data-transfer solutions, the automation of data processing, and the UMap QGIS plugin facilitate tangible results for communities, which in turn increases their motivation. The method described in this paper can be implemented entirely or partially by any interested community. It is not finite, but rather a work in progress. The Program team is working on alternative solutions to provide as many options as possible to meet communities’ various needs.
5.2 SDB and community-based survey are complementary
This use case demonstrates that “alternative” bathymetric data sources, such as Satellite-derived Bathymetry (SDB) and community-collected data, complement each other exceptionally well. SDB is the ideal reconnaissance survey to secure the deployment of a community vessel in an unsurveyed area. In return, the community survey serves as in situ reference data to validate the SDB. The Inukjuak pilot project collected 5,600 community survey soundings overlapping the SDB dataset in the IMR. The collected samples are distributed around an average difference of -0.2m (SDB shows on average shallower depth than the community survey) and a standard deviation of 1.8 m at 95 % confidence.
6 Conclusion
Coastal communities in Canada are struggling with climate change. In some areas the coastline is eroding while elsewhere post-glacial rebound is causing the seafloor to lift and biodiversity is changing. Forced to adapt, northern communities are looking to bathymetric data, which is recognized as a foundational layer for understanding the marine environment and making informed decisions to protect it. The Community Hydrography Program is dedicated to engaging with communities and helping them achieve their hydrographic aspirations in ways that are in line with their values and needs. The Program is articulated around capacity building and the generation of rapid results – and both seem to be successful ways to sustain the motivation of all project participants. Such rapid results rely on quick data routing from field to data warehouse, on automation to transform raw bathymetric data into processed, ready-to-use data, and on community maps as a way for communities to conveniently present and leverage the data collected.
References
Arfeen, K. (2019). Automated Processing of Arctic Crowd-Sourced Hydrographic Data While Improving Bathymetric Accuracy and Uncertainty Assessment. Master’s thesis, The University of New Brunswick, Canada.
Baker, K., Tagalik, S. and Desrochers, J. (2021). Don’t hit rocks – Economic Equity in Ocean Mapping. Map the Gaps Symposium, Redux. https://www.youtube.com/watch?v=_tgWFG5Ua6A (accessed 31 January 2023).
Calder, B. R., Dijkstra, S. J., Hoy, S., Himschoot, K. and Schofield, A. (2018). A Design for a Trusted Community Bathymetry System. 2018 Canadian Hydrographic Conference, March 27– 29, Victoria, BC, Canada. Canadian Hydrographic Association.
Calder, B. R. (2023a). Design of a Wireless, Inexpensive Ocean of Things System for Volunteer Bathymetry. IEEE Internet of Things Journal, 10(11), pp. 9534–9543. https://doi.org/10.1109/JIOT.2023.3234500
Calder, B. R. (2023b). Wireless Inexpensive Bathymetric Logger (WIBL) – BitBucket. https://bitbucket.org/ccomjhc/wibl/src/master/ (accessed 17 March 2023).
COMREN (2019). Crowd-Sourced Bathymetry in the Northern Canada Area.
COMREN (2022). Speed Mapping Challenge. https://oceanmapping.ca/2022/06/speed-mapping-challenge/ (accessed 16 January 2024).
Côté, R., Biron, A., Bouillon, G. and Lebel, É. (2018). Autonomous vehicules: The Canadian Hydrographic Service Journey, Canadian Hydrographic Conference. Vancouver.
Desrochers, J. (2018). A crowdsourced approach for capacity building in North Canada. Canadian Hydrographic Conference, Vancouver.
Desrochers, J. (2021). Collaborative Bathymetry in Arviat. US Hydro Conference 2021.
Desrochers, J., Ndeh, D. and Regular, K. (2020). Crowd Sourced Bathymetry in Northern Canada. Proc. Canadian Hydro. Conf., 24–27 Feb., Québec City, QC, Canada.
DFO-CHS (2022). About the Canadian Hydrographic Service – What we do, Official CHS web site. https://www.charts.gc.ca/help-aide/about-apropos/index-eng.html#legal (accessed 24 January 2024).
DFO-CHS (2023). Community Hydrography, Community Hydrography web page. https://www.dfo-mpo.gc.ca/science/hydrography-hydrographie/opp-ppo/index-eng.html (accessed 14 February 2024).
FNIGC (2010), The First Nations Principles of OCAP. https://fnigc.ca/ocap-training/ (accessed 29 January 2024).
Gruben, M., Pascal, J., Whalen, D., Loseto, L., Hunters, A. and Trappers Committee (2022). The Aklavik Mapping Project. ArcticNet Annual Scientific Meeting, Toronto. https://doi.org/10.1139/as-2023-000
Hartmann, K., Reithmeier, M., Knauer, K., Wenzel, J., Kleih, C. and Heege, T. (2022). Satellite-derived bathymetry online. The International Hydrographic Review, 28, pp. 53–75. https://doi.org/10.58440/ihr-28-a14
HDACoE (2023). CHS Bathymetric Gap Analysis 2023. Hydrographic Data Access Centre of Expertise, Canadian Hydrographic Service, Canada.
IHO (2017a). Standards of Competence for Category ‘B’ Hydrographic Surveyors. IHO Publication S-5B, Edition 1.0.1. International Hydrographic Organization, Monaco.
IHO (2017b). Standards of Competence for Category ‘B’ Nautical Cartographers. IHO Publication S-8B, Edition 1.0.0. International Hydrographic Organization, Monaco.
IHO (2018a). Standards of Competence for Category ‘A’ Hydrographic Surveyors. IHO Publication S-5A, Edition 1.0.2. International Hydrographic Organization, Monaco.
IHO (2018b). Standards of Competence for Category ‘A’ Nautical Cartographers. IHO Publication S-8A, Edition 1.0.1. International Hydrographic Organization, Monaco.
IHO (2022). Guidance on Crowdsourced Bathymetry. IHO Publication B-12, Edition 3.0.0. International Hydrographic Organization, Monaco.
IHO (2023). Status of Hydrographic Surveying and Charting Worldwide. IHO Publication C-55, International Hydrographic Organization, Monaco.
Kastrisios C, Dyer N, Nada T, Contarinis S and Cordero J. (2023). Increasing Efficiency of Nautical Chart Production and Accessibility to Marine Environment Data through an Open- Science Compilation Workflow. ISPRS International Journal of Geo-Information, 12(3), p. 116. https://doi.org/10.3390/ijgi12030116
Katz, C. (2022). With Old Traditions and New Tech, Young Inuit Chart Their Changing Landscape. https://hakaimagazine.com/features/with-old-traditions-and-new-tech-young-inuit-chart-their-changing-landscape/ (accessed 14 November 2022).
Klemm, A. and Krabiel, T. (2023). From Crowd to Chart: Methods and Applications of Crowdsourced Bathymetry in Support of Safe Navigation. US Hydro Conference 2023, Mobile, Alabama. https://github.com/anthonyklemm/Crowdsourced_Bathy_Processing/blob/main/Klemm_CSB_USHYDRO23.pdf (accessed 18 February 2024).
Leighton, S. (2019). The HydroBall Project – Crowd Source Bathymetry in Northern Canada. The Journal of Ocean Technology, 14(1).
Marshall, C. (2022). National Report for Canada. 12th ARHC Meeting and Symposium on the Hydrography in Arctic, St John’s, Newfoundland and Labrador, Canada.
Roche, S., Devillers , R., Santerre, R., Nistad, J.-G. and Rondeau, M. (2011). BAThyWeb 2.0: Bathymetry Affordable Technology on the Web 2.0. https://doi.org/10.13140/RG.2.2.32856.37129
Rondeau, M. and Malouin, M.-A. (2019). Bad Information Is Better Than No Information At All – Assessing the uncertainty of bathymetric collaborative data collected with a HydroBox system. Vecteur – CIDCO Symposium, Rimouski. https://doi.org/10.13140/RG.2.2.34784.10243
Rondeau, M., Gautier, S., Montpetit-Allard, G., Bilodeau, Y. and Breton, M. (2023). «From Volunteer Ping to Community Chart» – Implementation of a «trusted-node» at CHS. CIDCO Symposium, Rimouski. https://doi.org/10.13140/RG.2.2.18965.19683
Stewart, H. (2023). The future is CLEAR: Community-Led Engagement for Adaptability and Resilience, The International Hydrographic Review, 29(1), pp. 56–64. https://doi.org/10.58440/ihr-29-a06
Tagalik, S. (2022). Youth Marine Mapping in Arviat, Pinnguaq. https://pinnguaq.com/stories/youth-marine-mapping-arviat/ (accessed 21 February 2023).
Trethewey, L. (2023). The Deepest Map: The High-Stakes Race to Chart the World’s Oceans (1st ed.). Harper, ISBN 0063099977, 9780063099975.
Authors’ biographies

Mathieu Rondeau holds a bachelor’s degree in surveying engineering from l’École Supérieure des Géomètres et Topographes (Le Mans, France) and a master’s degree in geomatics sciences from Laval University (Quebec, Canada). From 2009 to 2018, he worked for the Interdisciplinary Centre for the Development of Ocean Mapping (Canada), where he gained most of his expertise in hydrographic surveying. Since 2018, he has been employed by the Canadian Hydrographic Service. For the past two years, he has been a part of the Community Hydrography Program team, dedicated to supporting coastal communities in the collection and use of bathymetric data.
Michel Breton has 15 years of experience with the Canadian Hydrographic Service (CHS). Michel initially worked as multidisciplinary hydrographer surveying and charting the west coast of Canada. Over time, a knack for innovation and data management led him onto projects meant at improving data integration in the organization. Since 2019, Michel has been involved in the digital transformation initiative at the CHS, with S-100 implementation, and more recently with crowdsourced bathymetry data. Michel is currently managing the Community Hydrography Program, a program designed to enable coastal communities in Canada to collect and utilize bathymetric data. Michel is representative for Canada on the International Hydrographic Organization (IHO) Crowdsourced Bathymetry Working Group (CSBWG).
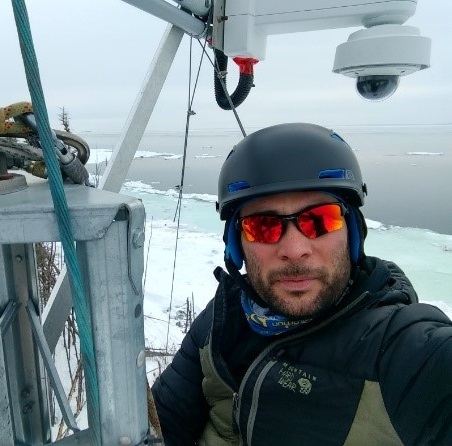
Gabriel Montpetit-Allard began his career as environment and wildlife technician in the private sector. He later obtained a bachelor’s degree in physical geography from the Université du Québec à Rimouski. From 2006 to 2018, he gained professional experience in operational sciences in the private and academic sectors. He then joined the Canadian Hydrographic Service team in 2019. Since 2023, he supervises the bathymetric data acquisition and community outreach unit of the Community Hydrography Program. Through this program, the Community Hydrography team seeks to support coastal communities in their goals to collect, process and use bathymetric data.
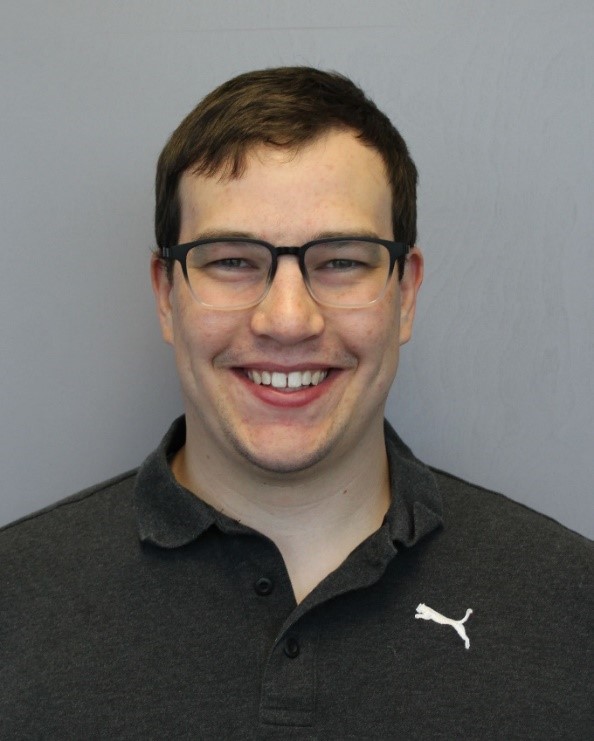
Michel Leger is currently a multidisciplinary hydrographer with the Canadian Hydrographic Service since 2019 at the Bedford Institute of Oceanography. Michel obtained a B.Sc. Eng. in Geomatics from UNB in May 2019. Michel was part of the Community Hydrography team for a four-month position in 2023 as a geomatics technician role tasked with the development and testing of the first iteration of the processing workflow. Michel still provides support and is still interested in the project and looks forward to more opportunities to assist the team in the future.
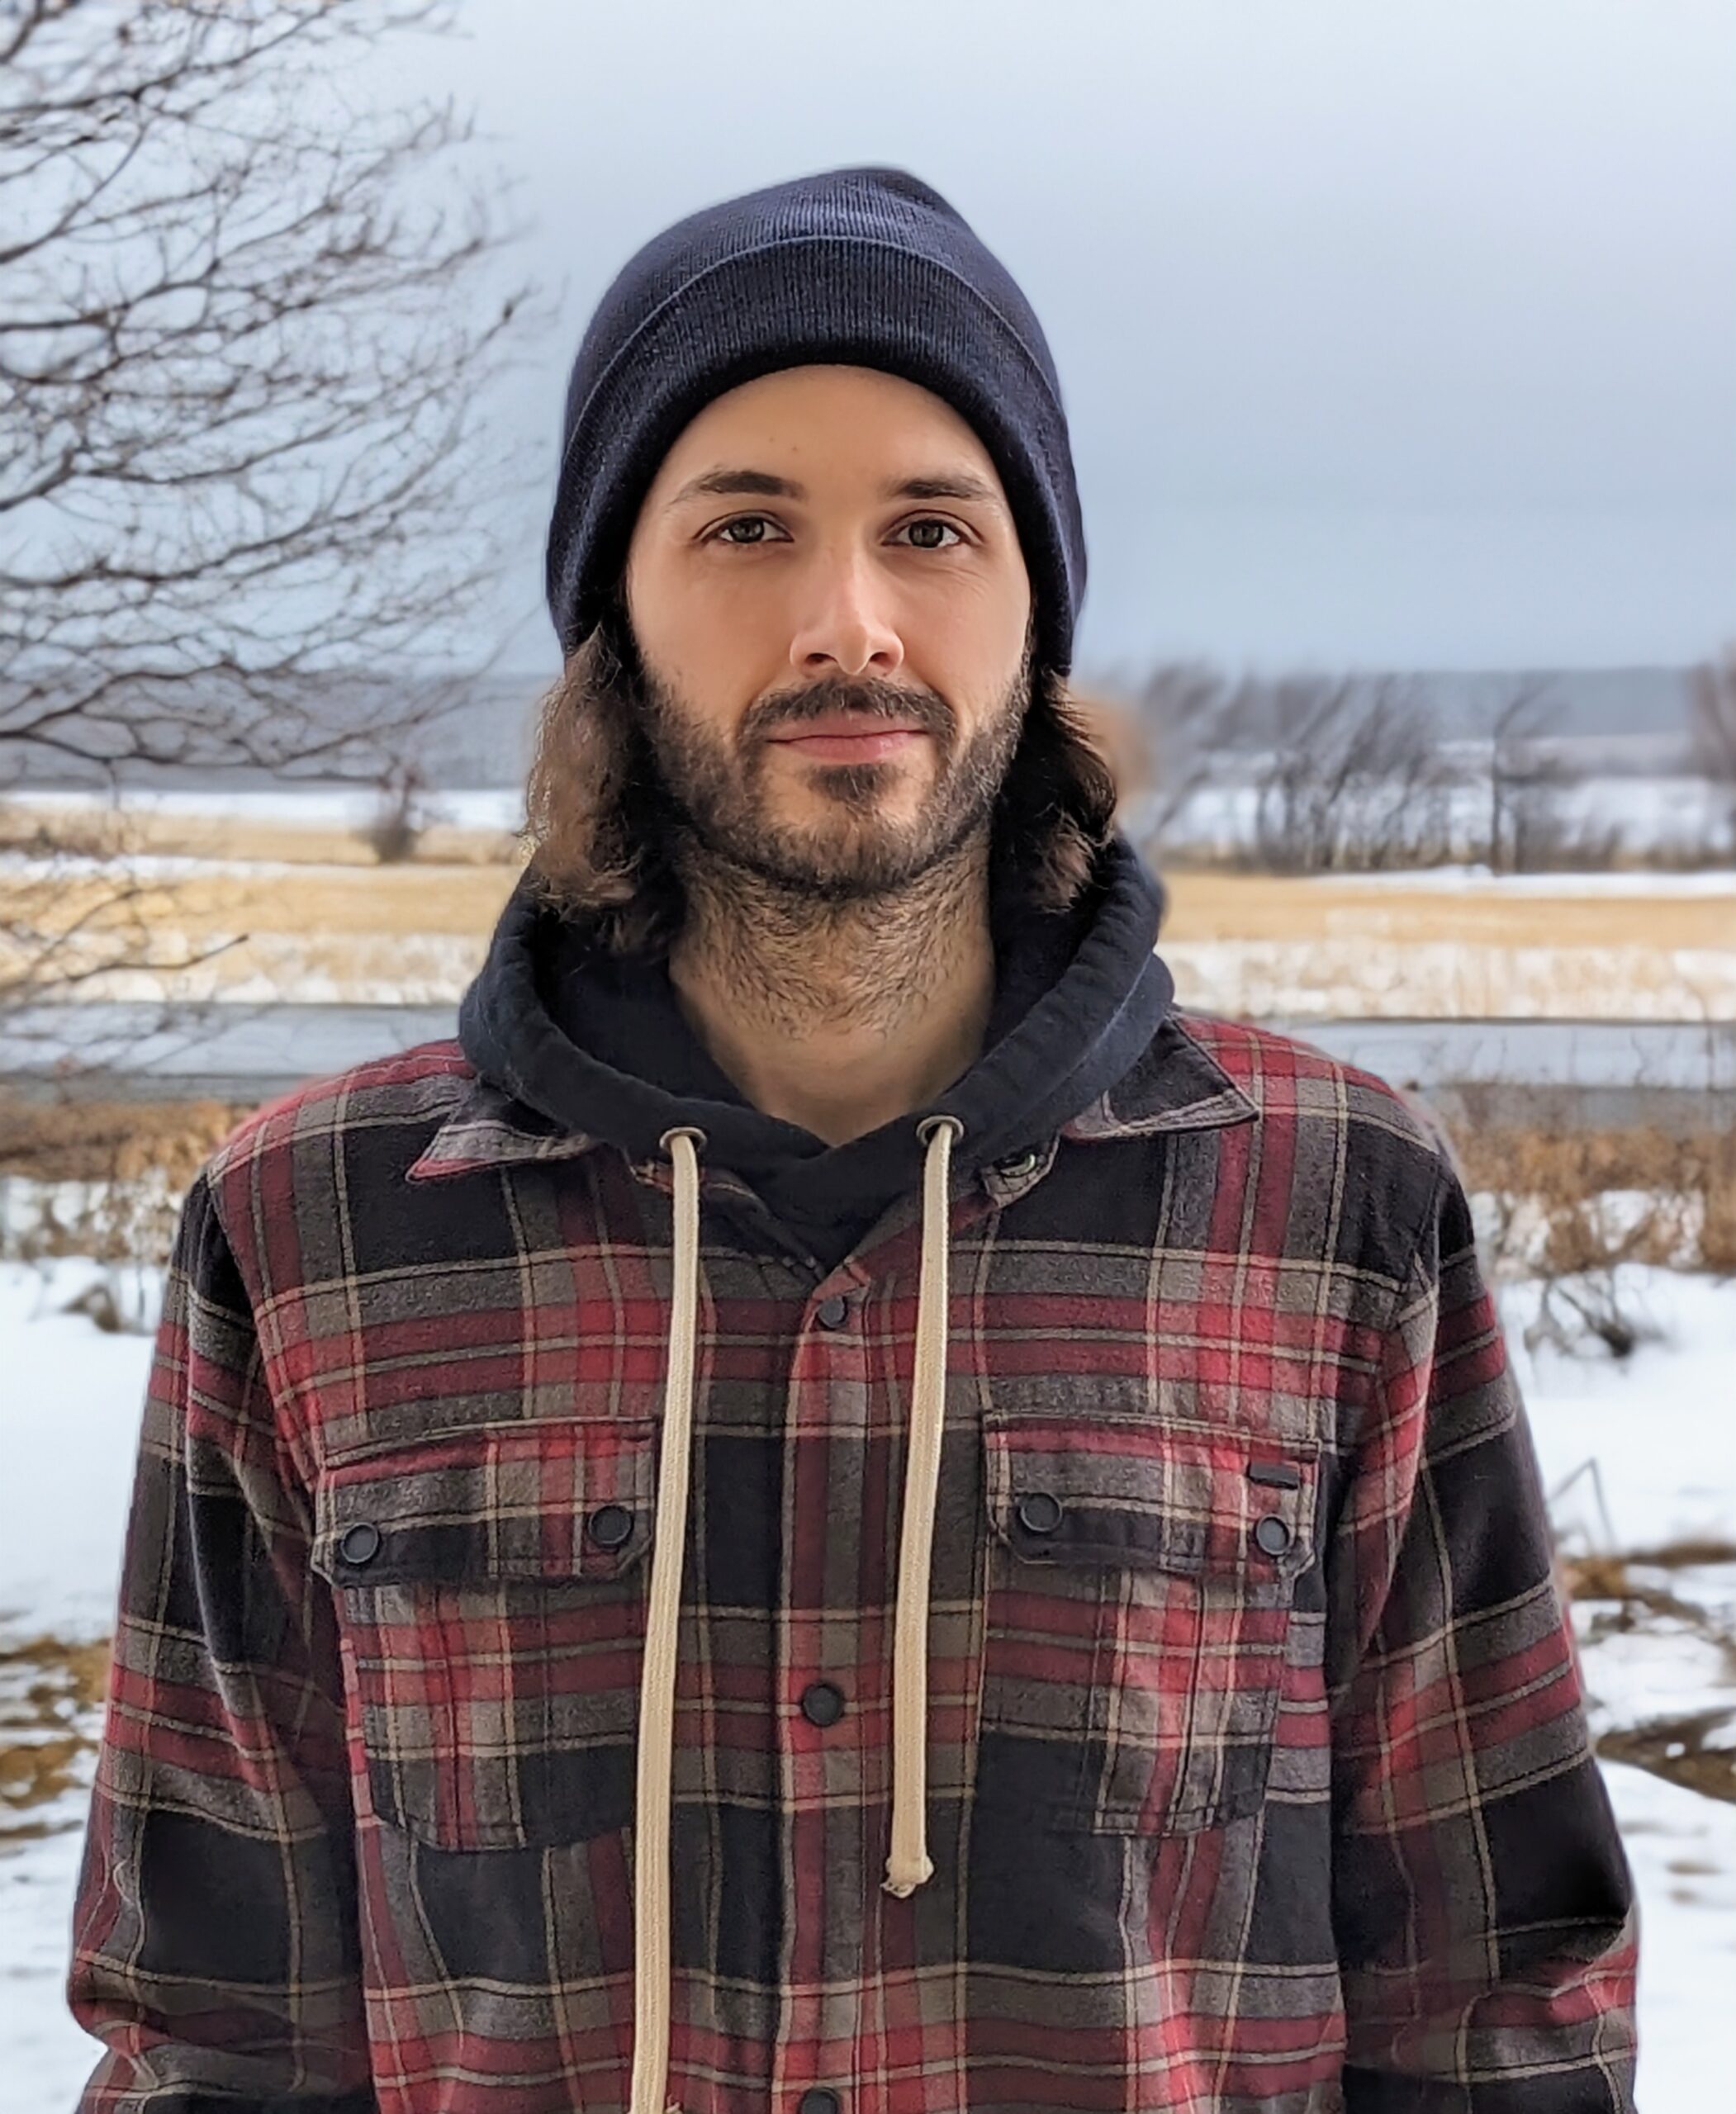
Yan Bilodeau, holding a Bachelor’s degree in Geography from the Université du Québec à Montréal, joined the Canadian Hydrographic Service in 2017 as a multidisciplinary hydrographer. In 2019, he transitioned into the role of a geomatics specialist within the Geomatics and Technical Support team, focusing on automation projects and contributing to the development of bathymetric data processing and integration pipelines. Since 2023, Yan has been an integral member of the Community Hydrography Program team, dedicated to assisting coastal communities across Canada in collecting and utilizing bathymetric data.
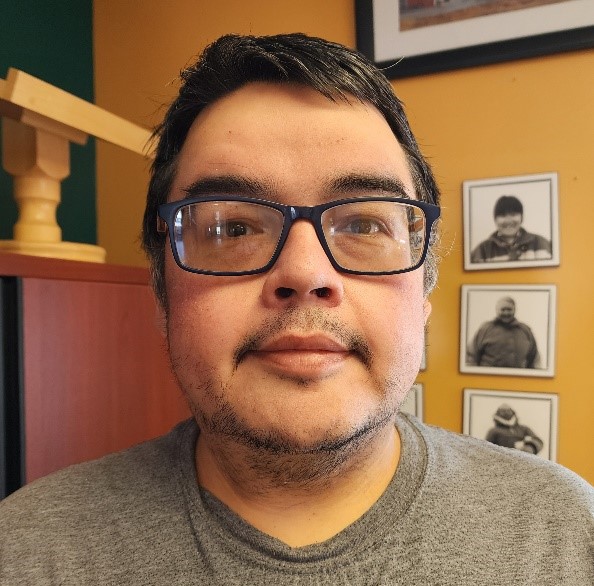
As the Lead Project Coordinator for the Arviliit IPCA Establishment Project, based in Inukjuak, Quebec, Johnny Kasudluak spearheads an initiative in Inuit-led conservation and protection of Arviliit (Ottawa Islands). Over the past 3 years and 3 months, they’ve expertly balanced on-the-ground work with remote coordination and planning. Johnny is driven by a deep-seated belief in safe marine navigation for the local Inuit population, recognizing that existing nautical charts often fail to provide accurate information due to the dynamic nature of the area’s bathymetry. This motivates their dedication to driving community hydrography efforts in Inukjuak’s marine region, collaborating closely with the Canadian Hydrographic Survey. Their commitment to fostering collaboration and innovation is evident in their role as they develop a pioneering model for community-led hydrographic-bathymetric research. Beyond their professional pursuits, Johnny finds inspiration in nature and the rich cultural heritage of their surroundings.