


Abstract
1 Introduction
Many of the most devastating natural hazards that impact our communities are generated over, or under, the oceans. Over the last 20 years, following the Indian Ocean tsunami, the number of tsunami related research publications and governmental actions in favor of faster tsunami detection and response has increased substantially (Chiu & Ho, 2007; Cummins et al., 2009; Løvholt et al., 2014; Synolakis & Bernard, 2006). However, many recent tsunamis were surprisingly unexpected due to their amplitude, location or unusual source. For example, the 2011 Tohoku-oki tsunami exceeded maximum predictions (Goto et al., 2011; Kagan & Jackson, 2013), and one year later, the 2012 Haida Gwaii tsunami occurred in an uncommon source region (Fine et al., 2015; Leonard et al., 2012). Later, the dual 2018 Indonesian tsunamis were generated by non-standard tsunamigenic earthquake mechanisms (Grilli et al., 2019; Schambach et al., 2021; Titov, 2021). More recently, the powerful 2022 Hunga Tonga Hunga Ha’apai (HTHH) tsunami was generated by a rare combination of atmospheric forcing, volcanic eruption, submarine landslide and local resonance (Gusman et al., 2022; Han & Yu, 2022; Lynett et al., 2022).
Most of the existing observing capacity to predict and detect these tsunamis is either located on land, like the seismic network and land-based Global Navigation Satellite System (GNSS), on the coastline, like the tide-gauges, or close to the shore, such as GNSS buoys. Deep water observations are provided by Ocean Bottom Pressure Gauges (OBPGs) and the Deep-Ocean Assessment and Reporting of Tsunami (DART) array (Bernard & Meinig, 2011; Bouchard et al., 2007). However, many tsunami events have emphasized that those sensors are sparsely located (Gusman et al., 2016) and often offline due to weather conditions, maintenance difficulties or vandalism (Xerandy et al., 2015). Moreover, the DART observing network is very costly, installed mainly by wealthy countries such as the USA or Japan, and therefore unlikely to be adopted in a dense worldwide configuration (Jin & Lin, 2011; Mulia & Satake, 2020; Qayyum et al., 2022). Current Tsunami Early Warning Systems (TEWS) implemented worldwide are typically based on detecting and characterizing tsunamigenic earthquakes occurring in subduction zones and, therefore, do not always adequately address other sources like the ones detailed above (Amato, 2020; Srinivasa Kumar & Manneela, 2021). Each of these tsunami events above showed issues with the observing capacity in the region, or during the computation of tsunami models or inundation predictions, limiting our ability to predict, detect, and respond to these hazards. They demonstrate the urgent need for well distributed, more densely spaced, observations and direct measurements from the areas between the source region and the communities that may be impacted – that is, across the oceans. A key challenge, therefore, in improving our tsunami observing capacity in the oceans and filling up this “geodetic desert” is how to achieve this at a minimal cost. Several new projects and technologies have emerged in recent years, allowing us to directly obtain data of interest for tsunami forecasting from the ocean.
First, seafloor geodetic techniques offer unique possibilities to measure crustal deformation that can result in tsunami hazards (Bürgmann & Chadwell, 2014). Several projects offshore Japan (Iinuma et al., 2021), Alaska (Brooks et al., 2023), Cascadia (Chadwell et al., 2018), Hawai’i (Brooks et al., 2021; Foster et al., 2020), and Chile (Kopp et al., 2022) have shown significant advances in the more precise understanding of the tectonic processes in areas usually inaccessible to standard geodetic instruments. While most of these techniques are expensive, recent technologies using Wave Glider ocean robots promise lower-cost seafloor geodetic systems (Brooks et al., 2021; Foster et al., 2020). Dedicated seafloor cable installations for tsunami detection and early warning have been implemented in Japan, first around the Nankai Trough with the Deep Oceanfloor Network system for Earthquakes and Tsunamis (DONET; Kawaguchi et al., 2008), then with a larger-scaled observatory along all the Japan Trench with the Seafloor Observation Network for Earthquakes and Tsunamis (S-net; Mulia & Satake, 2021). The North-East Pacific Time-Series Undersea Networked Experiments (NEPTUNE) on the west coast of Canada is another example of regional cabled ocean observatory: installed for multi-purpose research, it includes several instrumentations for tsunami monitoring (Barnes et al., 2008). Science Monitoring And Reliable Telecommunications Subsea Cables (SMART) represent another promising approach for tsunami detection and observation by using the existing submarine telecommunications cables as sensors combining a pressure sensor, seismic instrument, and an accelerometer (Howe et al., 2019). New developments aim to cover all the oceans globally through regional pilot systems, for example, the triangle Europe – Azores – Madeira (Matias et al., 2021), the Sumatra – Java region (Salaree et al., 2023), and the New Caledonia – Vanuatu – Hawai’i line in the Pacific (Howe et al., 2022).
Other projects concentrate on data coming from above the ocean. The displacement of the ocean surface during a tsunami directly transfers a fraction of this energy to the atmosphere through internal gravity waves. This causes measurable perturbations in the ionospheric total electron content (TEC) that dual-frequency GNSS systems can detect (Astafyeva, 2019; Occhipinti et al., 2008). Initial projects based on this method use continuous GNSS ground-based sites to detect these variations (e.g. 2012 Haida Gwaii tsunami: Savastano et al., 2017; 2010 Mentawai tsunami: Manta et al., 2020). A few recent projects test these systems on board of ships (e.g. 2010 Maule tsunami: Ravanelli & Foster, 2020) highlighting new possibilities for open ocean tsunami detection.
A tsunami is a perturbation of the topography of the sea surface. Measurements of sea surface height (SSH) perturbations are already made on land by tide-gauges and in the ocean by OBPGs. Some projects have explored airborne measurements of SSH using an aircraft equipped with a radar altimeter (Mulia et al., 2020). Satellite altimetry data also provides direct measurements of changes in sea level, enabling us to compare and validate tsunami models after an event (Hamlington et al., 2011; Hébert et al., 2020; Hirata et al., 2006; Okal et al., 1999). Satellites, however, are very costly and the temporal and spatial coverage remain sparse thus limits their capability. More cost-effective improvements for operational tsunami monitoring deploy sensors on existing ocean platforms. SSH measurements and tsunamis detection are already made using GNSS static buoys along the coast of Japan (Kawai et al., 2013). Several studies also demonstrated the efficiency of using a GNSS-based approach on board ships to measure SSH and even wave periods (Bonnefond et al., 2003; Foster et al., 2014; Rocken et al., 2005) and thus to be able to detect offshore tsunamis (Foster et al., 2012; Inazu et al., 2016).
Treated as moving tide gauges, ships can then provide a platform for new tsunami warning sensors. Packages have already been proposed and deployed: they are composed of a GNSS receiver and antenna for data collection, as well as a communication link with a land-based server using a satellite communication antenna (Foster et al., 2012; Foster et al., 2024). To obtain precise real-time position estimations at low-cost and avoid data loss, the onboard GNSS receiver directly processes the raw data using a commercial positioning service with a high accuracy on the vertical component (Foster et al., 2024). The final positions are then broadcasted to a server located on land through a dedicated satellite communication antenna, or even better for a cost-effective solution, by directly using the existing internet service from the ship. The vertical position given is the ellipsoidal height of the GNSS antenna. To estimate SSH perturbations from this raw data, a mean sea surface height model is applied and removed from the time series, followed by band-pass filtering to remove the ocean wave field (Foster et al., 2012, Foster et al., 2024). Tested both in coastal areas and in the deep ocean, this technique has shown the ability to detect ~10 cm tsunami amplitudes (Foster et al., 2009; Inazu et al., 2016) and ~10 cm.s-1 accuracy of tsunami currents (Inazu et al., 2020). Using offshore observations is a powerful tool to improve field tsunami forecasting because they provide a snapshot of the open-ocean SSH and enable direct tsunami detection rather than inferring them through modeling the tsunami source (Mulia et al., 2022). The combination of offshore datasets, tsunami models and onshore datasets enables an iterative approach combining numerical modeling and comparison with observations and is already used in Japan for tsunami monitoring (Inazu et al., 2016; Mulia et al., 2017; Tsushima et al., 2014).
Dense observatories of sensors for earthquake and tsunami detection and warning would be helpful throughout the ocean. In this context, this study investigates a proposed cargo ship network for GNSS-based tsunami detection to fill this geodetic observation gap in the ocean by tracking changes in SSH and detecting even small, ~10 cm amplitude tsunamis from different sources. The first question that arises is the temporal coverage of such a cargo network, specifically: are there enough ships underway in the Pacific Ocean at all times? A correlated question concerns the spatial coverage of this network, to identify areas with less maritime traffic and therefore fewer observation points of data. A first overview of the shipping lines in the Pacific Ocean shows an excellent temporal and spatial coverage of ships (Fig. 1). Thus, this study aims (i) to analyze in detail the traffic using Automatic Identification Service (AIS) datasets recorded from ships and (ii) to compare an average network of ships to tsunami sources. Our goal is to assess this proposed ship network for GNSS-based tsunami detection: (i) on its contribution to trans-oceanic tsunami detection and characterization, (ii) on its early warning possibilities, and (iii) on its worldwide application as a cost-effective solution for tsunami warning. The paper finally explores the suitability of such a moving platform in the oceans to host a tsunami detection network.

2 Methodology: mapping ship traffic for a tsunami detection application
The International Maritime Organization (IMO) regulations state that all commercial ships exceeding 300 gross tonnages have to send their AIS information via very-high-frequency radio transmission: these are either received by coastal stations when the ships are less than 100 km from the coast, or through low-Earth-orbit satellites (Carson-Jackson, 2012; IMO, 2002). The AIS messages provide essential information in both static components – Maritime Mobile Service Identity (MMSI), ship type, and ship name – and dynamic components – time, coordinates except height, speed over ground, course over ground, and ship heading – (Le Tixerant et al., 2018). Realtime data is available through tracking browsers such as MarineTraffic1.
The present study focuses on the Pacific Ocean, the region with the highest tsunamigenic potential (Gusiakov et al., 2019; Lander et al., 2003; Röbke & Vött, 2017). We use the records of hourly positions of ships (latitude and longitude) from one year of AIS navigation data from the commercial shipping fleet to generate coverage maps of large vessels in the Pacific region. Multiple records in an hour from the same ship are removed by verifying the MMSI (nominally unique) for each ship. On the contrary, breaks in the ships’ AIS data stream make them not always visible in every hourly file. The data provided by commercial company SPIRE Maritime was collected from October 15, 2018 to October 14, 2019. Only records of large commercial vessels designated as cargo or tankers are used in our analysis as these are the types of ships most likely to easily and effectively participate in a tsunami detection program as they spend most of their time underway and typically have satellite internet connections. The study covers a pre-COVID-19 pandemic period with similar patterns in ship lines as now (UNCTAD, 2023). We note that the ship positions reported in AIS messages are not generally available in real-time, are low accuracy, and do not include the ship elevation, which prevents current AIS system itself to be applied to tsunami detection.
Several statistical coverage maps of ships are generated using a 500 km × 500 km grid over the Pacific Ocean. The choice of a 500 km cell size matches the average distance between DART sensors (calculated from DART data provided by NOAA, 2023). We look at the hourly mean number of ships in each cell, creating a heat map of ships in the Pacific region for different epochs. For reference, at typical propagation speeds (800 km/h), a tsunami wave would cross one of our boxes in less than 40 minutes, while a cargo ship with a typical cruise speed of 40 km/h would take more than 12 hours to cover the same distance. An overlap of these spatial and temporal coverage maps with tsunami travel time (TTT) and tsunami models enables a direct comparison with known tsunami source regions. For this study, a 10 cm tsunami threshold is used as a constraint to identify the ships’ network coverage during a tsunami propagation. This choice also corresponds to ~10 cm deep-ocean tsunami threshold used in warning purposes to identify land threatening tsunamis. We note that if modern precise real-time position GNSS estimations can easily reach vertical accuracies less than 5 cm (Li et al., 2015; Nie et al., 2020; Trimble, 2024), ongoing studies show that the signal filtering process identify for now a tsunami detection threshold of 10 cm (Foster et al., 2012; Foster et al., 2024; Inazu et al., 2016).
3 Results: first insights on geographic ships’ coverage of fatal tsunamis
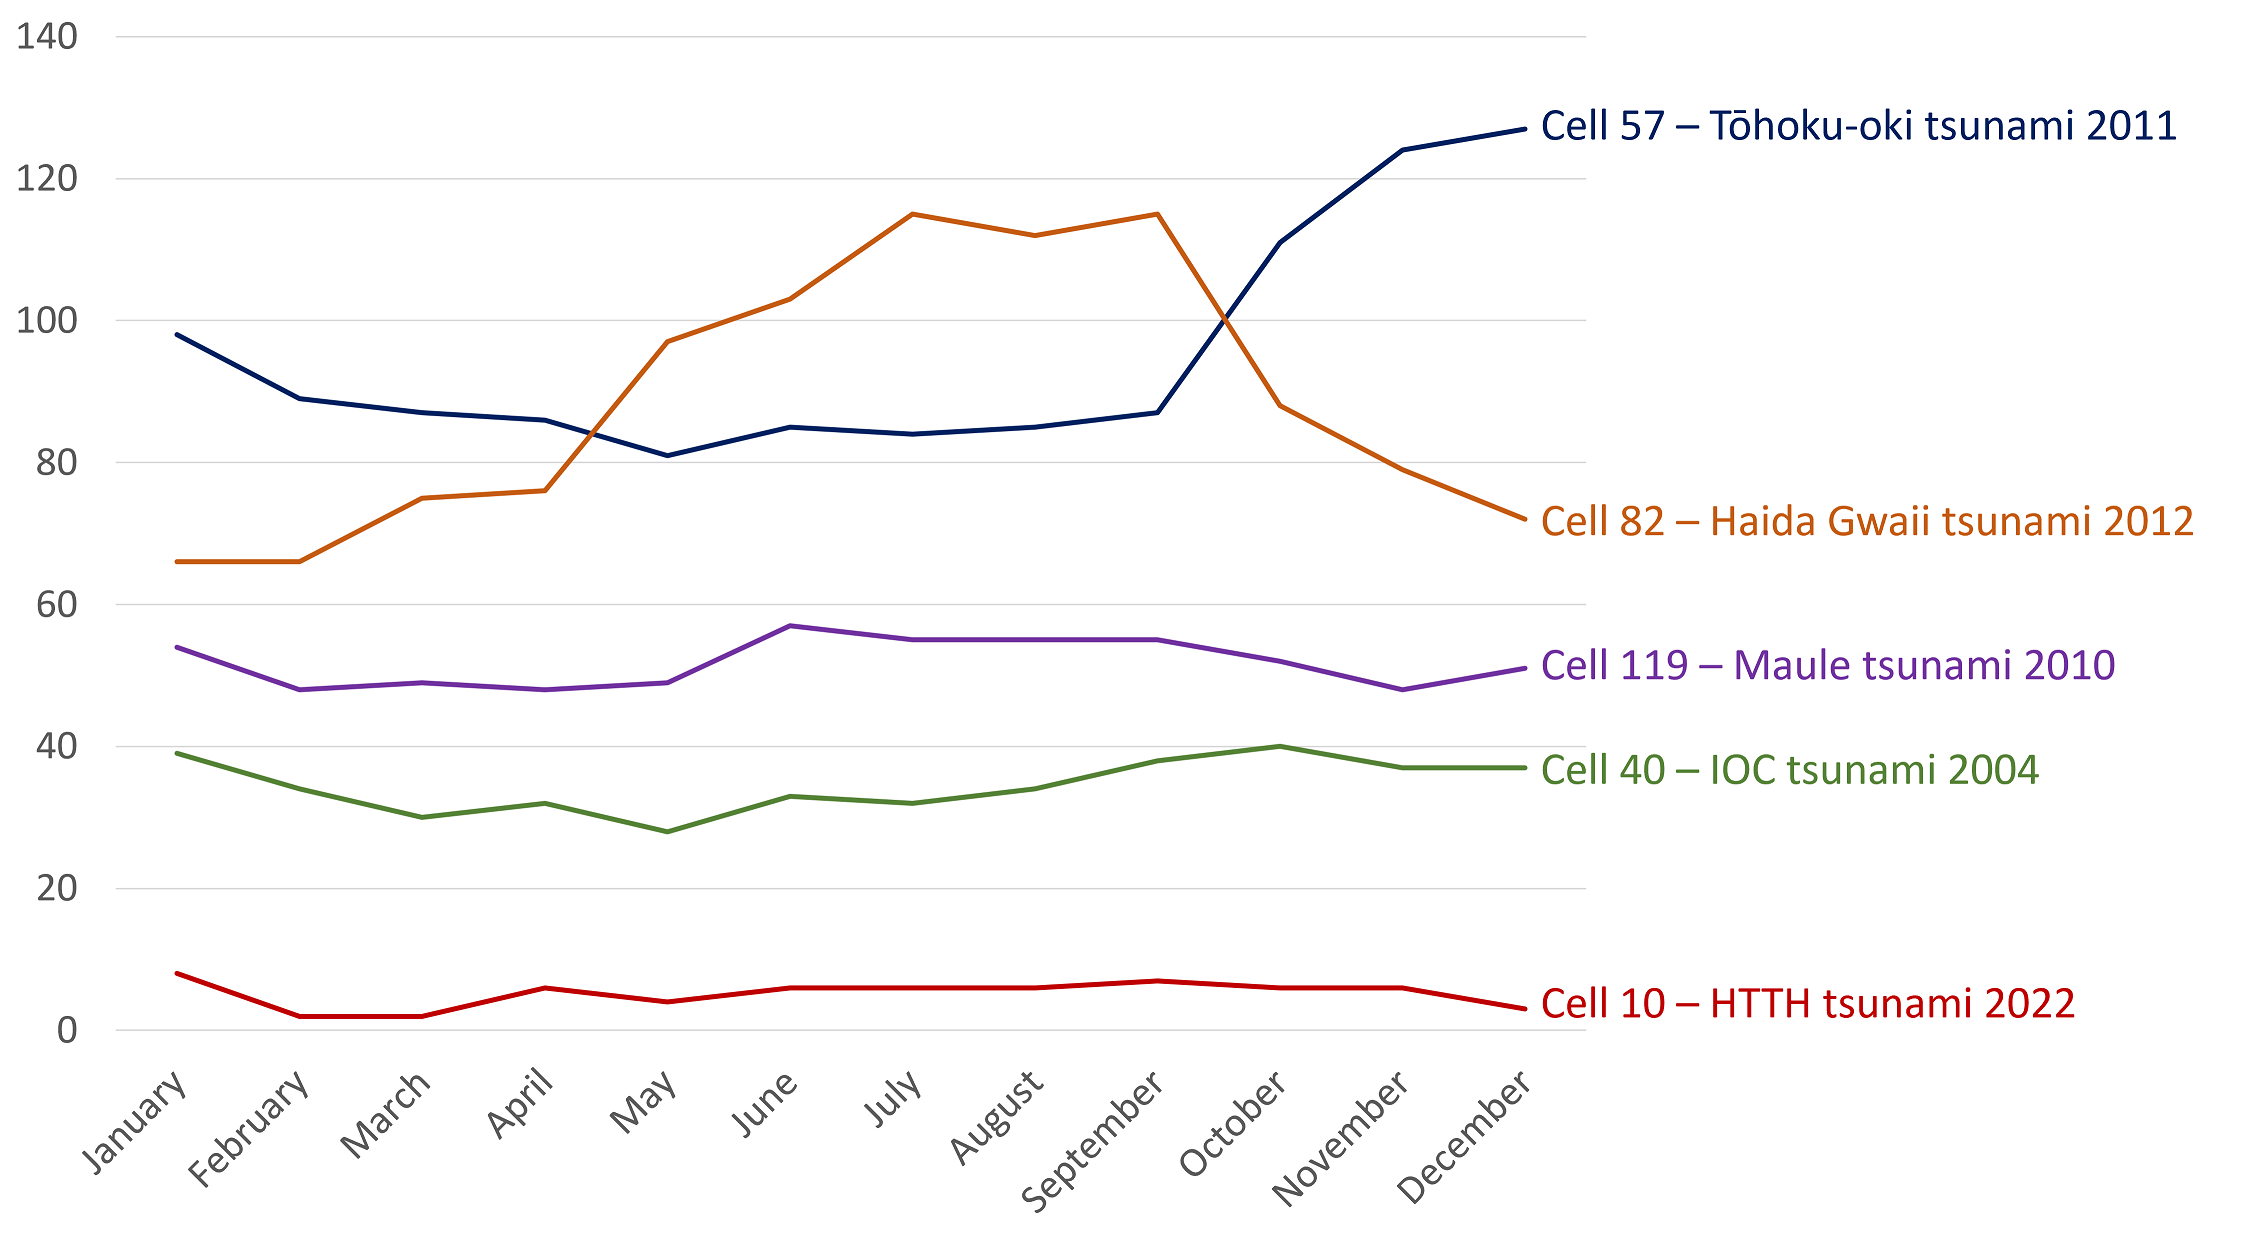
Over one year of data, there are on average ~38,000 cargo and tanker ships at any time spread out in the Pacific Ocean (Fig. 2). Different epochs of study can be used as a base of comparison: for example, the hourly mean number of ships over each season shows a similar pattern in the overall coverage, with a density slightly higher during spring and autumn periods corresponding to an increase in trade exchange for holiday seasons, known as peak season (Yin & Shi, 2018). The highest numbers are located along coastlines, especially in East Asia: ~36,000 ships, on average, are located less than 500 km from coast at any time. More than 10,000 ships on average are in the cell centered in (29.3,122.6) corresponding to Shanghai, the busiest port in the world (WSC, 2023). Complementary monthly time series of the average number of ships for some cells locating historic tsunamis are shown in Fig. 3, highlighting an overall similar trend along the year with few seasonal variations. These patterns precisely match the common maritime routes along the coastlines in America and Asia, between the islands in Southeast Asia and Oceania, and across the North Pacific through Hawai’i (Rodrigue, 2017). However, the standard deviation and/or interquartile range of the AIS data in these cells shows some important variabilities. This can be explained partly by breaks in the ships’ records. Secondly, when creating the grid, each cell location is defined and treated separately from the neighboring ones; thus, depending on the specific distribution of the maritime traffic and the instantaneous locations of ships with respect to the cell boundaries, the total number of vessels can significantly fluctuate. This variability is meaningful for cells with an hourly mean number of vessels above 100. For regions with low traffic, variations in the specific locations of those few ships lead to large standard deviations for the cells, but do not represent proportionately significant variations in regional traffic. In one key tsunami area with low ship counts – the South West Pacific – there is at least one ship in each cell.

Tsunamigenic areas in the Pacific Ocean are mainly located along the subduction zones where tectonic processes generate earthquakes, volcano activity, landslides and tsunamis. This so-called Pacific Ring of Fire is highlighted in Fig. 2 and unfolded as a histogram of the mean number of ships per cell location in Fig. 4: starting from the southern point of New Zealand, through the South-West Pacific islands, curving around Indonesia before reaching the Philippines then following the trench along Japan to Russia and up to Alaska, to finally run along all the west American coast (where a large section of the tectonic boundary is a strike-slip fault) from Canada to Chile. We explore the geographic relationship between the ships’ locations and some of the deadliest tsunami sources. Of the 124 cells studied, half of them have been a source of a fatal tsunami: the 30-min TTT corresponds then to the cell size (for a typical deep-ocean tsunami speed of 800 km/h), meaning that we can consider that the number of ships represented in each cell (Fig. 2), or each line (Fig. 4) corresponds to the number of ships located in a 30-min TTT. Based on the deadliest tsunami taking its source from the mentioned cells, the total death count rises above 400,000 (Fig. 4). Our data suggests that a total of ~4,000 ships are located on average in the 124 cells studied. A zoom in shows that seven cells are sources of tsunamis with local and trans-oceanic death tolls above 10,000 and have a count of more than 800 ships on average per hour. As observed in Fig. 2 and confirmed in Fig. 4, the South-West Pacific zone lacks heavy ship traffic despite two thirds of its area being a source of fatal tsunamis. This is true to a lesser extent, for the Kamchatka – Alaska area and some of the Central America west coast. These maps demonstrate that commercial shipping lines offer a unique and broader range of observations that could augment the existing observing systems by providing (i) an excellent spatial coverage of the ocean globally, (ii) a spatial coverage very dense near coastlines critical for local and regional early warning, and (iii) an excellent temporal coverage of the ocean globally with few blind spots in the South Pacific.

4 Discussion: contribution of a ship-based GNSS network for tsunami detection
We envision the proposed GNSS package as being installed on ships through a voluntary participation program. As a realistic goal for our proposed network, we use the existing Voluntary Observing Ship (VOS) program which provides observations of marine meteorology (Foster et al., 2012; Kent et al., 2010) as a template. It is estimated that 11 % of the commercial fleet is part of the VOS scheme which equates to ~4,000 ships in the Pacific. For our study, we imagine a similar network of “Voluntary Tsunami Observing Ships” (VTOS) that comprise of 11 % of the cargo and tanker ships reported in the AIS database. The following discussion aims to deliver answers on the potential contribution to tsunami warning of these VTOS ships located in the near-field and in the far-field of a tsunami event.
4.1 Ships in the near-field of tsunami events
On October 28, 2012, a major MW 7.7 thrust earthquake occurred along the Queen Charlotte Fault Zone off the southern west coast of the Haida Gwaii archipelago in Canada (USGS, 2012), and generated a non-destructive tsunami measured all along the USA west coast, in Hawai’i and throughout the Pacific (Cassidy et al., 2014; ITIC, 2012). However, apart from a few observations from post-tsunami field surveys with run-ups up to 13 m in neighboring islands (James et al., 2013; Leonard & Bednarski, 2014), no other observation in the near-field zone was reported. Few tide gauges are installed locally, and the tsunami occurred in the middle of the largest 1,360 km gap in the DART network along the North America coast (Fig. 5). Moreover, the near-field warning can be challenging with older-generation DART buoys that would likely miss a tsunami signal due to the aliasing with high-frequency acoustic noise within the source region (Tilmann et al., 2016). As summarized by Fine et al. (2015), the on-land instruments such as seismic and GPS stations do not provide enough information for a precise seafloor displacement estimation in the source area, which makes it challenging to obtain an accurate tsunami model in the near-field zone.
The 2012 Haida Gwaii tsunami provides an instructive case for examining the potential contribution to tsunami warning of ships in the near-field of a tsunami. The tsunami model and the predicted amplitudes are compared to the coverage of vessels in the Pacific (Fig. 5). On average, there are ~15 VTOS ships within the area encompassed by the 30-min TTT – where no real-time tide gauges or DART sites were located. In the dense cells with more than 50 ships (deep blue circles in Fig. 5), the standard deviation climbs to 40 % of the average of ships. The minimum count of ships in each cell shows that, temporally speaking, at least 7 VTOS ships are always present in the 30-min TTT. In the near-field of a tsunami event, the important data to obtain is estimations of heights and periods to detect the propagating tsunami wave. This zone had predicted amplitudes greater than 10 cm (color-scale in Fig. 5 in purple and red). If a ship-based network had been operational during this event, ~15 SSH observations would have been added, enabling a tsunami detection less than half an hour after the earthquake. This set-up of more than five ships would be sufficient to trigger a confident warning: Foster et al. (2012) show that with five or more vessels, the chance of a false positive detection is less than 0.1 %. Within a 1-hour TTT, the network would be composed of ~33 VTOS ships that could contribute even more to a real-time imaging of the tsunami propagation.
The 2012 Haida Gwaii tsunami can be compared to the 2011 Tohoku-oki tsunami. As noted above, the Haida Gwaii region is not covered by permanent and overlapping instrument networks. In contrast, the Tohoku region is surrounded by a significant number of in-land, coastal and deep-ocean instruments providing numerous records and ensuring a quick calculation of the tsunami source function (Hayashi et al., 2011; Satake et al., 2013). The Haida Gwaii area is an uncommon source region for such a tsunami; indeed, only two other very small tsunamis were reported in this region (Leonard et al., 2010; Rabinovich et al., 2008; Soloviev & Go, 1975). The low expected probability of a tsunami generated in this region (Leonard et al., 2012) demonstrates the potentially critical role of open-ocean tsunami observations in augmenting existing systems (Fine et al., 2015). Such a ship-based GPS network in this location would (i) validate the existence and arrival time of a tsunami and (ii) give accurate first estimates of tsunami height and period in one of the most major maritime lines in the Pacific. For the 2011 Tohoku-oki tsunami ~100 VTOS ships on average are located in the 30-min TTT. This compares to the actual 16 near-coast ships that sent AIS information in this time frame (depth of ~100 m) (Inazu et al., 2018). Therefore, a ship-based GPS network would be a major contribution to tsunami early warning and fast response emergency by adding numerous observation points in the near-field open-ocean tsunami area (Hossen et al., 2021).
Tsunamis in the Pacific are often trans-oceanic. Although the death toll and damages are primarily focused in the near-field, they can strongly impact regions thousands of kilometers away from the initial source. The International Tsunami Information Center (ITIC) lists tsunamis that have caused deaths more than 1,000 km from the source (ITIC, 2019). Haida Gwaii is listed with one death in Hawai’i (USA) during the evacuation, as well as several tsunamis generated in Chile and impacting several South-West Pacific islands, the Philippines, Japan and North-America west coast. The Pacific Tsunami Warning Center (PTWC) also generates “enhanced products” which provide more targeted predictions of run-up for specific coastlines during tsunami events (IOC, 2014). These allow for more effective responses to events. Optimizing these products requires spatially dense imaging of the tsunami wavefield. Thus, the next step of this study is to analyze the contribution of a GNSS-based ship network tsunami detection on far-field events and impacts.

4.2 Ships in the far-field of tsunami events
On February 27, 2010, a megathrust earthquake of MW 8.8 occurred in the subduction zone where the Nazca plate is under thrusting the South American plate and generated a destructive trans-oceanic tsunami in the Pacific known as the 2010 Maule tsunami (Fritz et al., 2011; USGS, 2010). The Maule tsunami killed hundreds of people and caused severe damage locally. It was observed and forced evacuation of coastal communities all around the Pacific. The 2010 Maule earthquake is one of a long history of similar events occurring offshore of Chile either in the same area in central-southern Chile (1928 MW 8.0 event: Beck et al., 1998), or more north (1906 MW 8.4 event: Lomnitz, 1970; 1985 MW 7.8 event: Nakamura, 1992), or more south with the famous 1960 MW 9.5 event (Cisternas et al., 2005). All these events generated tsunamis observed throughout the Pacific Ocean with significant coastal impacts (ITIC, 2019). In comparison with the 1960 tsunami, the 2010 tsunami waves were at least three times smaller when hitting the coast of North America or Japan (Rabinovich et al., 2013).
The 2010 Maule tsunami is an interesting example of how ships both in the near-field and in the far-field of a tsunami could contribute to tsunami warning. In the 30-min TTT shown in Fig. 6, ~10 VTOS ships are located close to the coast with a standard deviation of 25 %. Thus, these ships could have provided real-time data to warning centers: a vital dataset that would contribute to more precise evacuation as the observed run-ups vary significantly on a local and regional scale (Fritz et al., 2011). In the far-field, the tsunami model shows amplitudes above 10 cm over almost two third of the Pacific (color-scale in Fig. 6 ranging from purple to green). Estimations from our AIS mapping in this area suggest ~300 VTOS ships on average. A quick comparison with the other historical events in the region and the seasonal frame of the events, shows similar numbers in ships coverage which suggest an excellent spatial and temporal coverage locally near the coast in Chile and confirms an overall excellent coverage on the Pacific. These numbers on the far-field aspect also underline that even if the tsunami event is small in amplitude, there are always ~300 new observation points capable of tsunami detection. The high number of ships in the far-field emphasizes how a warning center could benefit if this network was in place, by having large numbers of SSH observations against which to compare its numerical model predictions.
During a tsunami event, as soon as new observations of the tsunami are available, they are either incorporated into the tsunami numerical models or used to validate the numerical model predictions. The models can then be repeatedly iterated, improving the real time knowledge and calculation of the tsunami propagation and enabling a more efficient warning. Several tsunamis have shown how difficult it is to obtain a real-time precise tsunami model as uncertainties remain on the magnitude and the slip distribution. For example, the 2012 Haida Gwaii tsunami numerical models didn’t predict any big inundations in Hawai’i (Santos et al., 2016). However, a tsunami warning was issued by the PTWC after misestimating wave impacts (Zimmerman, 2012). During the 2010 Maule tsunami, tsunami models also didn’t closely match the reality: tsunami amplitude forecasted in the USA showed an average of 38 % error in estimation (Wilson et al., 2013), while the arrival time on the Japanese coast was delayed of about 30 min (Kato et al., 2011). If observations from ships in the far-field can seem less timely, their contribution as snapshots of the tsunami passage in the deep ocean constitute a unique dataset to improve tsunami numerical models in real time. Furthermore, despite the 2008 financial crisis, the COVID-19 pandemic and the effects of actual wars around the world, maritime trade is set to grow overall (ADB, 2020; UNCTAD, 2018; UNCTAD, 2023), with shipping costs back to pre-COVID-19 levels (UNCTAD, 2023) and minor port traffic variations (UNCTAD, 2022), assuring a stable temporal and spatial maritime coverage by ships for at least far-field events. Finally, the 2010 Maule tsunami is of great interest for the large datasets it benefited. Indeed, during the event, one ship equipped with the GNSS SSH measurement system was underway to Guam from Hawai’i and detected a ~10 cm amplitude (Foster et al., 2012), OBPGs deployed offshore Japan recorded the pressure change (Saito et al., 2010), and ground based GNSS TEC measurements were associated to the tsunami in Hawai’i and Japan (Galvan et al., 2011). The complementarity of all these datasets with the actual warning systems demonstrates how the tsunami models could be improved in real-time and in the long-term for future events.
During the 2010 Maule tsunami event, several DART buoys were out of function (NOAA, 2023). These important gaps in coverage are recurrent: in 2023, the DART system was functioning only 65 % uptime, and the new 2024-2028 mandated target performance is 70 %, lower than the one planned in 2018 (NOAA, 2024). A total of 39 DART is financed by the US in the Pacific, meaning that at least 10 DART are not in function at any time. Deployment cost for DART climbs to \$0.5M/site (Bernard & Titov, 2015) and the network maintenance is estimated at \$0.3M/site/year (Silva et al., 2021), which brings to a \$78M total over five years. On the other hand, a complete ship-board system is estimated at \$5k with \$1k maintenance cost mostly dedicated to replacement (Foster et al., 2024). This does not include costs for internet and the precise positioning service as industry representatives have suggested these might be donated. Over five years, which is a reasonable lifetime for such a GNSS system, and for 4,000 VTOS ships in the Pacific, that would bring a total of \$40M. The ship-based GNSS network would then clearly provide a higher spatial resolution of real-time observations complimentary to the DART system for half of the cost.

4.3 Areas with less maritime traffic
The 2022 powerful eruption of the HTHH volcano in the Kingdom of Tonga resulted in one of the most impressive and unconventional tsunamis ever observed (Gusman et al., 2022; Han & Yu, 2022). It constitutes a very instructive case in our approach as (i) the source is multi-hazard and non-seismic, (ii) the Kingdom of Tonga is located in a maritime zone with few shipping routes, (iii) however, this area is covered by hundreds of small and exposed islands with high human density on the coast, and (iv) the resulting trans-oceanic tsunami was also recorded in other oceans.
The Kingdom of Tonga is composed of 172 small islands, 45 of them inhabited distributed on a 650 km × 200 km frame along the Tonga-Kermadec subduction zone. The population is exposed to a diverse range of strong geological processes and hazards that regularly affects the archipelago (Thomas et al., 2023a). Tsunamis in Tonga may be generated from subduction megathrust earthquakes (past events: Okal et al., 2004; in 2006: Tang et al., 2008; the doublet earthquake in 2009: Lay et al., 2010), subaerial (volcano flank collapse) or submarine landslides (Frohlich et al., 2009), volcanic eruptions (Terry et al., 2022), or multi-hazard events (Lynett et al., 2022) with even a possible meteorite impact (Lavigne et al., 2021). The 2022 Tonga volcanic tsunamigenesis is often compared to the one during the 1883 Krakatau eruption and both show how crucial local and far-field observations are to improve modeling techniques and volcanic tsunami hazard assessment (Terry et al., 2022). Moreover, if no large earthquakes are associated with these events, the seismic networks are of limited use.
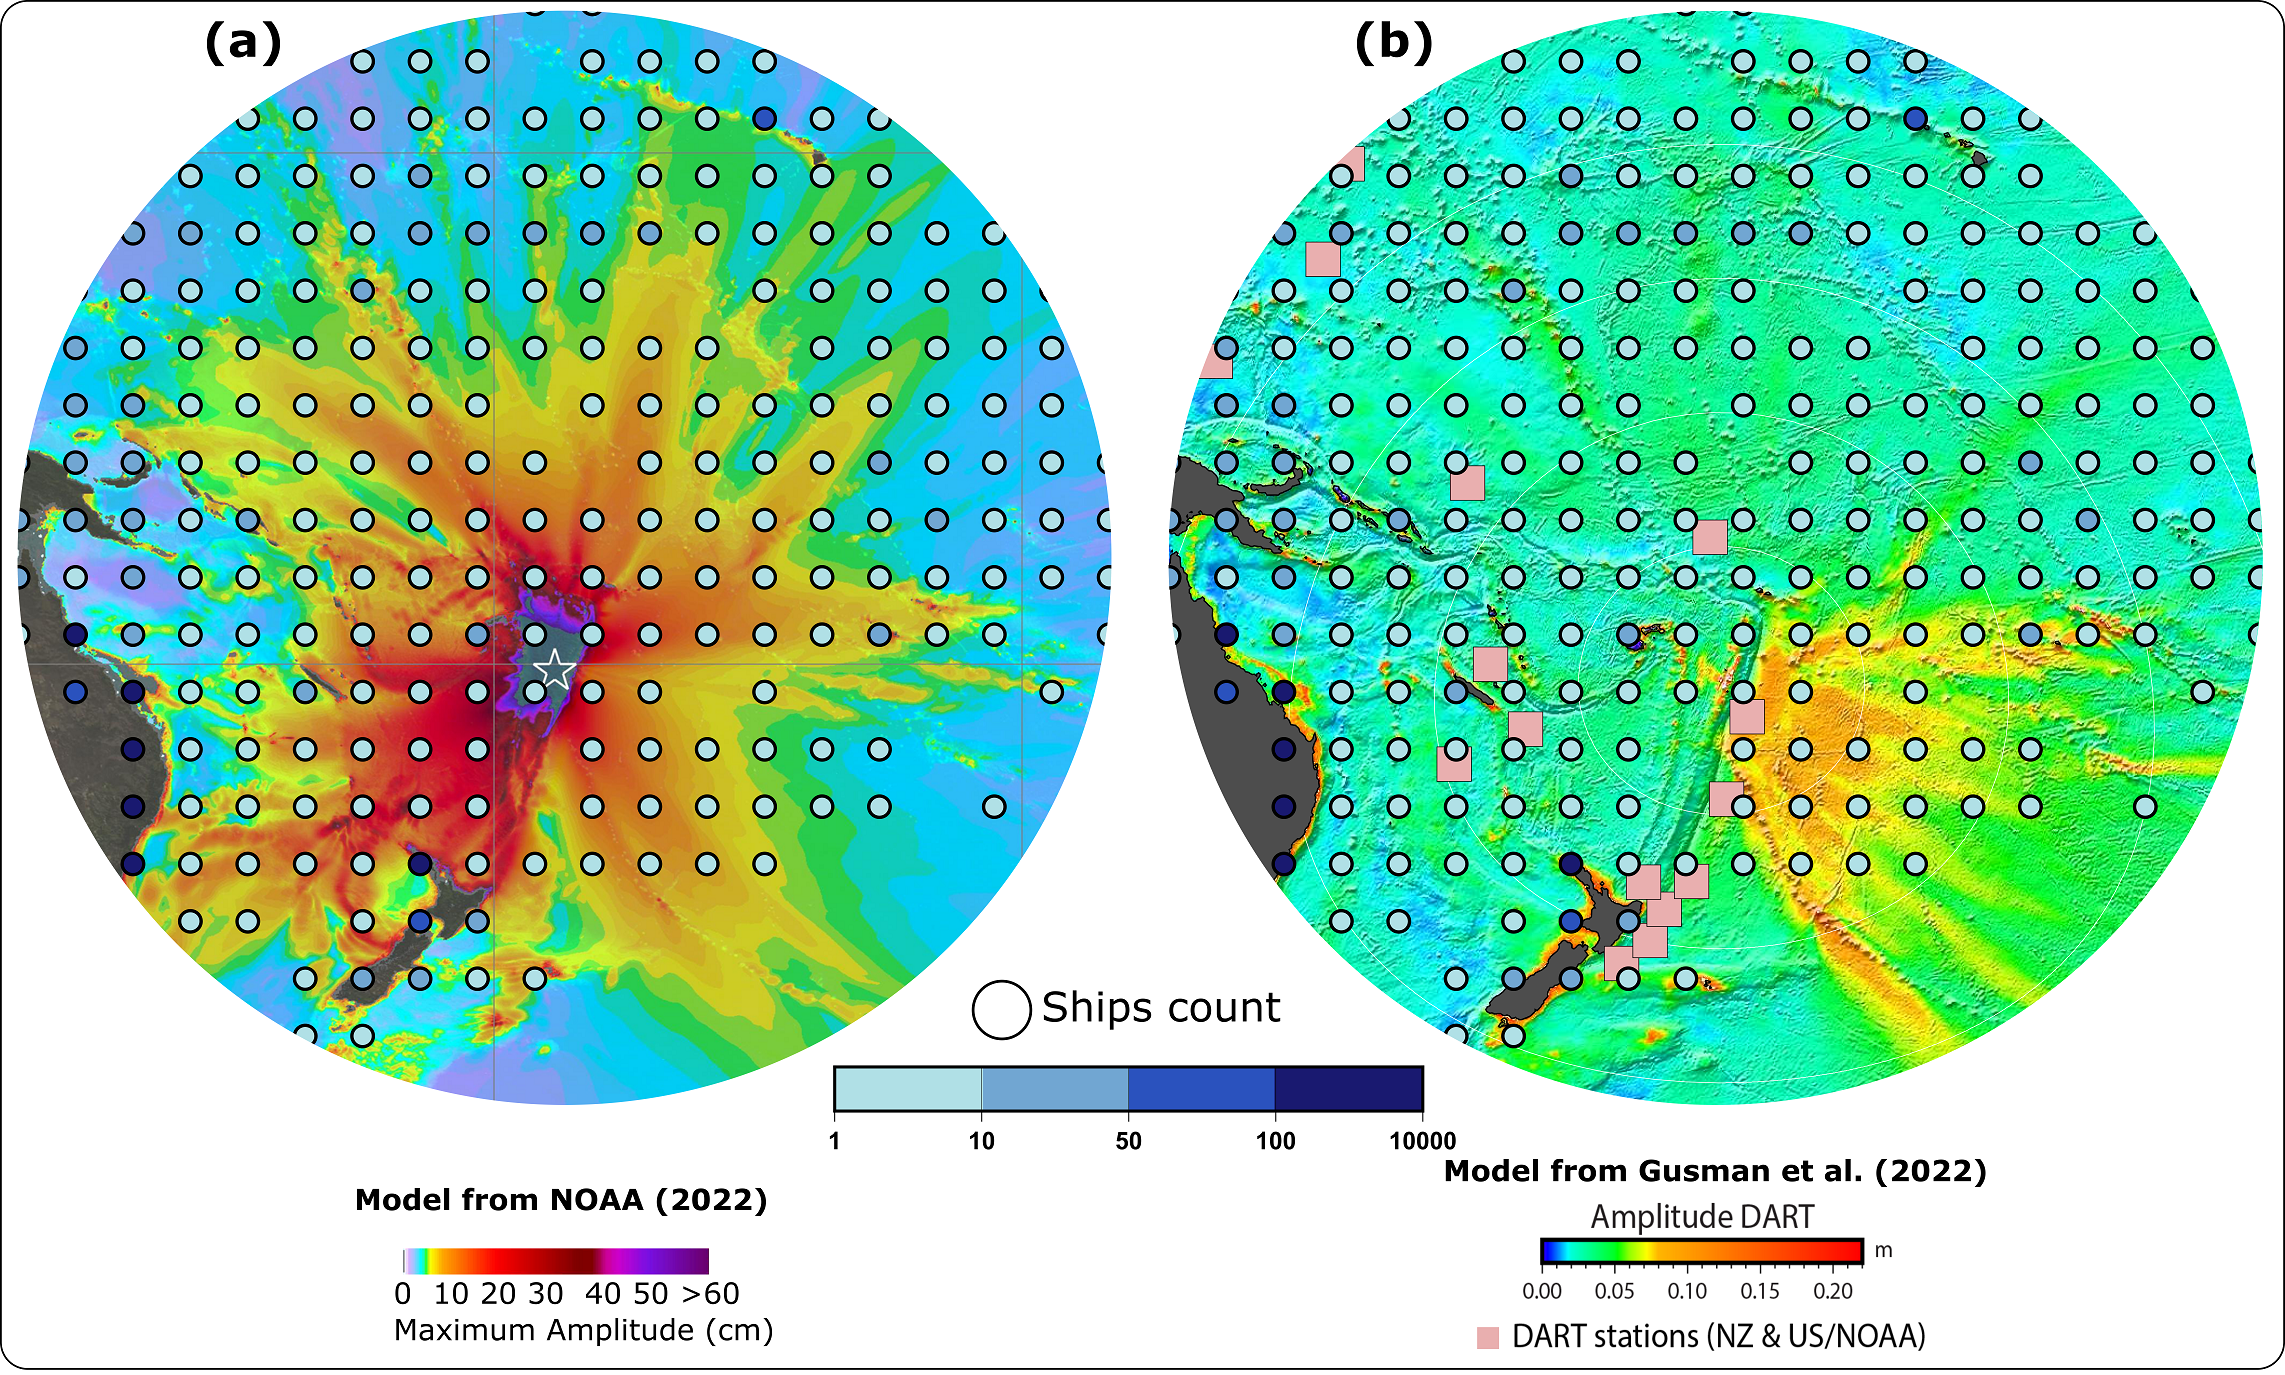
The 2022 Tonga tsunami also points out again the possibility of poor model prediction performance for non-standard source events: the tsunami surprised the scientific community by arriving two hours earlier and much larger than expected with the fast-moving atmospheric waves inducing a forerunner sea height rise (Han & Yu, 2022; Hu et al., 2023). It also lasted longer than conventionally expected due to a combination of moving and static sources (Carvajal et al., 2022; Kubota et al., 2022). Several models attempting to combine all sources have been computed. In Fig. 7a, the first quick DART-inverted model realized by the NOAA shows amplitudes in all directions above 10 cm, easily reaching New Zealand, Australia, Solomon Islands, Hawai’i and French Polynesia. In Fig. 7b, Gusman et al. (2022) analyze the air-wave generated tsunami with amplitudes above 10 cm only in the southeast direction, a propagation similar to Omira et al. (2022) model based on air-forcing. The overlap of the ships’ density indicates then different estimations: between 10 to 150 ships in the +10 cm amplitude area depending on the model. A quick look at the DART observations confirms that only the nearby ones located in New Zealand had amplitudes above the 10 cm threshold (NOAA, 2023). The first classical NOAA model is thus unrealistic. However, it is used as a base for early warning and immediate action, meaning that if we consider the potential 150 ships in the +10 cm amplitude area defined by this model, we then have 150 observations of SSH perturbations in the open-ocean that would actually show smaller amplitudes or even not see the tsunami perturbation at all. This no tsunami perturbation greater than 10 cm information is also useful because the 150 ships’ observations would then directly feed the real-time model and indicate that what was expected to be above 10 cm is actually way less. By providing a higher spatial resolution of real-time observations complimentary to the actual ones (c.f. Fig. 7b compared to DART locations), the ships would validate or improve real-time models. In this case, faster calculations of displaced water volume from the volcanic eruption and/or the underwater landslide could be realized (Heidarzadeh et al., 2022), models could be adapted taking into account the impact of atmospheric waves on ocean waves, by especially being able to determine the leading waves (Lamb waves) as a meteorological tsunami phenomenon (Carvajal et al., 2022; Suzuki et al., 2023). Ships equipped with ionospheric perturbations sensors as proposed in the introduction could improve the number of GNSS observations needed to analyze acoustic-gravity waves propagated by this eruption and tsunami (Ghent & Crowell, 2022).
The 2022 Tonga tsunami is of particular interest in this study due to its location away from large populated centers and thus away from observational infrastructure. Local observations from social media videos and interviews were available only a few weeks later, Tonga being under strict international lockdown during the COVID-19 pandemic. In an archipelago where more than 60 % of the population lives below 15 m elevation (Thomas et al., 2023a), communication was impossible due to deep-sea telecommunications cables being severed (Terry et al., 2022), creating a lack of real-time data. The tsunami was recorded on nearby tide gauges and DART sensors (Gusman & Roger 2022), as well as all across the Pacific Ocean, with impacts in Japan (Tsukanova & Medvedev, 2022), China (Wang et al., 2022) and Mexico (Ramírez-Herrera et al., 2022). Most records were from coastal gauges, leaving a huge gap in observations in the ocean. Most of the South-West Pacific is affected by a lower coverage of ships both temporally and spatially, while at the same time being a major geological hazard region as one quarter of the world’s seismicity and tsunami sources have occurred there (calculated from NGDT, 2023). There are only on average ~7 ships within the area encompassed by the 1-hour TTT just before arriving at Fiji’s east coast. With a random 11 % fleet participation, there would be no, or only one, VTOS ship in this area to capture near-field observations. This questions the potential value of a GNSS-based ship tsunami detection network in the near-field of a tsunami in areas with less maritime traffic. This lack of possible observations points in one of the highest vulnerable tsunami hazard region echoes how poorly documented this region is in tsunami-related publications compared to other regions. A literature search show that Tonga totals around 100 tsunami-related publications, half of them published after the 2022 event and almost two orders of magnitude fewer than Japan (Thomas et al., 2023b). GNSS-based ship datasets would offer a unique cost-effective tool to fill gaps in ocean observations (Metcalfe et al. 2018), contributing to more research studies and more real-time knowledge of tsunami hazard in this region. To address areas of low density of ships in our hypothetical network, we note that our VTOS concept here simply applied an 11 % selection from the full database. It is entirely possible to propose that an actual VTOS network would deliberately focus effort on soliciting collaboration from ships that operate in low-density coverage zones, resulting in a much higher percentage representation there than the 11 % average.
Another approach would be to envision the use of other type of ships in the network. Cruise ships cover all oceans and regularly transit through the South-West Pacific region making several stops around the touristic islands (e.g. cruise ships operators Compagnie du Ponant or Royal Caribbean Group destinations). Although less temporally regular, their communication links are usually excellent and would assure quick data transfer. Finally, the AIS data studied in this paper shows that 60 % of the ships in the South-West Pacific region are fishing boats, usually located all around the archipelagos and covering a wide range of the ocean never accessed by cargo ships. If the same methodology presented in this paper is applied to both cargos and fishing ships with the same rate of 11 % VOS ships, then the fishing ships contribution would definitely assure a minimum of 5 VTOS ships at all time in the near-field of any tsunami events. Additionally, it might be that the connectivity between ports of small islands in the South-West Pacific Ocean and the traditional trading partners in Oceania, Southeast Asia, East Asia and North America will increase, tending to more traffic and thus more potential VTOS data (ADB, 2020).
The worldwide impact of the 2022 Tonga tsunami (Gusman et al. 2022) even affected the atmosphere in the Black Forest in Germany, almost at the antipode of Tonga (Widmer-Schnidrig, 2022). If this can be seen as an exceptional case, several tsunamis have impacted different coastlines from different oceans: the unprecedented 2004 Indian Ocean tsunami was clearly observed in the Pacific Ocean and the 2021 South Sandwich Islands tsunami was observed in all oceans (Roger et al., 2022). Those examples reveal how crucial more observations covering all the oceans are needed to understand such extraordinary phenomenon. Our VTOS concept is not in any way limited to the Pacific, and although the Pacific Ocean is the zone of highest number of historical fatal tsunamis, they have occurred in all ocean basins. The global trade volume is at 80 % seaborne (UNCTAD, 2022) and never ceases to increase as shipping routes schedule gain in frequency and crossovers (Carlini et al., 2022; Rodrigue, 2017; Tournadre, 2014). By crossing three oceans with regular tsunami events, the Atlantic, the Indian and the Pacific, as well as the Mediterranean Sea known as another historical hotspot for tsunamis, a worldwide network of ships equipped with tsunami sensors would thus temporally and spatially cover all tsunami sources.
5 Conclusion
Tsunamis have claimed the lives of hundreds of thousands of people and are always associated with significant economic losses through infrastructure damages and costly evacuations. More temporal and spatial observations across the oceans are necessary to improve warnings and protect coastal communities. Recent studies demonstrate that a ship-based GNSS network analyzing in real-time the SSH is capable of detecting tsunamis, thus adding precise tsunami observations in an actual geodetic observational gap, and hence improving tsunami warning at a reasonable cost. We find that the commercial shipping fleet represents a vast existing infrastructure, with ~38,000 ships on average at any time in the Pacific Ocean, with the ship density highest along coastlines and most source regions of tsunamis. The one year of AIS records studied here demonstrates that 73 % of the Pacific Ocean is constantly covered by ships less than 1,000 km distant from each other, and more than 90 % of the tsunami source regions are covered by a dense ship network that could augment local and regional early warning of near-field tsunamis. For far-field events, ships would be new observations points, improving in real-time models and enabling more effective and reliable tsunami forecasting and warning. For geographic regions less visited by large ships, several options are available to densify a potential VTOS network in these low-density coverage zones. Using the global cargo ship fleet, with its persistent spatial and temporal coverage, including in tsunamigenic regions, to form a ship-based GNSS network would be a cost-effective approach for augmenting tsunami detection.
Acknowledgments
We are grateful to Dr. Aditya Gusman and Dr. Jean Roger from GNS Science, New Zealand, for sharing useful datasets and tsunami model concerning the 2022 Tonga tsunami. We would like to thank Dr. Peyman Saemian (University of Stuttgart, Germany) for his support and advice in GMT, as well as M.Sc. Vanessa Carrillo Barra (GEOAZUR, France) for the translation in Spanish of the abstract. The authors are very grateful to the editor Dr. Patrick Westfeld and three anonymous reviewers who provided constructive feedbacks to improve the quality of the article. All maps were generated using the Generic Mapping Tools (Wessel et al., 2019).
References
Amato, A. (2020). Some reflections on tsunami Early Warning Systems and their impact, with a look at the NEAMTWS. Bollettino di Geofisica Teorica ed Applicata, 61(4), pp. 403–420. https://doi.org/10.4430/bgta0329
Asian Development Bank (ADB) (2020). Trade and Maritime Transport Trends in the Pacific. Asian Development Bank. Manila, Philippines. https://doi.org/10.22617/TCS200294-2
Astafyeva, E. (2019). Ionospheric Detection of Natural Hazards. Reviews of Geophysics. 57(4), pp. 1265–1288. https://doi.org/10.1029/2019RG000668
Barnes, C. R., Best, M. M. R. and Zielinski, A. (2008). The NEPTUNE Canada Regional Cabled Ocean Observatory, Sea Technology, 49(7), pp. 10–14.
Beck, S., Barrientos, S., Kausel, E. and Reyes, M. (1998). Source characteristics of historic earthquakes along the central Chile subduction Askew et alzone. Journal of South American Earth Sciences, 11(2), pp. 115–129. https://doi.org/10.1016/S0895-9811(98)00005-4
Bernard, E. N. and Meinig, C. (2011). History and future of deep-ocean tsunami measurements. Oceans’11 MTS Kona, IEEE, Waikoloa, USA, pp. 1–7. https://doi.org/10.23919/OCEANS.2011.6106894
Bernard, E. and Titov, V. (2015). Evolution of tsunami warning systems and products, Philosophical Transactions of the Royal Society A, 373, https://doi.org/10.1098/rsta.2014.0371
Bird, P. (2003). An updated digital model of plate boundaries. Geochemistry, Geophysics, Geosystems, 4(3). https://doi.org/10.1029/2001GC000252
Bonnefond, P., Exertier, P., Laurain, O., Ménard, Y., Orsoni, A., Jeansou, E., Haines, B.J., Kubitschek, D.G. and Born, G. (2003). Leveling the Sea Surface Using a GPS-Catamaran Special Issue: Jason-1 Calibration/Validation. Marine Geodesy, 26(3–4), pp. 319–334. https://doi.org/10.1080/714044524
Bouchard, R., McArthur, S., Hansen, W., Kern, K.J. and Lockeet,L. (2007). Operational performance of the second generation deep-ocean assessment and reporting of Tsunamis (DART trade II). Oceans 2007, IEEE, Vancouver, Canada, pp. 1–6. https://doi.org/10.1109/OCEANS.2007.4449270
Brooks, B. A., Ericksen, T. L., DeSanto, J. B., Webb, S. C.,Chadwell, C. D., Nooner, S. L., Foster, J., Thomas, B., Goldberg, D. E., Haynie, K. L., Haeussler, P. J., Witter, R. C., Zumberge, M. A., Minson, S. E. and Schmidt, D. A. (2021). Seafloor Geodetic Constraints on an Instraslab Earthquake: The M7.6 2020 Sand Point, AK Earthquake [Conference presentation]. AGU Fall Meeting, New Orleans, USA. https://agu.confex.com/agu/fm21/meetingapp.cgi/Paper/965198 (accessed 8 April 2024).
Brooks, B. A., Goldberg, D., DeSanto, J., Ericksen, T. L., Webb, S. C., Nooner, S. L., Chadwell, C. D., Foster, J., Minson, S., Witter, R., Haeussler, P., Freymueller, J., Barnhart, W. and Nevitt, J. (2023). Rapid shallow megathrust afterslip from the 2021 M8.2 Chignik, Alaska earthquake revealed by seafloor geodesy. Science Advances, 9(17), eadf9299. https://doi.org/10.1126/sciadv.adf9299
Bürgmann, R. and Chadwell, D. (2014). Seafloor Geodesy. Annual Review of Earth and Planetary Sciences, 42(1), pp. 509–534. https://doi.org/10.1146/annurev-earth-060313-054953
Carlini, E., Monteiro de Lira, V., Soares, A., Etemad, M., Brandoli, B. and Matwin, S. (2022). Understanding evolution of maritime networks from automatic identification system data. GeoInformatica, 26(3), pp. 479–503. https://doi.org/10.1007/s10707-021-00451-0
Carson-Jackson, J. (2012). Satellite AIS – Developing Technology or Existing Capability? Journal of Navigation, 65(2), pp. 303–321. https://doi.org/10.1017/S037346331100066X
Carvajal, M., Sepúlveda, I., Gubler, A. and Garreaud, R. (2022). Worldwide Signature of the 2022 Tonga Volcanic Tsunami. Geophysical Research Letters, 49(6), p. e2022GL098153. https://doi.org/10.1029/2022GL098153
Cassidy, J. F., Rogers, G. C. and Hyndman, R. D. (2014). An Overview of the 28 October 2012 Mw 7.7 Earthquake in Haida Gwaii, Canada: A Tsunamigenic Thrust Event Along a Predominantly Strike-Slip Margin. Pure and Applied Geophysics, 171(12), pp. 3457–3465. https://doi.org/10.1007/s00024-014-0775-1
Chadwell, C. D., Schmidt, D. A., Webb, S. C., Nooner, S. L., Ericksen, T. L., Brooks, B. A. and Foster, J. H. (2018). Expansion of GPS-acoustic arrays offshore the cascadia and Alaska subduction zones. AGU Fall Meeting Abstracts, San Francisco, USA.
Chiu, W.-T. and Ho, Y.-S. (2007). Bibliometric analysis of tsunami research. Scientometrics, 73(1), pp. 3–17. https://doi.org/10.1007/s11192-005-1523-1
Cisternas, M., Atwater, B. F., Torrejón, F., Sawai, Y., Machuca, G., Lagos, M., Eipert, A., Youlton, C., Salgado, I., Kamataki, T., Shishikura, M., Rajendran, C. P., Malik, J.K., Rizal, Y. and Husni, M. (2005). Predecessors of the giant 1960 Chile earthquake. Nature, 437(7057), pp. 404–407. https://doi.org/10.1038/nature03943
Cummins, P. R., Kong, L. S. L. and Satake, K. (2009). Introduction to Tsunami Science Four Years After the 2004 Indian Ocean Tsunami, Part II: Observation and Data Analysis. Pure and Applied Geophysics, 166(1–2), pp. 1–7. https://doi.org/10.1007/s00024-009-0442-0
Dziewonski, A. M., Chou, T.-A. and Woodhouse, J. H. (1981). Determination of earthquake source parameters from waveform data for studies of global and regional seismicity. Journal of Geophysical Research: Solid Earth, 86(B4), pp. 2825–2852. https://doi.org/10.1029/JB086iB04p02825
Ekström, G., Nettles, M. and Dziewoñski, A. M. (2012). The global CMT project 2004–2010: Centroid-moment tensors for 13,017 earthquakes. Physics of the Earth and Planetary Interiors, 200– 201, pp. 1–9. https://doi.org/10.1016/j.pepi.2012.04.002
Fine, I. V., Cherniawsky, J. Y., Thomson, R. E., Rabinovich, A. B. and Krassovski, M. V. (2015). Observations and Numerical Modeling of the 2012 Haida Gwaii Tsunami off the Coast of British Columbia. Pure and Applied Geophysics, 172(3–4), pp. 699–718. https://doi.org/10.1007/s00024-014-1012-7
Foster, J. H., Brooks, B. A., Wang, D., Carter, G. S. and Merrifield, M. A. (2012). Improving tsunami warning using commercial ships. Geophysical Research Letters, 39(9). https://doi. org/10.1029/2012GL051367
Foster, J. H., Carter, G. S. and Merrifield, M. A. (2009). Ship-based measurements of sea surface topography. Geophysical Research Letters, 36(11). https://doi.org/10.1029/2009GL038324
Foster, J., Ericksen, T., Thomas, B., Avery, J., Xie, Y. and Knogl, R. (2024). Augmenting Tsunami Detection with a Ship-based GNSS Network. EGU General Assembly 2024, Vienna, Austria, 14–19 Apr 2024, EGU24-5841. https://doi.org/10.5194/egusphere-egu24-5841
Foster, J. H., Ericksen, T. L. and Bingham, B. (2020). Wave Glider– Enhanced Vertical Seafloor Geodesy. Journal of Atmospheric and Oceanic Technology, 37(3), pp. 417–427. https://doi.org/10.1175/JTECH-D-19-0095.1
Foster, J., Li, N. and Cheung, K. F. (2014). Sea State Determination from Ship-Based Geodetic GPS. Journal of Atmospheric and Oceanic Technology, 31(11), pp. 2556–2564. https://doi.org/10.1175/JTECH-D-13-00211.1
Fritz, H. M., Petroff, C. M., Catalán, P. A., Cienfuegos, R., Winckler, P., Kalligeris, N., Weiss, R., Barrientos, S. E., Meneses, G., Valderas-Bermejo, C., Ebeling, C., Papadopoulos, A., Contreras, M., Almar, R., Dominguez, J. C. and Synolakis, C. E. (2011). Field Survey of the 27 February 2010 Chile Tsunami. Pure and Applied Geophysics, 168(11), pp. 1989–2010. https://doi.org/10.1007/s00024-011-0283-5
Frohlich, C., Hornbach, M. J., Taylor, F. W., Shen, C.-C., Moala, ’Apai, Morton, A. E. and Kruger, J. (2009). Huge erratic boulders in Tonga deposited by a prehistoric tsunami. Geology, 37(2), pp. 131–134. https://doi.org/10.1130/G25277A.1
Galvan, D. A., Komjathy, A., Hickey, M. P. and Mannucci, A. J. (2011). The 2009 Samoa and 2010 Chile tsunamis as observed in the ionosphere using GPS total electron content: tsunami signatures observed in TEC. Journal of Geophysical Research: Space Physics, 116(A6). https://doi. org/10.1029/2010JA016204
Ghent, J. N. and Crowell, B. W. (2022). Spectral Characteristics of Ionospheric Disturbances Over the Southwestern Pacific From the 15 January 2022 Tonga Eruption and Tsunami. Geophysical Research Letters, 49(20), p. e2022GL100145. https://doi.org/10.1029/2022GL100145
Goto, K., Chagué-Goff, C., Fujino, S., Goff, J., Jaffe, B., Nishimura, Y., Richmond, B., Sugawara, D., Szczuciński, W., Tappin, D. R., Witter, R.C. and Yulianto, E. (2011). New insights of tsunami hazard from the 2011 Tohoku-oki event. Marine Geology, 290(1–4), pp. 46–50. https://doi.org/10.1016/j.margeo.2011.10.004
Grilli, S. T., Tappin, D. R., Carey, S., Watt, S. F. L., Ward, S. N., Grilli, A. R., Engwell, S. L., Zhang, C., Kirby, J. T., Schambach, L. and Muin, M. (2019). Modelling of the tsunami from the December 22, 2018 lateral collapse of Anak Krakatau volcano in the Sunda Straits, Indonesia. Scientific Reports, 9(1), p. 11946. https://doi.org/10.1038/s41598-019-48327-6
Gusiakov, V. K., Dunbar, P. K. and Arcos, N. (2019). Twenty-Five Years (1992–2016) of Global Tsunamis: Statistical and Analytical Overview. Pure and Applied Geophysics, 176(7), pp. 2795–2807. https://doi.org/10.1007/s00024-019-02113-7
Gusman, A. R. and Roger, J. (2022). Hunga Tonga-Hunga Ha’apai volcano-induced sea level oscillations and tsunami simulations. GNS Science webpage (accessed 20 October 2023).
Gusman, A. R., Roger, J., Noble, C., Wang, X., Power, W. and Burbidge, D. (2022). The 2022 Hunga Tonga-Hunga Ha’apai Volcano Air-Wave Generated Tsunami. Pure and Applied Geophysics, 179(10), pp. 3511–3525. https://doi.org/10.1007/s00024-022-03154-1
Gusman, A. R., Sheehan, A. F., Satake, K., Heidarzadeh, M., Mulia, I. E. and Maeda, T. (2016). Tsunami data assimilation of Cascadia seafloor pressure gauge records from the 2012 Haida Gwaii earthquake. Geophysical Research Letters, 43(9), pp. 4189–4196. https://doi.org/10.1002/2016GL068368
Hamlington, B. D., Leben, R. R., Godin, O. A., Legeais, J. F., Gica, E., and Titov, V. V. (2011). Detection of the 2010 Chilean tsunami using satellite altimetry. Natural Hazards and Earth System Sciences, 11(9), pp. 2391–2406. https://doi.org/10.5194/nhess-11-2391-2011
Han, P. and Yu, X. (2022). An unconventional tsunami: 2022 Tonga event. Physics of Fluids, 34(11), p. 116607. https://doi.org/10.1063/5.0122830
Hayashi, Y., Tsushima, H., Hirata, K., Kimura, K. and Maeda, K. (2011). Tsunami source area of the 2011 off the Pacific coast of Tohoku Earthquake determined from tsunami arrival times at offshore observation stations. Earth, Planets and Space, 63(7), pp. 809–813. https://doi.org/10.5047/eps.2011.06.042
Hébert, H., Occhipinti, G., Schindelé, F., Gailler, A., Pinel-Puysségur, B., Gupta, H. K., Rolland, L., Lognonné, P., Lavigne, F., Meilianda, E., Chapkanski, S., Crespon, F., Paris, A., Heinrich, P., Monnier, A., Jamelot, A. and Reymond, D. (2020). Contributions of Space Missions to Better Tsunami Science: Observations, Models and Warnings. Surveys in Geophysics, 41(6), pp. 1535–1581. https://doi.org/10.1007/s10712-020-09616-2
Heidarzadeh, M., Gusman, A.R., Ishibe, T., Sabeti, R. and Šepic, J. (2022). Estimating the eruption-induced water displacement source of the 15 January 2022 Tonga volcanic tsunami from tsunami spectra and numerical modelling. Ocean Engineering, 261, p. 112165. https://doi.org/10.1016/j. oceaneng.2022.112165
Hirata, K., Satake, K., Tanioka, Y., Kuragano, T., Hasegawa, Y., Hayashi, Y. and Hamada, N. (2006). The 2004 Indian Ocean tsunami: Tsunami source model from satellite altimetry. Earth, Planets and Space, 58(2), pp. 195–201. https://doi.org/10.1186/BF03353378
Holgate, S. J., Matthews, A., Woodworth, P. L., Rickards, L. J., Tamisiea, M. E., Bradshaw, E., Foden, P. R., Gordon, K. M., Jevrejeva, S. and Pugh, J. (2013). New Data Systems and Products at the Permanent Service for Mean Sea Level. Journal of Coastal Research, 29(3), pp. 493–504. https://doi.org/10.2112/JCOASTRES-D-12-00175.1
Hossen, M. J., Mulia, I. E., Mencin, D. and Sheehan, A. F. (2021). Data Assimilation for Tsunami Forecast With Ship–Borne GNSS Data in the Cascadia Subduction Zone. Earth and Space Science, 8(3). https://doi.org/10.1029/2020EA001390
Howe, B. M., Angove, M., Aucan, J., Barnes, C. R., Barros, J. S., Bayliff, N., Becker, N. C., Carrilho, F., Fouch, M. J., Fry, B., Jamelot, A., Janiszewski, H., Kong, L. S. L., Lentz, S., Luther, D. S., Marinaro, G., Matias, L. M., Rowe, C. A., Sakya, A. E., Salaree, A., Thiele, T., Tilmann, F. J., von Hillebrandt-Andrade, C., Wallace, L., Weinstein, S. and Wilcock, W. (2022). SMART Subsea Cables for Observing the Earth and Ocean, Mitigating Environmental Hazards, and Supporting the Blue Economy. Frontiers in Earth Science, 9, p. 775544. https://doi.org/10.3389/feart.2021.775544
Howe, B. M., Arbic, B. K., Aucan, J., Barnes, C. R., Bayliff, N., Becker, N., Butler, R., Doyle, L., Elipot, S., Johnson, G. C., Landerer, F., Lentz, S., Luther, D. S., Müller, M., Mariano, J., Panayotou, K., Rowe, C., Ota, H., Song, Y. T., Thomas, M., Thomas, P. N., Thompson, P., Tilmann, F., Weber, T. and Weinstein, S. (2019). SMART Cables for Observing the Global Ocean: Science and Implementation. Frontiers in Marine Science, 6, p. 424. https://doi.org/10.3389/fmars.2019.00424
Hu, G., Li, L., Ren, Z. and Zhang, K. (2023). The characteristics of the 2022 Tonga volcanic tsunami in the Pacific Ocean. Natural Hazards and Earth System Sciences, 23(2), pp. 675–691. https://doi.org/10.5194/nhess-23-675-2023
Iinuma, T., Kido, M., Ohta, Y., Fukuda, T., Tomita, F. and Ueki, I. (2021). GNSS-Acoustic Observations of Seafloor Crustal Deformation Using a Wave Glider. Frontiers in Earth Science, 9, p. 600946. https://doi.org/10.3389/feart.2021.600946
International Maritime Organization (IMO) (2002). Guidelines for the onboard operational use of shipborne Automatic Identification Systems.
Inazu, D., Ikeya, T., Iseki, T. and Waseda, T. (2020). Extracting clearer tsunami currents from shipborne Automatic Identification System data using ship yaw and equation of ship response. Earth, Planets and Space, 72(1). https://doi.org/10.1186/s40623-020-01165-7
Inazu, D., Ikeya, T., Waseda, T., Hibiya, T. and Shigihara, Y. (2018). Measuring offshore tsunami currents using ship navigation records. Progress in Earth and Planetary Science, 5(1). https://doi.org/10.1186/s40645-018-0194-5
Inazu, D., Waseda, T., Hibiya, T. and Ohta, Y. (2016). Assessment of GNSS-based height data of multiple ships for measuring and forecasting great tsunamis. Geoscience Letters, 3(1). https://doi.org/10.1186/s40562-016-0059-y
International Tsunami Information Center (ITIC) (2012). 28 October 2012 (UTC), Mw 7.7, Queen Charlotte Islands, Haida Gwaii, Canada Tsunami. http://itic.ioc-unesco.org/index.php?option=com_content&view=article&id=1828&Itemid=2985 (accessed 20 October 2023).
International Tsunami Information Center (ITIC) (2019). Tsunamis causing deaths greater than 1,000 km from the source location. http://itic.ioc-unesco.org/images/stories/generalinfo/visualgallery/graphics/maps/historical/Tsunamis_causing_deaths_greater_than_1000_km_from_source_2019.jpg (accessed 20 October 2023).

Intergovernmental Oceanographic Commission (IOC) (2014). User’s Guide for the Pacific Tsunami Warning Center Enhanced Products for the Pacific Tsunami Warning System. http://itic.ioc-unesco.org/images/stories/about_warnings/what_are_they/ts105-Rev2_eo_220368E.pdf (accessed 20 March 2024).
James, T., Rogers, G., Cassidy, J., Dragert, H., Hyndman, R., Leonard, L., Nykolaishen, L., Riedel, M., Schmidt, M. and Wang, K. (2013). Field Studies Target 2012 Haida Gwaii Earthquake. Eos Transactions American Geophysical Union, 94(22), pp. 197–198. https://doi.org/10.1002/2013EO220002
Jin, D. and Lin, J. (2011). Managing tsunamis through early warning systems: A multidisciplinary approach. Ocean & Coastal Management, 54(2), pp. 189–199. https://doi.org/10.1016/j.ocecoaman.2010.10.025
Kagan, Y. Y. and Jackson, D. D. (2013). Tohoku Earthquake: A Surprise? Bulletin of the Seismological Society of America, 103(2B), pp. 1181–1194. https://doi.org/10.1785/0120120110 Kaluza, P., Kölzsch, A., Gastner, M. T. and Blasius, B. (2010). The complex network of global cargo ship movements. Journal of The Royal Society Interface, 7(48), pp. 1093–1103. https://doi.org/10.1098/rsif.2009.0495
Kato, T., Terada, Y., Nishimura, H., Nagai, T. and Koshimura, S. (2011). Tsunami records due to the 2010 Chile Earthquake observed by GPS buoys established along the Pacific coast of Japan. Earth, Planets and Space, 63(6), pp. e5–e8. https://doi.org/10.5047/eps.2011.05.001
Kawaguchi, K., Kaneda, Y. and Araki, E. (2008). The DONET: A real-time seafloor research infrastructure for the precise earthquake and tsunami monitoring, Oceans 2008, IEEE, Kobe, Japan, pp. 1–4, https://doi.org/10.1109/OCEANSKOBE.2008.4530918
Kawai, H., Satoh, M., Kawaguchi, K. and Seki, K. (2013). Characteristics of the 2011 Tohoku Tsunami Waveform Acquired Around Japan by Nowphas Equipment. Coastal Engineering Journal, 55(3), pp. 1–27. https://doi.org/10.1142/S0578563413500083
Kent, E., Hall, A. D. and Leader, V. T. T. (2010). The Voluntary Observing Ship (VOS) Scheme. Proceedings from the 2010 AGU Ocean Sciences Meeting, Washington DC, USA, pp. 551–561.
Kopp, H. and all Cruise Participants (2022). Conjoint Monitoring of the Ocean Bottom offshore Chile Humboldt Organic MattEr Remineralization, Cruise No. SO288, 15.01.2022 – 15.02.2022, Guayaquil (Ecuador) – Valparaiso (Chile) COMBO & HOMER. GEOMAR Helmholtz Centre for Ocean Research Kiel. https://doi.org/10.3289/CR_SO288
Kubota, T., Saito, T. and Nishida, K. (2022). Global fast-traveling tsunamis driven by atmospheric Lamb waves on the 2022 Tonga eruption. Science, 377(6601), pp. 91–94. https://doi.org/10.1126/science.abo4364
Lander, J. F., Whiteside, L. S. and Lockridge, P. A. (2003). Two decades of global tsunamis. Science of Tsunami Hazards, 21(1), pp. 3–88.
Lavigne, F., Morin, J., Wassmer, P., Weller, O., Kula, T., Maea, V., Kelfoun, K., Mokadem, F., Paris, R., Malawani, M. N., Faral, A., Benbakkar, M., Saulnier-Copard, S., Vidal, C. M., Tu’I’afitu, T., Kitekei’aho, F., Trautmann, M. and Gomez, C. (2021). Bridging Legends and Science: Field Evidence of a Large Tsunami that Affected the Kingdom of Tonga in the 15th Century. Frontiers in Earth Science, 9, p. 748755. https://doi.org/10.3389/feart.2021.748755
Lay, T., Ammon, C. J., Kanamori, H., Rivera, L., Koper, K. D. and Hutko, A. R. (2010). The 2009 Samoa–Tonga great earthquake triggered doublet. Nature, 466(7309), pp. 964–968. https://doi.org/10.1038/nature09214
Le Tixerant, M., Le Guyader, D., Gourmelon, F. and Queffelec, B. (2018). How can Automatic Identification System (AIS) data be used for maritime spatial planning? Ocean & Coastal Management, 166, pp. 18–30. https://doi.org/10.1016/j.ocecoaman.2018.05.005
Leonard, L. J. and Bednarski, J. M. (2014). Field Survey Following the 28 October 2012 Haida Gwaii Tsunami. Pure and Applied Geophysics, 171(12), pp. 3467–3482. https://doi.org/10.1007/s00024-014-0792-0
Leonard, L. J., Rogers, G. C. and Hyndman, R. D. (2010). Annotated bibliography of references relevant to tsunami hazard in Canada. Geological Survey of Canada, 6552. https://doi.org/10.4095/285367
Leonard, L. J., Rogers, G. C. and Mazzotti, S. (2012). A preliminary tsunami hazard assessment of the Canadian Coastline. Geological Survey of Canada, 7201. https://doi.org/10.4095/292067
Li, X., Ge, M., Dai, X., Ren, X., Fritsche, M., Wickert, J. and Schuh, H. (2015). Accuracy and reliability of multi-GNSS real-time precise positioning: GPS, GLONASS, BeiDou, and Galileo. Journal of Geodesy, 89, pp. 607–635, https://doi.org/10.1007/s00190-015-0802-8
Lomnitz, C. (1970). Major earthquakes and tsunamis in Chile during the period 1535 to 1955. Geologische Rundschau, 59(3), pp. 938–960. https://doi.org/10.1007/BF02042278
Løvholt, F., Setiadi, N. J., Birkmann, J., Harbitz, C. B., Bach, C., Fernando, N., Kaiser, G. and Nadim, F. (2014). Tsunami risk reduction – are we better prepared today than in 2004? International Journal of Disaster Risk Reduction, 10, pp. 127–142. https://doi.org/10.1016/j.ijdrr.2014.07.008
Lynett, P., McCann, M., Zhou, Z., Renteria, W., Borrero, J., Greer, D., Fa’anunu, O., Bosserelle, C., Jaffe, B., La Selle, S., Ritchie, A., Snyder, A., Nasr, B., Bott, J., Graehl, N., Synolakis, C., Ebrahimi, B. and Cinar, G. E. (2022). Diverse tsunamigenesis triggered by the Hunga Tonga-Hunga Ha’apai eruption. Nature, 609(7928), pp. 728–733. https://doi.org/10.1038/s41586-022-05170-6
Manta, F., Occhipinti, G., Feng, L. and Hill, E. M. (2020). Rapid identification of tsunamigenic earthquakes using GNSS ionospheric sounding. Scientific Reports, 10(1), p. 11054. https://doi.org/10.1038/s41598-020-68097-w
Matias, L., Carrilho, F., Sá, V., Omira, R., Niehus, M., Corela, C., Barros, J. and Omar, Y. (2021). The Contribution of Submarine Optical Fiber Telecom Cables to the Monitoring of Earthquakes and Tsunamis in the NE Atlantic. Frontiers in Earth Science, 9, p. 686296. https://doi.org/10.3389/feart.2021.686296
Metcalfe, K., Bréheret, N., Chauvet, E., Collins, T., Curran, B. K., Parnell, R. J., Turner, R. A., Witt, M. J. and Godley, B. J. (2018). Using satellite AIS to improve our understanding of shipping and fill gaps in ocean observation data to support marine spatial planning. Journal of Applied Ecology, 55(4), pp. 1834– 1845. https://doi.org/10.1111/1365-2664.13139
Mulia, I. E., Hirobe, T., Inazu, D., Endoh, T., Niwa, Y., Gusman, A. R., Tatehata, H., Waseda, T. and Hibiya, T. (2020). Advanced tsunami detection and forecasting by radar on unconventional airborne observing platforms. Scientific Reports, 10(1), p. 2412. https://doi.org/10.1038/s41598-020-59239-1
Mulia, I. E., Inazu, D., Waseda, T. and Gusman, A. R. (2017). Preparing for the Future Nankai Trough Tsunami: A Data Assimilation and Inversion Analysis From Various Observational Systems. Journal of Geophysical Research: Oceans, 122(10), pp. 7924–7937. https://doi.org/10.1002/2017JC012695
Mulia, I. E. and Satake, K. (2020). Developments of Tsunami Observing Systems in Japan. Frontiers in Earth Science, 8, p. 145. https://doi.org/10.3389/feart.2020.00145
Mulia, I. E. and Satake, K. (2021). Synthetic analysis of the efficacy of the S-net system in tsunami forecasting. Earth, Planets and Space, 73(36), https://doi.org/10.1186/s40623-021-01368-6
Mulia, I. E., Ueda, N., Miyoshi, T., Gusman, A. R. and Satake, K. (2022). Machine learning-based tsunami inundation prediction derived from offshore observations. Nature Communications, 13(1), p. 5489. https://doi.org/10.1038/s41467-022-33253-5
Nakamura, S. (1992). An analysis of the 1985 Chilean tsunami. Marine Geodesy, 15(4), pp. 277–281. https://doi.org/10.1080/01490419209388064
National Geophysical Data Center (NGDT) (2023). Global Historical Tsunami Database. NOAA National Centers for Environmental Information. https://doi.org/10.7289/V5PN93H7
National Oceanic and Atmospheric Administration (NOAA) (2022). Hunga Tonga-Hunga Ha’apa Volcano-generated Tsunami, January 15, 2022, Main Event Page. NOAA Center for Tsunami Research webpage, https://nctr.pmel.noaa.gov/tonga20220115/ (accessed 20 October 2023).
National Oceanic and Atmospheric Administration (NOAA) (2023). DART® (Deep-ocean Assessment and Reporting of Tsunamis). NOAA Center for Tsunami Research webpage, https://nctr.pmel.noaa.gov/Dart/ (accessed 20 October 2023).
National Oceanic and Atmospheric Administration (NOAA) (2024). Budget Estimates, Fiscal Year 2024, Congressional Submission. NOAA, https://www.noaa.gov/sites/default/files/2023-04/NOAA_FY24_CJ.pdf (accessed 22 March 2024).
Nie, Z., Liu, F. and Gao, Y. (2020). Real-time precise point positioning with a low-cost dual-frequency GNSS device. GPS Solutions, 24(9), https://doi.org/10.1007/s10291-019-0922-3
Occhipinti, G., Komjathy, A. and Lognonné, P. (2008). Tsunami detection by GPS. GPS world, 19(2), pp. 51–57.
Okal, E. A., Borrero, J. and Synolakis, C. E. (2004). The earthquake and tsunami of 1865 November 17: evidence for far-field tsunami hazard from Tonga. Geophysical Journal International, 157(1), pp. 164–174. https://doi.org/10.1111/j.1365-246X.2004.02177.x
Okal, E. A., Piatanesi, A. and Heinrich, P. (1999). Tsunami detection by satellite altimetry. Journal of Geophysical Research: Solid Earth, 104(B1), pp. 599–615. https://doi.org/10.1029/1998JB000018
Omira, R., Ramalho, R. S., Kim, J., González, P. J., Kadri, U., Miranda, J. M., Carrilho, F. and Baptista M. A. (2022). Global Tonga tsunami explained by a fast-moving atmospheric source. Nature, 609, pp. 734–740, https://doi.org/10.1038/s41586-022-04926-4
Permanent Service for Mean Sea Level (PSMSL) (2024). Gauge Data. http://www.psmsl.org/data/obtaining/ (accessed 15 January 2024).
Qayyum, B., Ahmed, A., Ullah, I. and Shah, S. A. (2022). A Fuzzy-Logic Approach for Optimized and Cost-Effective Early Warning System for Tsunami Detection. Sustainability, 14(21), p. 14516. https://doi.org/10.3390/su142114516
Rabinovich, A. B., Thomson, R. E. and Fine, I. V. (2013). The 2010 Chilean Tsunami Off the West Coast of Canada and the Northwest Coast of the United States. Pure and Applied Geophysics, 170(9– 10), pp. 1529–1565. https://doi.org/10.1007/s00024-012-0541-1 Rabinovich, A. B., Thomson, R. E., Titov, V. V., Stephenson, F. E. and Rogers, G. C. (2008). Locally generated tsunamis recorded on the coast of British Columbia. Atmosphere-Ocean, 46(3), pp. 343–360. https://doi.org/10.3137/ao.460304
Ramírez-Herrera, M. T., Coca, O. and Vargas-Espinosa, V. (2022). Tsunami Effects on the Coast of Mexico by the Hunga Tonga-Hunga Ha’apai Volcano Eruption, Tonga. Pure and Applied Geophysics, 179(4), pp. 1117–1137. https://doi.org/10.1007/s00024-022-03017-9
Ravanelli, M. and Foster, J. (2020). Detection of tsunami induced ionospheric perturbation with ship-based GNSS measurements: 2010 Maule tsunami case study. EGU General Assembly 2020, Online, 4–8 May 2020, EGU2020-11583. https://doi.org/10.5194/egusphere-egu2020-11583
Röbke, B. R. and Vött, A. (2017). The tsunami phenomenon. Progress in Oceanography, 159, pp. 296–322. https://doi.org/10.1016/j.pocean.2017.09.003
Rocken, C., Johnson, J., van Hove, T. and Iwabuchi, T. (2005). Atmospheric water vapor and geoid measurements in the open ocean with GPS. Geophysical Research Letters, 32(12). https://doi.org/10.1029/2005GL022573
Rodrigue, J.-P. (2017). Maritime Transport. In D. Richardson et al. (eds) International Encyclopedia of Geography (1st edn, pp. 1–7). Wiley. https://doi.org/10.1002/9781118786352.wbieg0155
Roger, J., Hebert, H., Jamelot, A., Gusman, A., Power, W., Hubbard, J. (2022). The South Sandwich circum-Antarctic tsunami of August 12, 2021: widespread propagation using oceanic ridges. EGU 2022, Vienna, Austria. https://doi.org/10.5194/egusphere-egu22-904
Saito, T., Matsuzawa, T., Obara, K. and Baba, T. (2010). Dispersive tsunami of the 2010 Chile earthquake recorded by the high–sampling–rate ocean–bottom pressure gauges. Geophysical Research Letters, 37(23). https://doi.org/10.1029/2010GL045290
Salaree, A., Howe, B. M., Huang, Y., Weinstein, S. A. and Sakya, A. E. (2023). A Numerical Study of SMART Cables Potential in Marine Hazard Early Warning for the Sumatra and Java Regions. Pure and Applied Geophysics, 180, pp. 1717–1749. https://doi.org/10.1007/s00024-022-03004-0
Santos, A., Tavares, A.O. and Queirós, M. (2016). Numerical modelling and evacuation strategies for tsunami awareness: lessons from the 2012 Haida Gwaii Tsunami. Geomatics, Natural Hazards and Risk, 7(4), pp. 1442–1459. https://doi.org/10.1080/19475705.2015.1065292
Satake, K., Fujuu, Y., Harada, T. and Namegaya, Y. (2013). Time and Space Distribution of Coseismic Slip of the 2011 Tohoku Earthquake as Inferred from Tsunami Waveform Data. Bulletin of the Seismological Society of America, 103(2B), pp. 1473–1492. https://doi.org/10.1785/0120120122
Savastano, G., Komjathy, A., Verkhoglyadova, O., Mazzoni, A., Crespi, M., Wei, Y. and Mannucci, A. J. (2017). Real-Time Detection of Tsunami Ionospheric Disturbances with a Stand-Alone GNSS Receiver: A Preliminary Feasibility Demonstration. Scientific Reports, 7(1), p. 46607. https://doi.org/10.1038/srep46607
Schambach, L., Grilli, S. T. and Tappin, D.R. (2021). New High-Resolution Modeling of the 2018 Palu Tsunami, Based on Supershear Earthquake Mechanisms and Mapped Coastal Landslides, Supports a Dual Source. Frontiers in Earth Science, 8, p. 598839. https://doi.org/10.3389/feart.2020.598839
Silva, N., Catarino, N., Ávila, N., Baptista, M. A. and Wronna, M. (2021). Tsunami detection from Space – a nearly real-time system to detect ocean surface altimetric anomalies with satellites. deimos webpage, https://elecnor-deimos.com/tsunami-prevention-gnss-r/ (accessed 22 March 2024).
Soloviev, S. L. and Go, N. (1975). Catalogue of tsunamis of the eastern shore of the Pacific Ocean (1513-1968). Nauka Publishing House. Moscow, Russia.
Srinivasa Kumar, T. and Manneela, S. (2021). A Review of the Progress, Challenges and Future Trends in Tsunami Early Warning Systems. Journal of the Geological Society of India, 97(12), pp. 1533–1544. https://doi.org/10.1007/s12594-021-1910-0
Suzuki, T., Nakano, M., Watanabe, S., Tatebe, H. and Takano, Y. (2023). Mechanism of a meteorological tsunami reaching the Japanese coast caused by Lamb and Pekeris waves generated by the 2022 Tonga eruption. Ocean Modelling, 181, p. 102153. https://doi.org/10.1016/j.ocemod.2022.102153
Synolakis, C. E. and Bernard, E. N. (2006). Tsunami science before and beyond Boxing Day 2004. Philosophical Transactions of the Royal Society A: Mathematical, Physical and Engineering Sciences, 364(1845), pp. 2231–2265. https://doi.org/10.1098/rsta.2006.1824
Tang, L., Titov, V. V., Wei, Y., Mofjeld, H.O., Spillane, M., Arcas, D., Bernard, E. N., Chamberlin, C., Gica, E. and Newman, J. (2008). Tsunami forecast analysis for the May 2006 Tonga tsunami. Journal of Geophysical Research: Oceans, 113(C12), p. 2008JC004922. https://doi.org/10.1029/2008JC004922
Terry, J. P., Goff, J., Winspear, N., Bongolan, V. P. and Fisher, S. (2022). Tonga volcanic eruption and tsunami, January 2022: globally the most significant opportunity to observe an explosive and tsunamigenic submarine eruption since AD 1883 Krakatau. Geoscience Letters, 9(1), p. 24. https://doi.org/10.1186/s40562-022-00232-z
Thomas, B. E. O., Roger, J., Gunnell, Y. and Ashraf, S. (2023a). A method for evaluating population and infrastructure exposed to natural hazards: tests and results for two recent Tonga tsunamis. Geoenvironmental Disasters, 10(1), p. 4. https://doi.org/10.1186/s40677-023-00235-8
Thomas, B. E. O., Roger, J., Gunnell, Y. and Pala, I. (2023b). Geovisualization of Tsunami-related Studies Around the World. AOGS 20th Annual Meeting, Singapore, Singapore, 30 July – 4 August 2023, AOGS23-6881
Tilmann, F., Howe, B., Butler, R. and Weinstein, S. (2016). SMART Submarine Cable Applications in Earthquake and Tsunami Science and Early Warning. Report on workshop, Potsdam, Germany, 3–4 November 2016, https://www.itu.int/en/ITU-T/climatechange/task-force-sc/Documents/Report-WS-11-2016-Potsdam.pdf (accessed 27 March 2024).
Titov, V. V. (2021). Hard Lessons of the 2018 Indonesian Tsunamis. Pure and Applied Geophysics, 178(4), pp. 1121–1133. https://doi.org/10.1007/s00024-021-02731-0
Tournadre, J. (2014). Anthropogenic pressure on the open ocean: The growth of ship traffic revealed by altimeter data analysis. Geophysical Research Letters, 41(22), pp. 7924–7932. https://doi.org/10.1002/2014GL061786
Trimble (2024). Positioning service. https://positioningservices.trimble.com/en/rtx (accessed 21 March 2024).
Tsukanova, E. and Medvedev, I. (2022). The Observations of the 2022 Tonga-Hunga Tsunami Waves in the Sea of Japan. Pure and Applied Geophysics, 179(12), pp. 4279–4299. https://doi.org/10.1007/s00024-022-03191-w
Tsushima, H., Hino, R., Ohta, Y., Iinuma, T. and Miura S. (2014). tFISH/RAPiD: Rapid improvement of near-field tsunami forecasting based on offshore tsunami data by incorporating onshore GNSS data. Geophysical Research Letters, 41(10), pp. 3390–3397. https://doi.org/10.1002/2014GL059863
United Nations Conference on Trade and Development (UNCTAD) (2018). 50 Years of Review of Maritime Transport, 1968-2018: Reflecting on the past, exploring the future.
United Nations Conference on Trade and Development (UNCTAD) (2022). Review of Maritime Transport 2022: Navigating stormy waters. United Nations Publications. Geneva, Switzerland.
United Nations Conference on Trade and Development (UNCTAD) (2023). Review of Maritime Transport 2023: Towards a green and just transition. United Nations Publications. Geneva, Switzerland.
US Geological Survey (USGS) (2010). M 8.8 – 36 km WNW of Quirihue, Chile. https://earthquake.usgs.gov/earthquakes/eventpage/official20100227063411530_30/executive (accessed 20 October 2023).
US Geological Survey (USGS) (2012). M 7.8 – 206 km SW of Prince Rupert, Canada. https://earthquake.usgs.gov/earthquakes/eventpage/usp000juhz/executive (accessed 20 October 2023).
Wang, X. and Power, W. L. (2011). COMCOT : a tsunami generation, propagation and run-up model. GNS Science report 2011/43.
Wang, D., Walsh, D., Becker, N. C. and Fryer, G. J. (2009). A methodology for tsunami wave propagation forecast in real time. AGU Fall Meeting, San Francisco, USA, pp. OS43A-1367. Wang, Y., Wang, P., Kong, H. and Wong, C.-H. (2022). Tsunamis in Lingding Bay, China, caused by the 2022 Tonga volcanic eruption. Geophysical Journal International, 232(3), pp. 2175–2185. https://doi.org/10.1093/gji/ggac291
Wessel, P., Luis, J.F., Uieda, L., Scharroo, R., Wobbe, F., Smith, W. H. F., and Tian, D. (2019). The Generic Mapping Tools version 6. Geochemistry, Geophysics, Geosystems, 20, pp. 5556–5564. https://doi.org/10.1029/2019GC008515
Widmer-Schnidrig, R. (2022). Observation of acoustic normal modes of the atmosphere after the 2022 Hunga-Tonga eruption. EGU 2022, Vienna, Austria. https://doi.org/10.5194/egusphere-egu22-13581
Wilson, R. I., Admire, A. R., Borrero, J. C., Dengler, L. A., Legg, M. R., Lynett, P., McCrink, T. P., Miller, K. M., Ritchie, A., Sterling, K. and Whitmore, P. M. (2013). Observations and Impacts from the 2010 Chilean and 2011 Japanese Tsunamis in California (USA). Pure and Applied Geophysics, 170(6–8), pp. 1127– 1147. https://doi.org/10.1007/s00024-012-0527-z
World Shipping Council (WSC) (2023). The Top 50 Container Ports. WSC webpage. https://www.worldshipping.org/top-50-ports (accessed 20 October 2023).
Xerandy, X., Znati, T., and Comfort, L.K. (2015). Cost-effective, cognitive undersea network for timely and reliable near-field tsunami warning. International Journal of Advanced Computer Science and Applications, 6(7), pp. 224–233.
Yin, J. and Shi, J. (2018). Seasonality patterns in the container shipping freight rate market. Maritime Policy & Management, 45(2), pp. 159–173. https://doi.org/10.1080/03088839.2017.1420260
Zimmerman, M. (2012). Pacific tsunami warning center miscalculated wave impact on Hawaii shores. Hawaii air report online. http://www.hawaiireporter.com/pacific-tsunami-warning-center-miscalculated-wave-impact-on-hawaii-shores/123 (accessed 20 October 2023).
Authors’ biographies

Bruce E. O. Thomas received a M.Sc. degree in geomatics applied to risk and resilience studies at the ENSG-Geomatics and ENTPE engineer schools in France in 2019. He worked on volcanic ground deformation using GNSS data at the University of Hawai‘i, Honolulu, USA, as well as tsunami hazard mapping at the Research Institute for Development, Nouméa, New Caledonia. He is now a research assistant and Ph.D. student at the University of Stuttgart, Germany. His current research explores the application of cost-effective geodetic techniques for natural hazard assessment and warning studies in the Pacific region.

James H. Foster received a B.Sc. degree in geophysics from the University of Edinburgh, Edinburgh, U.K., in 1991 and a Ph.D. degree in geology and geophysics from the University of Hawai‘i, Manoa Honolulu, HI, in 2002. He is Professor of Space Geodetic Techniques at the University of Stuttgart. His current research interests include the applications of geodetic techniques to the detection and mitigation of natural hazards.

Tasnîme Louartani received a M.Sc. degree in geomatics specialized in data science at the ENSG-Geomatics in France in 2023. She worked at the University of Stuttgart on mapping cargo ships in the Pacific Ocean. She is currently a research engineer focusing on data management and exchange in the context of urban research and sustainable development at the University Gustave Eiffel, Champs-sur-Marne, France.