


Abstract
1 Introduction
A height system is a one-dimensional coordinate system employed to represent the vertical distance (height) of a point in relation to a chosen reference surface. There are two primary height systems used in geodetic positioning: Orthometric height and Ellipsoidal height. Orthometric height measures the vertical distance from a point on the Earth’s surface to the geoid along the curved plumb line, while ellipsoidal height represents the vertical distance from a point on the Earth’s surface to the reference ellipsoid along the ellipsoidal normal.
The geoid, closely associated with the undisturbed global mean sea level, is a fundamental equipotential surface of Earth’s gravity field. Establishing the relationship between ellipsoidal height and orthometric height relies on geoid undulation modelling. This model is pivotal in geodetic infrastructure and continues to be a focal point in ongoing research. Its applications span geodesy and surveying, facilitating the conversion between ellipsoidal and orthometric heights. As reliance on Global Navigation Satellite Systems (GNSS) grows, the imperative for developing accurate and reliable geoid undulation models at centimeter-level precision across entire countries intensifies, requiring multiple resources (Wang et al., 2021).
On land, achieving a precise geoid model is possible through a combination of precise leveling, GNSS, and gravimetry. However, conducting leveling measurements in marine areas is impractical. Nonetheless, precise gravity data can be obtained through spaceborne, airborne, and shipborne gravimetry. However, processing challenges may arise due to the dynamic movements of the measurement platform, potentially leading to systematic errors.
The integration of airborne and shipborne gravity data into global and regional gravity models has been demonstrated to enhance their accuracy. A notable example of the successful integration of airborne gravity measurements into a local geoid model is evident in projects conducted around the island of Corsica (Duquenne et al., 2002) and the Greenland continental shelf (Forsberg et al., 2001), where improvements of several tens of centimeters were realized. Another instance is a study conducted in Japan, where the merge of shipborne gravity data and terrestrial gravity measurements with an altimetry-based gravity model led to an enhancement of several centimeters in the local geoid model (Kuroishi, 2009). Satellite altimetry is a valuable technology for monitoring sea level, primarily optimized for open ocean surfaces. Nevertheless, there have been numerous efforts to harness the potential of altimetry in the coastal zone. Enhancements in altimetry capabilities within coastal regions are discussed in Xu et al. (2019).
A fusion of shipboard gravimetry measurements with GNSS measurements is discussed in Lu et al. (2019). Their paper focuses on the data processing strategy for shipborne gravimetry, aiming to achieve high-accuracy and high-resolution gravimetry measurements in the Baltic Sea. The study investigates the use of GNSS-derived kinematic vertical accelerations to enhance the quality of gravity data.
In the absence of high-quality airborne and shipborne gravity measurements, geoid heights can be derived using shipborne GNSS measurements. These geoid heights derived from GNSS measurements can then be utilized for the expansion and enhancement of local geoid models. This method was applied to create a local geoid model in northern Germany, revealing that the standard deviation of the differences between the existing local model and the model adjusted using GNSS measurements is better than 2 cm (Lavrov et al., 2015). The method was also employed to extend the geoid undulation model in coastal areas along the Mediterranean Sea in Israel (Lavrov et al., 2017). The study’s results demonstrated that geoid heights can be obtained with an accuracy of better than 2 cm and at a reduced cost compared to airborne and shipborne gravity measurements. A similar approach was employed by Varbla et al. (2020), which details the outcomes of a shipborne marine gravity and GNSS campaign designed to validate existing geoid models in the eastern part of the Baltic Sea. In an experiment conducted in the Gulf of Finland, GNSS measurements were utilized alongside gravity observations and sea level models to validate the existing geoid models in the region (Saari et al., 2021). The researchers successfully obtained geoid heights in the marine environment with an accuracy of a few centimeters. According to the research findings, the standard deviations of the differences between local geoid models and geoid heights derived from GNSS ranged from 1.4 to 6.3 centimeters.
In this study, we rely on a single shipborne GNSS receiver and nautical measurements to determine geoid undulation along the Haifa Bay coast in Israel, with the aim of expanding the official Israeli geoid undulation model to include the coastal area. We employed hydrographic surveys conducted across Haifa Bay to facilitate the development of the new HaMifratz port. The data were obtained from a dedicated survey vessel, and the resulting geoid model integrates multiple measurement profiles into a unified representation.
2 Methodology
The geoid, mean sea surface (MSS), and mean dynamic topography (MDT) are fundamental concepts in geodesy and oceanography, essential for understanding sea level variations and their practical implications. The MSS is the observed average sea level over a long period, influenced by factors like tides, ocean currents, and atmospheric pressure, and measured using satellite altimetry and tide gauges. The MSS is practical for representing sea level but is affected by forces causing deviations from the geoid. The MDT, representing the difference between the MSS and the geoid, reflects the ocean’s dynamic response to currents, temperature, and salinity variations, showing sea level changes due to these processes. Sea surface topography (SST), also known as dynamic topography (DT), is the difference between the instantaneous sea surface height and the geoid. MDT is the time-averaged SST. The interrelationships between these concepts are crucial for understanding sea level variations. The unobservable nature of the geoid means that the MSS, influenced by dynamic factors, is used as a practical approximation. Consequently, SST provides valuable insights into the dynamic processes affecting sea level.
Expanding the geoid undulation model to the sea involves computation of geoid heights in coastal and sea areas and integrating them into the official Israeli geoid undulation model. In this study, such an expansion utilizes shipborne GNSS and nautical measurements. The ellipsoidal height of the phase center of the GNSS antenna mounted on the ship is measured. The critical aspect is that under certain conditions, the sea surface defines the “zero” orthometric height, effectively describing the geoid. Therefore, the challenge lies in reducing the ellipsoidal height of the antenna’s phase center to sea level and calculating, for each measured epoch, the correction from the sea level to the geoid. To derive these geoid heights, the raw data must undergo several corrections, accounting for the vessel’s dynamic motion, tidal effects, atmospheric variations, and sea surface topography.
Lavrov et al. (2015 and 2017) provide a detailed explanation of the essence of the corrections, their nature, and the way of realization. The method of performing the measurements, processing the data, and realizing the corrections for expanding the geoid undulation model in this study is outlined in the flow chart shown in Fig. 1 and described in more detail in the next chapter.

3 Experiment set up, data collection and processing
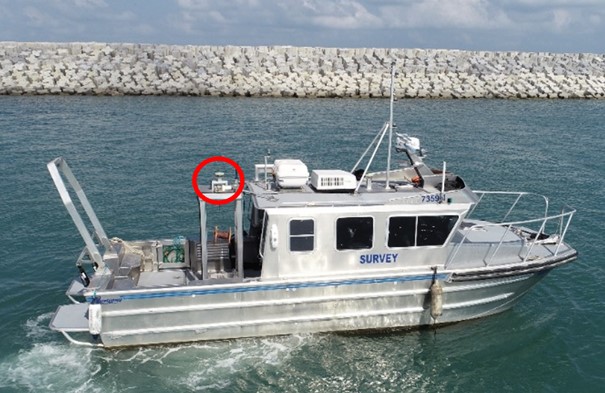
To expand the official Israeli geoid undulation model to cover coastal areas along the coast of Haifa Bay in Israel three survey campaigns were carried out in the years 2019, 2020 and 2021. The survey vessel ADEL (Fig. 2) was used. The vessel was constructed by Armstrong Marine USA, a company specializing in manufacturing vessels tailored for hydrographic surveys, and its structure is specifically adapted to the demands of this task. Notably, the boat is designed to position the measuring system near the center of gravity, minimizing fluctuations. Additionally, it features a bottom with two pontoons, enhancing stability. Thus, this ship is optimized for conducting hydrographic surveys in coastal areas.
The vessel is equipped with the NORBIT iWBMS multibeam sonar system and the Motion Reference Unit (MRU) of the Applanix POS MV, WaveMaster II model. The MRU, housed within the sonar, is a comprehensive turnkey system, meticulously designed to provide precise attitude, heading, and heave data. Paired with a TRIMBLE GPS receiver, this sensor seamlessly integrates to deliver accurate position and velocity information for the vessel. The sensor is distinguished by its high precision, measuring roll and pitch angles with an accuracy of 0.02 degrees and measuring vertical elevation (Heave), with an absolute accuracy of up to 2 cm. The GPS antenna (Trimble 540AP) is rigidly mounted to the ship’s hull, significantly enhancing the quality of GPS measurements and it is positioned directly above the MRU.
As part of the research, a VALEPORT TideMaster radar tide gauge instrument was employed to continuously measure the combined effect of the tide and sea surface topography. It is located in the HaMifratz port close to the work and research area. The tide gauge operated as follows: it measured once per second for 30 seconds, paused for 30 seconds, then averaged the 30 measurements and displayed the average value every minute. Subsequently, the data was smoothed by averaging the data points from 45 minutes prior and 45 minutes ahead for each minute.
The position of the vessel’s GPS antenna at each epoch was established using Real-Time Kinematic (RTK) relative to a nearby base station, which is part of the Continuously Operating Reference Stations (CORS) network in Israel. Using Post-Processing Kinematic (PPK) is also an option for calculating the ship’s position. However, since there is a CORS station close to the work area within a distance not exceeding 10 km, we opted for RTK measurements. This choice offers immediate results, increased efficiency by eliminating the need for post-processing steps, and enhanced accuracy, especially in dynamic environments.
The GPS data-collection rate was 1 Hz and at a speed of 4 knots, translating to a measurement approximately every 2 meters. This configuration ensures a detailed and accurate representation of the surveyed area.
Instantaneous sea level is calculated every second, whereas sea surface topography values derived from the tide gauge are calculated every minute. Due to the discrepancy in measurement intervals, computing the geoid undulation every second is impractical. Therefore, the approach involves calculating the mean instantaneous sea level for each minute and integrating it with the sea surface topography to derive the geoid undulation values.
For data acquisition, the QPS Qinsy software was utilized to record the raw measurements. A designated software program was written to extract relevant parameters such as the position of the MRU in the Israel coordinate network, the ellipsoid height of the GPS antenna, pitch and roll angles, and vertical elevation from the raw data string. This software is employed for real-time hydrographic data acquisition in surveys, supporting a diverse range of industries, from straightforward multi-beam surveys to intricate offshore construction projects.
The fixed distance between a mark on the hull and the reference center of the MRU, along with the location of the GPS antenna phase center in the ship’s reference frame relative to the MRU sensor was determined through total station measurements while the vessel was statically positioned on shore. Two sets of measurements were conducted, and based on the results, the accuracy of the MRU and antenna position in the ship’s frame is within a few millimeters. The distance between the mark and the water surface can also be measured, allowing for the determination of the positions of the MRU and the antenna relative to the water surface.
Fig. 3 illustrates the correction values in the vertical separation between the GPS antenna phase center and the MRU sensor, as obtained for the 2019 survey. The results indicate that the maximum correction for the vertical separation between the phase center of the GPS antenna and the sensor, induced by the pitch and roll angles’ fluctuations throughout all the surveys, does not exceed 4.5 cm.
In comparison to these small values primarily attributed to the GPS antenna’s position relative to the sensor, the Heave values fluctuate between plus to minus half a meter over the three years of measurement. Fig. 4 illustrates the values obtained for the 2021 surveys.
The static draft of the vessel was measured using a tape measure with weights attached to its end. It was measured daily in the port before sailing and at the end of each measurement day. In most voyages, the average static draft value remained constant, indicating no significant changes in the ship’s load over time. The dynamic draft of the ship can vary due to factors such as the squat effect (Härting et al., 2004), fuel consumption, and water density. Given that the survey vessel travels at a slow speed and doesn’t push water forward when underway, the decision was made to neglect the squat effect, which does not induce changes in the ship’s draft during voyages.
Furthermore, considering that the fuel consumption for a single working day may decrease the draft by a maximum of 1 cm, the survey was planned to last only a few hours to minimize the impact of fuel consumption on the dynamic draft. The process of calculating the ship’s draft was conducted in the same area of the bay every survey day, mitigating expectations of changes in water density that could influence variations in the draft.
Atmospheric corrections aim to compensate for height variations caused by changes in atmospheric pressure and wind forces. In this study, the tide gauge and the vessel were affected by the same atmospheric changes due to their proximity to each other, thus canceling out those effects.
The mean dynamic topography (MDT) at the coast can be determined through both ‘geodetic’ and ‘ocean’ approaches (Woodworth et al., 2012; Huang, 2017). The oceanographic approach involves utilizing a hydrodynamic model that characterizes ocean flow, with the dynamic topography (DT) calculated as a temporal average over a specified period using the three-dimensional position of the vessel at the time of measurement. The geodetic approach includes employing ellipsoidal height of mean sea level or utilizing tidal observations from mean sea level (Andersen & Knudsen, 2009).
As there is no hydrodynamic model available in the Bay of Haifa, the decision was made to estimate the sea surface topography at a specific moment based on readings from the tide gauge near the study area. Given that the vessel’s position is within 10 km of the tide gauge, this approach does not significantly affect the accuracy of the results. However, it is essential to note that extrapolating sea surface topography from sea level gauge readings towards the open sea may yield less accurate results at large distances.
To normalize elevations from the instantaneous water surface to the geoid surface, it is necessary to eliminate the influence of tides. This ensures obtaining a sea level height independent of the measurement time, along with the impact of sea surface topography derived from sea level measurements obtained with the tide gauge.
In summary, to determine the calculated geoid undulation (N) at each measurement epoch, we use the following equation:
| N = hantenna – L + dr – T | (1) |
where the ellipsoidal height of the GNSS antenna phase center is hantenna, L is the vertical offset between the GNSS antenna and the MRU, dr is the dynamic draft, the vertical distance between the MRU and the still water level, and T is the combination of tide and sea surface topography, the still water level relative to the reference geoid as measured at the tide gauge.


It should be noted that L is the constant static offset corrected for the effects of Pitch and Roll, both measured by the MRU. In addition, dr, is calculated at each epoch incorporating Heave, Pitch and Roll.
Between 2019 and 2021, three survey campaigns were conducted off the coast of Haifa, spanning almost 10 kilometers from the northernmost to the southernmost measurement points, with the distance from the coast reaching approximately 3 kilometers (Fig. 5).
Each campaign lasted approximately twenty days and involved roughly 60 hours of sailing. The spacing between sailing profiles depends on the depth of the sea: the deeper the sea, the wider the gap between profiles. This is because the sonar’s coverage area is smaller in shallower waters, necessitating closer spacing between profiles. As a result, the distance between sailing profiles ranges from 10 to 80 meters.

4 Adjustment of local linear geoid undulation model
Following the implementation of necessary corrections and the removal of temporal variations from the measurements, it becomes feasible to merge the various sailing profiles acquired over time. This option is grounded in the assumption that the average sea level has not undergone substantial changes during the time frame of this research; however, if any changes occurred, they are duly considered. The process of combining the diverse sailing profiles took place after identifying and rectifying gross errors in the measurements.
Robust methods were employed for the detection of gross errors, setting the a priori standard deviation of a measurement to 5 cm, corresponding to the error estimates of a measured undulation value. The results indicated that both Huber’s method (Huber, 1981) and the Danish method (Krarup et al., 1980) outperformed others in terms of maximum absolute residual, average absolute residual, and the number of detected outliers. The Danish method particularly stood out, requiring the fewest iterations for solution convergence. A total of approximately 11,000 points were measured, with less than 10 % identified as gross errors. An examination of the distribution of these abnormal points revealed their concentration in specific work areas rather than being dispersed throughout the entire work area.
After eliminating all gross errors, we can fit a surface to the undulation values. This fitted surface will facilitate the examination of measurement quality and correction methods, as well as assessing the effectiveness of integrating sailing profiles measured over the years. Given the relatively small area, which can be presumed to lack extreme changes in undulation values, a linear surface of the following form can be fitted:
| N = a · e + b · n + c | (2) |
where e and n are the coordinates of the measuring points in the Israeli coordinate system, N is the approximate geoid undulation, and a, b, and c are the surface parameters.
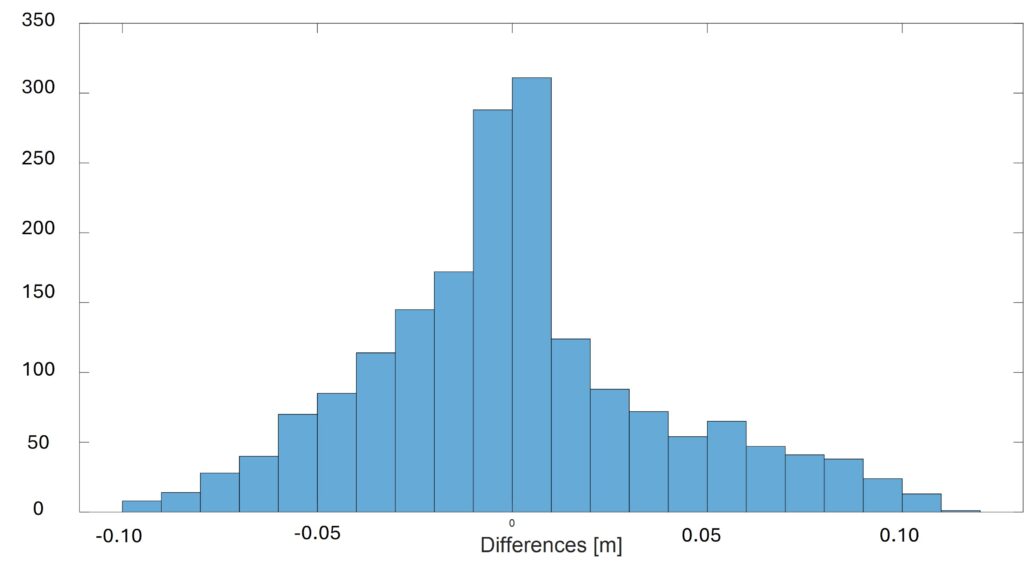
The fitted linear surface for all voyages conducted between 2019 and 2021 using least squares adjustment is illustrated in Fig. 6. The maximum absolute residual is 0.064 m, with an average of 0.014 m. The RMS error is 0.019 m. A histogram of the residuals is presented in Fig. 7.
The appropriateness of a parabolic second-order surface, characterized by six parameters, was also examined. However, it was concluded that the determination of the second-order coefficients does not significantly contribute to the solution. Therefore, it was deemed satisfactory to describe the measurements using a plane, which provides a good fit.


Based on the results, it can be concluded that the accuracy of the adjusted surface, when compared to field measurements, is better than 2 cm. This precision indicates that the various sailing profiles conducted over the three years (2019–2021) were successfully integrated, and the linear surface aligns well with them.
Before proceeding, we would like to assess the quality of the modeling performed, and to achieve this, a cross-validation of the data was conducted. A linear surface was adjusted based on two voyages, and the resulting model was tested against the third voyage. In Fig. 8a, the histogram displays the differences between the geoid undulation surface adjusted using surveys from 2019 and 2020 and the measurements from the voyage conducted in 2021. The maximum difference is 0.090 m, the average absolute difference is 0.027 m, and the RMS is 0.034 m. Fig. 8b displays the histogram of the differences between the geoid undulation surface adjusted using surveys from 2019 and 2021 and the measurements from the voyage conducted in 2020. The maximum difference is 0.111 m, the average absolute difference is 0.029 m, and the RMS is 0.038 m. Fig. 8c displays the histogram of the differences between the geoid undulation surface adjusted using surveys from 2020 and 2021 and the measurements from the voyage conducted in 2019. The maximum difference is 0.088 m, the average absolute difference is 0.032 m, and the RMS is 0.037 m. The results of the cross-validation are summarized in Table 1. This also highlights the fact that the data collected in 2021 was significantly less comprehensive than that collected in 2019 and 2020. A comparative analysis was conducted to align the 2021 dataset with the values from the other two years, revealing that most errors or deviations originated from the 2021 data.
Yet, it is evident that the surface model, derived from only two voyages, aligns well with the results of the third voyage, indicating successful integration of the profiles. The accuracy of the surface is demonstrated to be better than 4.0 cm.



5 Expanding and improving the Israeli geoid undulation model
The estimated geoid undulation surface in the region covered by the experimental voyages can be incorporated with the existing official geoid model in Israel to construct an extended undulation model along the Haifa coast.
The official geoid model in Israel is called ILUM (IsraeL Undulation Model) and the current version is ILUM2.0 which is in use from 2007 (Even-Tzur & Steinberg, 2009). The model utilizes approximately 900 points with known orthometric and ellipsoidal heights, allowing for discrete estimations of the difference between the local Israel vertical datum and the WGS84 ellipsoid. Kriging interpolation is used to compute the local Israeli geoid undulation model (Tuchin, 2006), and the accuracy of the official geoid model is better than 5 cm (Steinberg et al., 2021). The westernmost model points are located along the coastline of the Mediterranean Sea, with distances ranging from 1 to 3 km from the shoreline. As a result, the model does not cover the coastal region of Israel, requiring extrapolation for geoid heights in that area.
After computing a local geoid model derived from three years of surveying in the Haifa Bay, it can be seamlessly integrated into the official Israel model. The local geoid model was integrated with the official undulation model ILUM2.0 to create a new model that extends into Haifa Bay. The geostatistical kriging interpolation method is employed to construct the extended undulation surface, as the official undulation model relies on this interpolation technique. The newly developed model encompasses the southern region of the Bay of Haifa, facilitating the determination of geoid heights in that specific area. Directly comparing the undulation values obtained from the extended model with those from ILUM2.0 is not feasible due to the uncertainty surrounding the error introduced by the model in extrapolated areas. Consequently, to assess the accuracy of the new model, actual values of geoid heights were derived from supplementary measurements.
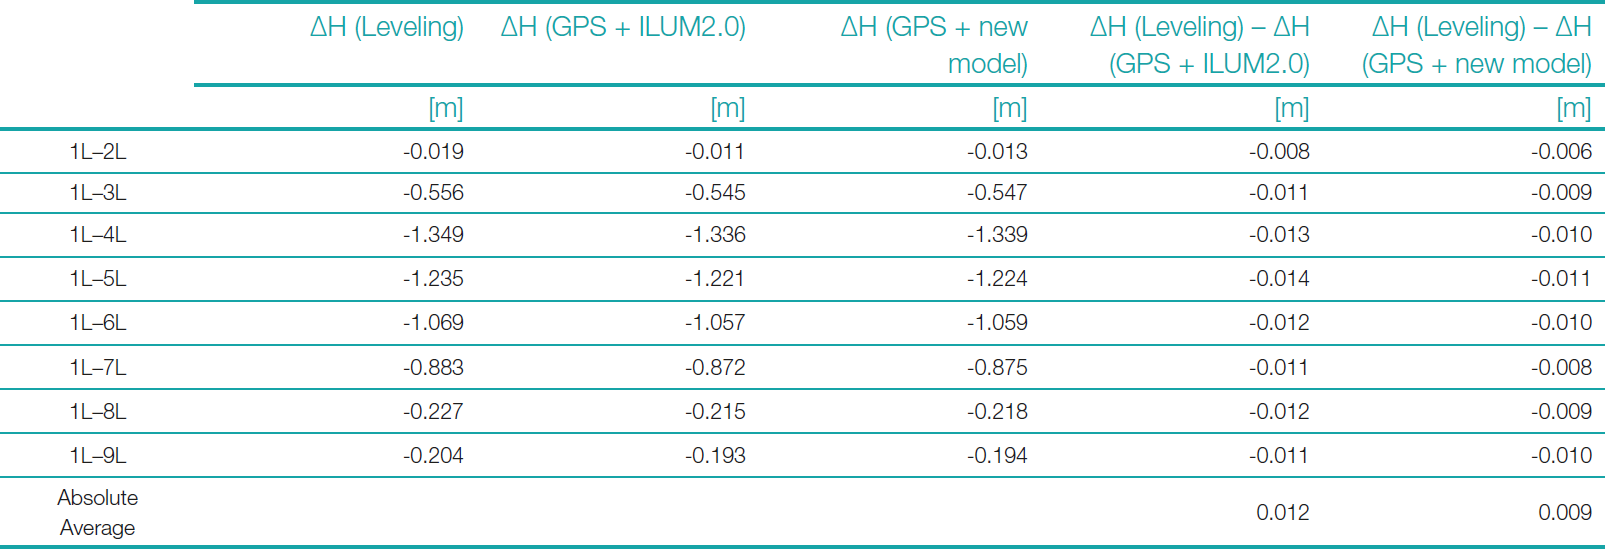
Nine points, numbered from 1L to 9L, were established on the wharves at the new HaMifratz port in collaboration with the Survey of Israel (refer to Fig. 5, dashed red rectangle). These points are situated 3 to 4 km away from the western and southern points utilized by the official geoid undulation model in the area. The points were measured using GNSS RTK in multiple sessions to determine their ellipsoidal heights. Their height accuracy is approximately 1 cm. Additionally, precise leveling was employed to measure the orthometric height differences between these points, achieving an accuracy of 5 mm/km. Since the leveling measurements were conducted within a small area, the measured height difference can be considered the orthometric height difference between the points. These measured height differences served as the ground truth for comparison. Subsequently, based on the ellipsoidal heights and geoid heights derived from each model, the orthometric height differences between the points were calculated and compared to the actual orthometric height differences.
The decision was made not to analyze the height differences between consecutive points; rather, the focus was on examining the height differences between each point and point 1L. The assumption was that if the official model introduces an error into the extrapolated values, it will escalate as we move away from the boundaries of the official model. Examining the height differences in this arrangement facilitates the easier identification of potential errors. Table 2 provides a summary of the comparison results between the actual height differences and those obtained using both models, combined with the ellipsoidal heights.
Based on the results presented in Table 2, it can be reasonably asserted that the expanded geoid model yields slightly superior outcomes compared to those provided by the official model. The improvement observed in the expanded model appears to be marginal. However, it is crucial to note that there are no significant geoid changes in this area. Consequently, it is feasible to obtain reasonably accurate geoid heights from the official model, regardless of the extrapolation. Nevertheless, one might assume that when comparing points situated farther away from the coast, the results from the official model could exhibit notably lower quality compared to those obtained from the expanded model.
6 Summary and conclusions
It has been demonstrated that a single shipborne GNSS receiver and nautical measurements enable the acquisition of high-quality geoid heights. The method presented facilitates obtaining local coastal geoid heights with good accuracy at a lower cost compared to airborne or shipborne gravity measurements. Data is readily available from any controlled hydrographic survey using state of the art calibrated equipment. The essential factor for obtaining valuable geoid heights lies in the rigorous processing of raw GNSS data, incorporating corrections for the vessel’s dynamic movement, tidal influence, atmospheric changes, and sea surface topography.
Between 2019 and 2021, multiple cruises were conducted along Haifa’s coast in Israel as part of an experimental study aimed at expanding the official Israeli geoid undulation model to its coastal region. The study delineates the essential steps for creating a comprehensive spatial representation of the geoid undulation model and compares the outcomes of the official Israeli geoid undulation model with the extended model, including an assessment of their respective accuracies.
Throughout the process of integrating profiles and generating a spatial image of the geoid undulation, the accuracy of the integration between different cruises was assessed, revealing an accuracy of better than 3.0 cm.
The approach of approximating the geoid with a linear surface is locally justified but may not scale to larger regions with significant MDT variations. Investigating MDT variations along the Israeli coast is necessary to determine the applicability and limitations of this method in larger areas.
As the official geoid model of Israel does not extend to its coastal area, the main goal of implementing this approach in our region was to improve the official geoid undulation model by integrating the measured marine geoid undulations and extending it to the maritime environment. After incorporating the measured values into the official model, its ability to provide accurate geoid undulation values in the new HaMifratz port was evaluated. The study results reveal a noteworthy enhancement in the performance of the new expanded model compared to the official model. The improvement was achieved despite the generally mild geoid slope in the shallow Haifa Bay area, supporting the use of a linear geoid undulation surface model for accurate representation. This emphasizes the importance and necessity of integrating the new approach with conventional measurements.
Geoid models in coastal areas still exhibit lower quality compared to terrestrial and open sea areas. In some cases, no model exists for coastal regions, as existing models only cover the country’s land area. Therefore, enhancing geoid model capabilities by utilizing shipborne GNSS measurements can contribute to expanding the terrestrial geoid undulation model. Extracting the geoid in a coastal marine environment enables the extension of the national geoid undulation model into the maritime area of the State of Israel. Subsequently, this facilitates obtaining geoid undulation values up to the coastline and extending the geoid undulation model derived from altimetry satellites to the actual coastline.
The demonstrated method can be employed not only to generate a spatial representation of geoid undulations in coastal areas but also to accurately measure sea surface height in those regions. Continuous monitoring of coastal sea levels is essential due to fluctuations and the high concentration of the global population residing in such areas. However, conventional measurement methods, like tide gauges and satellite altimetry, have limitations, each with significant drawbacks. While tide gauges can precisely track sea level changes, they lack the capability to provide spatial information. Satellite altimetry, on the other hand, can offer spatial information, but its time and space resolution are limited, and its accuracy in coastal areas is subpar. The method presented in this research combines the benefits and strengths of existing measurement techniques. The measurements are spatially comprehensive, possess high resolution and accuracy. They maintain quality when applied in coastal areas, all while avoiding exorbitant costs especially when utilizing readily available data collected in hydrological surveys.
In essence, a geoid undulation model provides valuable information for comprehending and addressing the intricacies of coastal areas, playing a pivotal role in various applications such as coastal engineering, geospatial analysis, and environmental monitoring. Shipborne GNSS and nautical measurements stand as a valuable addition to geoid undulation modeling in coastal regions. When seamlessly integrated with other geodetic and gravimetric data sources, these measurements contribute significantly to enhancing the overall accuracy of the resultant model.
References
Andersen, O. B. and Knudsen, P. (2009). DNSC08 mean sea surface and mean dynamic topography models. Journal of Geophysical Research: Oceans, 114(C11).
Duquenne, H., Olesen, A.V., Forsberg, R. and Gidskehaug, A. (2002). Improvement of the gravity field and geoid around Corsica by aerial gravimetry. Gravity and Geoid, pp. 167–172.
Even-Tzur, G. and Steinberg, G. (2009). Using an official undulation model for orthometric height acquisition by GNSS. Survey Review, 41(313), pp. 292–300.
Forsberg, R., Olesen, A.V., Keller, K., Møller, M., Gidskehaug, A. and Solheim, D. (2001). Airborne gravity and geoid surveys in the Arctic and Baltic seas. Proceedings of international symposium on kinematic systems in geodesy, geomatics and navigation (KIS-2001), Banff, pp. 586–593.
Härting, A., Reinking, J. and Ellmer, W. (2004). Ship Squat in Hydrography – A study of the surveying vessel Deneb. The International Hydrographic Review, 5(3), pp. 41–47.
Huang, J. (2017). Determining coastal mean dynamic topography by geodetic methods. Geophysical Research Letters, 44(21), pp. 11–125.
Huber, P. J. (1981). Robust Statistics. Wiler. New York.
Krarup, T., Juhl, J. and Kubik, K. (1980). Götterdämmerung over least squares adjustment. Proceedings of the 14th Congress of the International Society for Photogrammetry, pp. 369–378, Hamburg, Germany.
Kuroishi, Y. (2009). Improved geoid model determination for Japan from GRACE and a regional gravity field model. Earth, planets and space, 61(7), pp. 807–813.
Lavrov, D., Even-Tzur, G. and Reinking, J. (2015). Extraction of geoid heights from shipborne GNSS measurements along the Weser River in northern Germany. Journal of Geodetic Science, 5(1).
Lavrov, D., Even-Tzur, G. and Reinking, J. (2017). Expansion and improvement of the Israeli geoid model by shipborne GNSS measurements. Journal of Surveying Engineering, 143(2), p. 04016022.
Lu, B., Barthelmes, F., Li, M., Förste, C., Ince, E.S., Petrovic, S., Flechtner, F., Schwabe, J., Luo, Z., Zhong, B. and He, K. (2019). Shipborne gravimetry in the Baltic Sea: Data processing strategies, crucial findings and preliminary geoid determination tests. Journal of Geodesy, 93, pp. 1059–1071.
Saari, T., Bilker-Koivula, M., Koivula, H., Nordman, M., Häkli, P. and Lahtinen, S. (2021). Validating geoid models with marine GNSS measurements, sea surface models, and additional gravity observations in the Gulf of Finland. Marine Geodesy, 44(3), pp. 196–214.
Steinberg, G., Even-Tzur, G., Ronen, H., Sarid, H. and Dalyot S. (2021). The Development of the Israeli Official Geoid Model. FIG e-Working Week, virtually in the Nederland, 21-25 June 2021.
Tuchin, Y. (2006). Development of a Geoid-Ellipsoid Separation Model in Israel. Shaping the Change, XXIII FIG Congress, Munich, Germany.
Varbla, S., Ellmann, A. and Delpeche-Ellmann, N. (2020). Validation of marine geoid models by utilizing hydrodynamic model and shipborne GNSS profiles. Marine Geodesy, 43(2), pp. 134–162.
Wang, Y. M., Sánchez, L., Ågren, J., Huang, J., Forsberg, R., Abd-Elmotaal, H.A., Ahlgren, K., Barzaghi, R., Bašic, T., Carrion, D. and Claessens, S. (2021). Colorado geoid computation experiment: overview and summary. Journal of Geodesy, 95, pp.1–21.
Woodworth, P.L., Hughes, C.W., Bingham, R.J. and Gruber, T. (2012). Towards worldwide height system unification using ocean information. Journal of Geodetic Science, 2(4), pp. 302–318.
Xu, X. Y., Xu, K., Xu, Y. and Shi, L.W. (2019). Coastal altimetry: a promising technology for the coastal oceanography community. Estuaries and Coastal Zones-Dynamics and Response to Environmental Changes, pp. 1– 9. IntechOpen.
Authors’ biographies

Gilad Even-Tzur is an Associate Professor with the Technion – Israel Institute of Technology, Faculty of Civil and Environmental Engineering. He serves as the head of the Division of Mapping and Geo-Information Engineering.

Jareer Khalilieh earned his Master’s degree with honors from the prestigious Technion Institute of Technology. Throughout his career as a mapping and geo-information engineer, he contributed to cutting-edge surveying projects, with a research focus on GNSS technology, geodetic network optimization, and high-precision measurement techniques. His expertise in hydrographic and cadastral surveying allowed him to tackle complex geospatial challenges with innovative solutions. In addition, Jareer embarked on developing a start-up, striving to revolutionize the field of geospatial technologies and push the boundaries of modern surveying.

Barry Grinker graduated from the US Naval Postgraduate School earning a MSc degree in Hydrographic Sciences in 1991. He served as Head of the Israel Navy Hydrographic Branch until retiring in 2005. Since 2001 Barry has been lecturing Marine Surveying at the Haifa Technion in the Mapping and Geo-information department in the Civil and Environmental Engineering faculty.