


Abstract
1 Introduction
Ocean bathymetry, the study and mapping of the seafloor topography, is a fundamental aspect of marine science, underpinning a wide range of scientific, environmental, and navigational applications (Brown et al., 2012; Jakobsson & Mayer, 2022; Lecours et al., 2016). Ocean bathymetry is typically represented using a specialized form of a Digital Terrain Model (DTM), known as a Digital Bathymetric Model (DBM). The DBM is commonly structured as a regular grid, where each grid cell is assigned a specific depth value corresponding to the seafloor elevation or depth below sea level (Jakobsson et al., 2019). This grid-based representation allows for the systematic analysis and visualization of underwater features, facilitating accurate mapping and modeling of marine environments (Erikstad et al., 2013; Lubczonek & Zaniewicz, 2023; Sowers et al., 2024).
The analysis of the available global and regional DBMs reveals significant gaps and uncertainties, challenging the notion that the ocean floor is fully understood (Mayer et al., 2018; Ware et al., 2023). The General Bathymetric Chart of the Oceans (GEBCO) is a widely recognized global DBM with a nominal resolution of 15 arc seconds, which translates to approximately 500 meters at the equator (GEBCO Bathymetric Compilation Group, 2024). However, it is important to note that GEBCO lacks direct depth measurements for approximately 75 % of its global coverage (McMichael-Phillips et al., 2024). This issue of incomplete data is not unique to GEBCO; similar challenges are observed in other global bathymetric compilations such as the Global Multi-Resolution Topography (GMRT; Drennon et al., 2023). Additionally, regional DBMs, including the International Bathymetric Chart of the Arctic Ocean (IBCAO; Jakobsson et al., 2020) and the European Marine Observation and Data Network (EMODnet) Bathymetry, which covers all European sea regions (Schaap & Schmitt, 2020), also face analogous limitations regarding data coverage and resolution. Regional and global DBMs predominantly depend on interpolation techniques and altimetry-derived datasets (Weatherall et al., 2015). Although altimetry-derived bathymetry is widely employed in global and regional bathymetric compilations, its utility is limited to providing only approximate representations of the seafloor. This limitation is primarily due to the challenges associated with upward continuation in deep-water regions and the inherent variability in sediment thickness and crustal structures along shallow continental margins (Andersen et al., 2010; Legeais et al., 2018; Sandwell et al., 2003). Consequently, the depth estimates derived from altimetry suffer from significant inaccuracies, often on the order of several hundred meters or more, and the spatial resolution is insufficient for resolving seafloor features smaller than a few kilometers in scale (Mayer et al., 2021).
Ocean mapping is inherently challenging due to the high attenuation of electromagnetic waves in water, limiting the effectiveness of sensors commonly used for land topography, such as those using multispectral images, lidar, and radar (De Giosa et al., 2019; Dierssen & Theberge, 2020; Parrish et al., 2019; Westfeld et al., 2017). Instead, ocean mapping relies heavily on acoustical remote sensing methods like Single-Beam Echo Sounders (SBES) and Multi-Beam Echo Sounders (MBES) (Mayer et al., 2018). Historical depth measurements, often derived from lead-lines, are sparse and cover minimal seafloor areas, while SBES provides denser measurements over larger area. MBES offers the highest density and resolution, providing a more accurate seafloor representation (Lebrec et al., 2021; Lurton, 2010). However, MBES is expensive and cumbersome, especially in deep waters, and is therefore less commonly used (Hughes Clarke, 2018a, 2018b). Mapping shallow waters also presents difficulties due to the coastal environment’s complexity (Kjeldsen et al., 2017; Lucieer et al., 2018; Masetti et al., 2018a). Recent technological advancements, particularly in the development of uncrewed surface vessels (USVs), present a promising avenue to mitigate these limitations by potentially reducing operational costs and enhancing the efficiency of ocean mapping and exploration (Mayer, 2023). However, the significant costs, extensive time requirements, and inherent challenges in acquiring high-resolution bathymetric data have led to much of the ocean remaining inadequately mapped or even unexplored, despite extensive efforts over the years.
Bathymetric data provides critical insights into the structure and dynamics of ocean basins, continental margins, and the broader underwater landscape, playing a pivotal role in understanding geological processes, ocean circulation, and marine ecosystems (Mayer, 2022; Morrow et al., 2023; O’Toole et al., 2022; Sowers et al., 2020). DBMs are extensively utilized to precisely delineate critical boundary conditions essential for geophysical, biological, and oceanographic systems (Bogumil et al., 2024; Haigh et al., 2023; Weatherall et al., 2015). Moreover, DBM-based analyses are integral to a variety of environmental and geological studies, including geohazard assessments and the geological characterization of seafloor morphologies (Koop et al., 2021; Masetti et al., 2018b; Palmiotto & Loreto, 2019; Sowers et al., 2020). Detailed DBMs are crucial for delineating coastlines, which are vital for understanding storm surges and sea level changes (Dierssen & Theberge, 2020), as well as for mapping the seafloor’s morphology, which plays a key role in controlling and constraining bottom currents and, consequently, global and regional heat transport (Ribergaard et al., 2004; Jakobsson & Mayer, 2022). Similarly, various aspects of marine geosciences, including seafloor characterization, sedimentary studies, and offshore engineering, rely on high-quality DBMs with comprehensive and meaningful associated metadata (Fonseca et al., 2021; Lebrec et al., 2022; Moses & Vallius, 2021). These applications increasingly demand higher resolution data to improve the accuracy and reliability of the models, as well as metadata and documentation – describing the main characteristics and limitations associated with a released DBM – that facilitate researchers in discovering the bathymetry best fitting their specific purposes (Jakobsson & Mayer, 2022; Vrdoljak, 2021).
Since early 2020, the Danish Geodata Agency has made significant efforts to organize available bathymetric datasets from Danish and Greenlandic waters into a modern geospatial data management system known as DYBDB (The term DYBDB comes from combining “dybde” – Danish for “depth” – and “DB” (short for “database”), meaning a “depth database”). This initiative includes the development of methodologies for compiling these diverse data sources into DBMs and other valuable products, such as hydrographic survey overviews (Danish Geodata Agency, 2021). This paper focuses specifically on Denmark’s Depth Model version 2.0 (DDM v2.0) which represents the most recent advancement in Digital Bathymetric Modeling (DBM) for Danish territorial waters, providing a high-resolution grid with a spatial resolution of 50 meters (Masetti et al., 2022a).
One of the primary motivations for the creation of the Denmark’s Depth Model (DDM) has been to enhance the bathymetric coverage within the Danish Exclusive Economic Zone (EEZ) as currently provided by the EMODnet Bathymetry (Masetti et al., 2022a). By improving the accuracy and resolution of bathymetric data in this region, the DDM aims to significantly support a wide range of environmental studies and research efforts in the North Sea and the Baltic Sea. These improvements are expected to facilitate more precise environmental monitoring, better understanding of marine ecosystems, and more effective management of marine resources. Additionally, enhanced bathymetric data will contribute to studies on coastal erosion, sediment transport, and sea level rise, providing critical insights for both scientific research and policy-making. The DDM is also poised to aid in the planning and execution of offshore engineering projects, such as wind farms and underwater pipelines, by offering more reliable seafloor characterizations, which are essential for ensuring the safety and sustainability of such developments.
This paper begins by detailing the management of the data sources, including the key components of DYBDB, before outlining the methodological and technical steps involved in the creation of DDM v2.0. A specific focus is reserved to Satellite-Derived Bathymetry (SDB) harmonization. Finally, the paper presents the content of the publicly available DBM layers and services, with the overarching goal of encouraging adoption of DDM v2.0 by researchers and other practitioners.
2 Materials and methods
2.1 Management of data sources
DYBDB is a modern hydrographic data management system developed and implemented by the Danish Hydrographic Office, part of the Danish Geodata Agency (Danish Geodata Agency, 2021). The DYBDB system integrates several automated procedures, predominantly scripted in Python, alongside task management mechanisms powered by Atlassian’s Jira™ issue tracking product 1.
DYBDB incorporates three distinct types of geospatial databases, each serving a specific purpose (Fig. 1):
Smart DB: The Survey Metadata And Raw data Tracker (Smart) geospatial database manages an extensive collection of survey metadata (e.g., collection time, used sensors and platforms, quality assessment) and tracks the integrity of the original submission, with a focus on the acquired raw data. Upon loading a dataset, the database links to the point cloud of cleaned soundings gathered during the survey.
Grid DB: Tailored for handling dense datasets, such as those obtained from modern MBES, the Grid database contains a subset of the cleaned soundings. These soundings are organized at a spatial resolution (5 meters as default resolution) specifically designed for nautical chart production.
Model DB: This database stores intermediate products and final DBMs, serving as the repository for completed models ready for use in various applications.
The databases within DYBDB utilize the free and open-source PostgreSQL relational database management system (RDBMS) 2 as their backend infrastructure. PostgreSQL was chosen for its robustness, scalability, and support for complex queries, making it well-suited to handle the extensive and intricate datasets involved in hydrographic data management. To ensure the security and preservation of critical data, snapshots of the essential content within DYBDB are regularly generated using the GeoPackage format 3. The management of all databases within DYBDB is facilitated by Teledyne CARIS’ Bathy DataBASE Server™ software, a specialized tool designed to handle the storage, processing, and management of bathymetric data4. The Teledyne CARIS’ BASE Editor™ serves as the primary Geographic Information System (GIS) client for accessing and interacting with the content stored in DYBDB. The use of these industry-standard tools aligns DYBDB with best practices in hydrographic data management, ensuring compatibility and integration with other hydrographic systems.
Since DYBDB became operational in early 2020, the Smart DB and the Grid DB have been populated with approximately 1,900 bathymetric datasets. These datasets were primarily sourced from hydrographic surveys conducted by the Danish Navy, public agencies, industry stakeholders, and academic institutions. The majority of these datasets were acquired using SBES and MBES, with the sounders typically mounted on the hull of the survey vessel or installed on a removable pole. The horizontal positioning of the soundings was predominantly achieved using Global Navigation Satellite Systems (GNSS), often enhanced with differential corrections or Real-Time Kinematic (RTK) positioning to improve accuracy. For MBES surveys, an attitude sensor was also employed to capture the dynamic movements of the survey platform, including roll, pitch, heave, and yaw. This information is crucial for accurately spatially orienting the acoustic swaths produced by the MBES, ensuring that the bathymetric data accurately represents the seafloor topography (Hughes Clarke, 2018b; Lurton, 2010). The integration of these technologies and methodologies reflects the high standards of data quality and precision required for modern hydrographic surveys, facilitating the production of reliable and detailed DBMs.

2.2 Compilation Approach
The latest EMODnet Bathymetry, released in November 2022, features a grid resolution of 1/16 arc minute, equivalent to approximately 115 meters (EMODnet Bathymetry Consortium, 2020). To enhance the resolution of publicly available bathymetric data within Danish waters, the Denmark’s Depth Model (DDM) was designed with a target grid resolution of 50 meters. This 50-meter resolution was determined to be an optimal balance, offering a reasonable tradeoff between areas with extensive high-resolution surveys, such as those in the Kattegat region, and regions where only sparse historical soundings are available, such as large portions of the North Sea (Masetti et al., 2022a). The selected resolution ensures that the DDM can provide more detailed and accurate representations of the seafloor while still accommodating the variability in data density across different regions. This approach enhances the utility of the DDM for a range of applications, from detailed coastal studies to broader regional analyses.
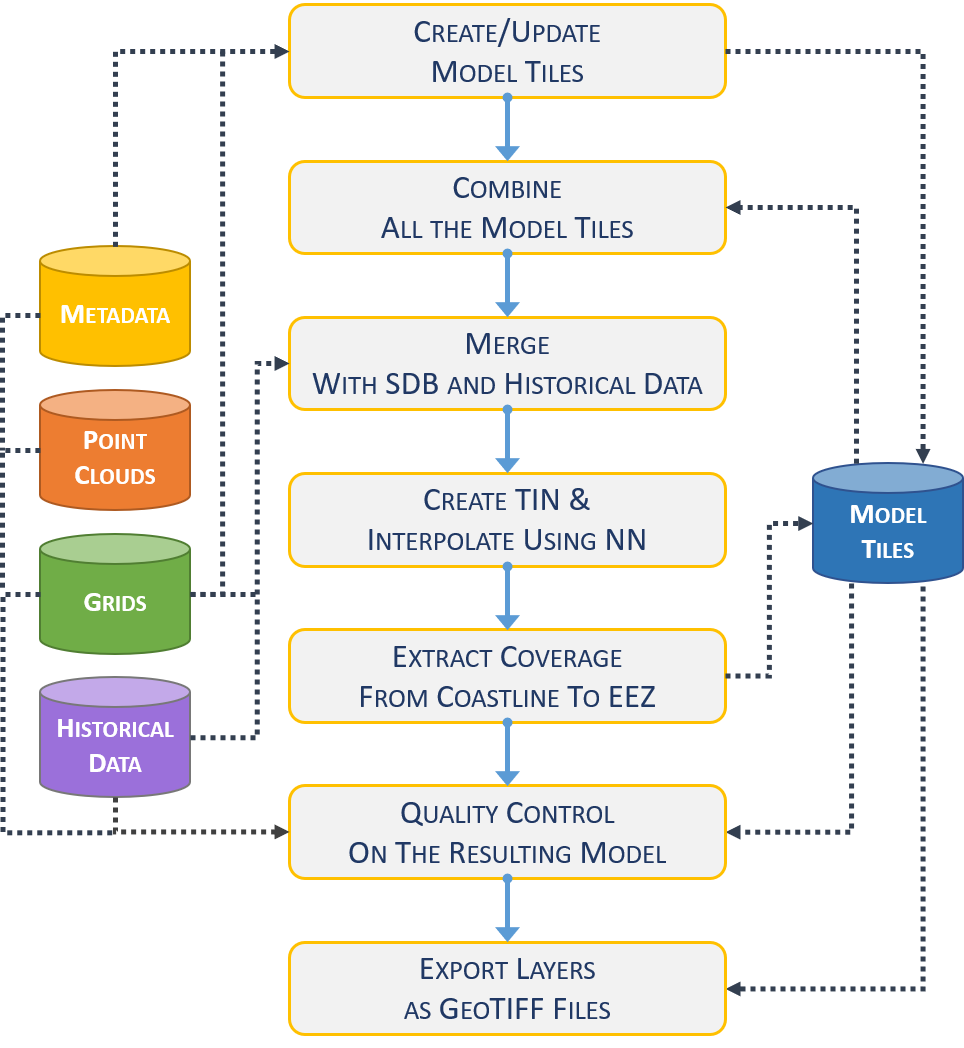
During the model creation and validation processes, DYBDB facilitates access to relevant datasets and associated metadata, particularly from the Smart DB and Grid DB. Additionally, the Model database provides storage for intermediate products and the finalized Digital Bathymetric Models (DBMs). This system ensures a seamless workflow from data access to the final model output (Fig. 1).
The overall compilation process consists of the following key steps (Fig. 2):
- Creation/update of the model tiles. The source datasets are retrieved from the Grid DB and related metadata from the Smart DB. The sources are gridded adopting a grid resolution of 50 meters and a tiling scheme with tile area of 1° of latitude by 1° of longitude (Masetti et al., 2022a). The tiles covered by at least one dataset are generated and stored in the Model DB. The bathymetric values are calculated as representative average depth, that is an average of all water depths allocated from the relevant input source to a given grid cell. When multiple datasets overlap, the relevant input source is selected based on the dataset coverage polygon and using a priority index based on time of data collection, assessed data quality and dataset type. Specifically, MBES and ALB gets higher priority than DIGI, SBES, CSB and Historical. This step is periodically executed to update the tiles in case of new datasets.
- Combine all the model tiles. All the populated DDM tiles stored in Model DB are combined into a continuous preliminary DBM.
- Merge with SDB and historical data. The DBM calculated in the previous step is extended by combining it with SDB – stored as grids – as well as historical soundings available on published nautical products.
- Create TIN and interpolate using the ‘Natural Neighbors’ algorithm. To fill areas with sparse soundings, an interpolated DBM is generated by first creating a Triangulated Irregular Network (TIN) from the extended DBM generated in the previous step, then using the TIN to interpolate based on the ‘Natural Neighbors’ (NN) algorithm (Lee, 1991; Watson, 1999).
- Extract coverage from coastline to EEZ. The interpolated DBM is updated to limit its coverage from the coastline (generalized at 1:100,000 scale) to EEZ. The resulting DBM is uploaded to the Model DB.
- Quality control on the resulting model. The quality of the DBM resulting from the previous steps is extensively assessed by a team of reviewers. During this iterative process, the reviewers have access to all the direct and indirect DBM sources through Smart DB, Grid DB, and historical data. In case of issues, adjustments to the model may require the (partial or total) re-execution of the previous steps. Only when the outcomes of the quality control are satisfactory, the DBM is finalized.
2.3 SDB harmonization
The incorporation of Satellite-Derived Bathymetry (SDB) represents a significant enhancement in the development of DDM v2.0. The SDB dataset was generated by EOMAP GmbH & Co. KG (hereon referred to as EOMAP), a specialized remote sensing company5, utilizing multispectral imagery acquired from the ESA Sentinel-2 A & B satellites. The entire dataset comprises 226 Sentinel-2 images, meticulously covering the coastal and shallow waters surrounding Denmark. For efficient processing, the dataset was divided into 17 tiles, each corresponding to the Sentinel-2 grid that spans Denmark (ESA, 2015). EOMAP employed the Radiative Transfer Equation (RTE) inversion method, also referred to as the physics-based method (Hartmann et al., 2022), to derive bathymetric data from the multispectral imagery.
Integrating SDB into DDM v2.0 necessitated the development of a harmonization algorithm designed to minimize the introduction of depth artifacts, which could arise from inconsistencies between SDB and other established bathymetric data sources. As an initial step in this integration process, the SDB data was gridded into an SDB Digital Bathymetric Model (SDB DBM) with a spatial resolution of 50 meters, matching the resolution and extent of the final harmonized DBM. Depth values exceeding 6 meters were excluded from this dataset, a threshold empirically determined based on expert analysis. For each populated cell within the SDB DBM, the corresponding SDB depth value (dSDB ) was subjected to a rigorous evaluation process to determine its inclusion in the harmonized DBM. This evaluation was specifically applied in cases where no co-located “primary” depth data (dPRI) – obtained from sources such as MBES, SBES, and Airborne Lidar Bathymetry (ALB) – was available. By selectively incorporating SDB data in the absence of higher-priority depth sources, the harmonization algorithm ensured the integrity and accuracy of the final depth model.
The inclusion of the dSDB into the harmonized DBM is contingent upon passing two rigorous validation checks:
- Area Kernel Check: This check assesses the consistency of dSDB with dPRI within a larger spatial context. Specifically, it evaluates dPRI cells within an 8-node radius surrounding the dSDB under consideration. The minimum
 and maximum
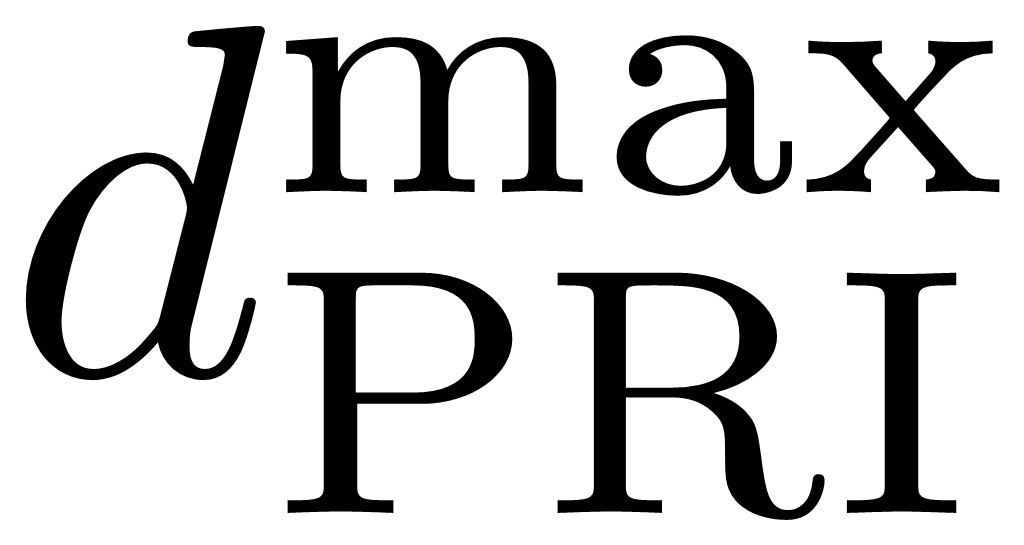 depths within this area are identified. For the dSDB to pass the Area Kernel Check, it must satisfy the following condition:
 |
(1) |
This criterion ensures that the dSDB value is within an acceptable range of variation relative to the primary depth data, thereby minimizing the risk of introducing significant depth discrepancies.
Neighbor Kernel Check: This check evaluates the immediate surroundings of dSDB, specifically within a 2-node radius, to determine whether neighboring dPRI cells are populated with primary depth data. The dSDB passes the Neighbor Kernel Check only if all the evaluated dPRI cells within this radius are unpopulated. This ensures that the dSDB is utilized exclusively in areas where primary depth data is unavailable.
These two checks together provide a robust framework for integrating SDB data into the harmonized DBM, ensuring that SDB is incorporated only when it is consistent with or supplements existing primary depth data, thus maintaining the accuracy and reliability of the final model.
2.4 Reduction to a common vertical reference
One of the significant advancements in DDM v2.0 is the reduction of all depth values to a common vertical reference, specifically Mean Sea Level (MSL). This transformation process involved converting datasets originally referenced to various vertical datums, including the Dansk Normal Nul (DNN), Dansk Vertikal Reference 1990 (DVR90), Lowest Astronomical Tide (LAT), and Mean Low Water Springs (MLWS). The Danish Agency for Climate Data (KDS) has published models for DVR90, LAT and MSL, which were utilized as accurate realizations of these respective datums. For the DNN and MLWS datums, which lacked direct transformation models, ad-hoc methodologies were developed.
The DNN is a discontinued vertical datum that was originally established on land using specific reference points. To approximate the transformation of DNN to MSL, an assumption was made that the original surveys were conducted relative to the nearest available reference points. This approximation was informed by the Vejledning om højdesystemet, an official publication that provides average differences between DNN and DVR90 across various municipalities in Denmark (Jarmbæk, 2005). This information, combined with the existing transformation model from DVR90 to MSL, enabled the creation of a Voronoi-based approximation model for the DNN to MSL transformation. A similar methodological approach was employed to derive a transformation from MLWS to MSL. This involved utilizing tide gauge data provided by the Danish Meteorological Institute (DMI) to create a model that accurately reflects the relationship between MLWS and MSL.
These transformation processes ensured that all depth data within DDM v2.0 are consistently referenced to MSL, thereby improving the interoperability and accuracy of the depth model across different datasets and geographical regions.
2.5 Model products
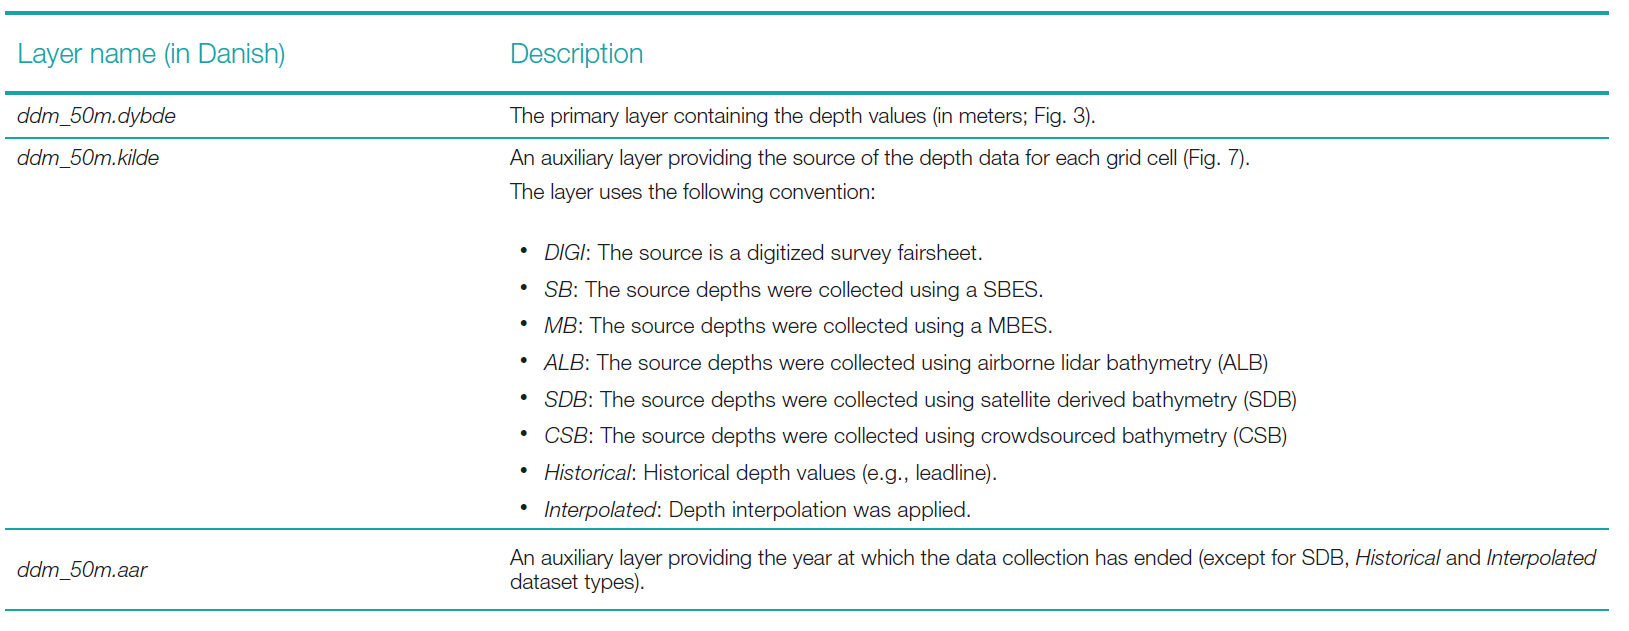
Once the creation and validation processes are completed (following the steps described in the Compilation Approach section and summarized in Fig. 2), the layers listed in Table 1 are exported from the finalized DBM for public release.
The two auxiliary layers, ddm_50m.kilde and ddm_50m.aar, are utilized to detail the type and collection date of the source datasets used in estimating the DDM depths. DDM v2.0 layers listed in Table 1 are also made available as Open Geospatial Consortium (OGC) services (i.e., Web Map Service; Web Coverage Service). The original source datasets themselves are not distributed with the DDM. This approach aligns with the methodology adopted by EMODnet Bathymetry, which also does not distribute the original source data but instead provides metadata services when available (Thierry et al., 2019).
The horizontal datum of the model is a Lambert Conformal Conic (LCC) projection on the ETRS89 ellipsoid (EPSG:3034). The vertical datum is Mean Sea Level (MSL) as defined by KDS’ DKMSL(2022) (EPSG:10547). The output format for the exported layers is GeoTIFF (Ritter & Ruth, 1997). A readme document (in PDF format) with a succinct description on DDM v2.0 (i.e., how the model was generated and how to interpret the provided layers) is part of the compressed archive containing the DDM release. A contributors document (also in PDF format) listing data contributors is also made available.
3 Results
The official release of DDM v2.0 occurred on 28th of August, 2024. The compressed archive, which contains all materials detailed in the Model Products section, along with information for accessing the OGC (Open Geospatial Consortium) services, is available through the Danish Geodata Agency’s website6. This release marks a significant update, providing enhanced resources for geospatial analysis and ensuring broader accessibility to the DDM’s data and services.
The bathymetric layer (depicted in Fig. 3) encompasses a surveyed area of 98,045 square kilometers. The largest majority (~97.2 %) of the depth values are under 100 meters; they present a skewed bimodal distribution (peaks at 15–20 meters and 40–45 meters) with a median value of ~32.4 meter (Fig. 4).
DDM v2.0 comprises a DBM in which over 29 % of the depth cells are derived directly from measured depth values, with the remaining cells interpolated from these measurements to estimate depth values in areas lacking direct data (Fig. 5, pane b). The interpolated regions of DDM v2.0 can be derived by selecting the cells marked with the “Interpolated” value in the ddm_50m.kilde layer (Table 1). The primary source of these measured depth values is multibeam echosounder (MBES) surveys, as indicated by the ddm_50m.kilde auxiliary layer (Fig. 6, pane b). The panes a in Fig. 5 and Fig. 6 are shown for comparison with the data content of the first version of DDM.
Based on the ddm_50m.aar auxiliary layers, the first MBES-type contribution to the DDM occurred in 1993, with subsequent years showing a marked increase in the spatial coverage of MBES-derived bathymetry (Fig. 8). This temporal and spatial variability in data density, influenced by the varying types and years of data sources, has led to regions within the DDM where bathymetric detail is high due to dense MBES survey data (e.g., the Great Belt area). In contrast, other regions (e.g., the upmost western part of the North Sea) exhibit smoothed bathymetry as a result of interpolation processes applied to estimate depths in areas with sparse soundings.


and interpolated (in orange) for Denmark’s Depth Model versions 1.0 (pane a) and 2.0 (pane b).

and 2.0 (pane b).


4 Discussion
DDM v2.0 represents the second publicly released Digital Bathymetric Model (DBM) covering Danish waters, characterized by a grid resolution of 50 meters. This paper details the compilation process employed in the creation of the DDM v2.0 (Fig. 2), as well as the methods of its distribution through publicly accessible products. These aspects are particularly relevant for hydrographic offices and other national agencies that are committed to advancing research and modeling initiatives, considering the diverse range of applications for which DBMs are utilized. It is important to note that DDM v2.0 is generated using an averaging methodology, making it unsuitable for safety of navigation purposes. Nevertheless, several key steps within the described compilation workflow have been adapted for use in forthcoming projects aimed at developing high-resolution navigation surface and related S-100 products. The adoption of the navigation surface concept will facilitate the efficient production of nautical charts, as outlined by Smith (2003).
DDM v2.0 is constructed from hundreds of bathymetric survey datasets and historical sources within Denmark’s Exclusive Economic Zone (EEZ). However, less than 23 % of the DDM’s coverage is derived from surveys conducted using modern SBES and MBES (Fig. 8). Increasing this percentage significantly in the coming years presents substantial resource challenges, partly due to the limitations imposed by the relatively shallow depths surrounding Denmark (Fig. 3), which constrain the acoustic swath coverage of MBES. This constraint has prompted the exploration of alternative data sources, such as Airborne Lidar Bathymetry (ALB), Satellite-Derived Bathymetry (SDB), and Crowdsourced Bathymetry (CSB). While ALB and SDB are restricted to shallow coastal waters, CSB presents a significant potential to augment data coverage also in deeper waters. However, the effective adoption of CSB requires the development of practical solutions to address challenges such as data validation, quality assessment, and the variable reliability of data collectors (Masetti et al., 2020).
During the development of DDM v2.0, it became apparent that treating SDB datasets in the same manner as other data sources would introduce significant artifacts in regions where these datasets overlap. To address this issue, simply filling gaps in the existing data coverage with SDB data was deemed inappropriate. Therefore, a decision was made to prioritize the other data sources (listed in Table 1) over the SDB as well as implement a harmonization algorithm. The input SDB datasets originally covered approximately 5,000 km² within a depth range of 0 to 6 meters. However, due to the presence of bathymetric artifacts in early realizations of the model, a harmonization process was applied, resulting in about 1,274 km² – roughly one-quarter of the initial SDB coverage – being retained. The exclusion of the remaining SDB data was due to either redundancy, where it overlapped with higher-priority depth data, or filtering during the harmonization procedure. Future advancements, such as more precise differentiation between primary data sources, could enable a more sophisticated harmonization process. This improved process would potentially preserve a greater proportion of SDB data, thereby minimizing the need for interpolation and enhancing the overall accuracy and reliability of the final DBM.
DDM v2.0 substantially increases (more than 5 %) the percentages of model cells derived from measured depth values when compared with the first release of the DDM (Fig. 5). The major source of this increase is represented by the addition of more MBES datasets as well as the introduction of 3 new source types: ALB, SDB, and CSB (Fig. 6). In cases where modern datasets are unavailable for specific areas within DDM v2.0 coverage, historical data sources are utilized. When neither modern nor historical data are available, interpolation serves as a last resort to estimate depth values. The interpolation method employed in these instances is the Natural Neighbor algorithm (Watson, 1999), which has demonstrated efficacy in preserving the fine details of regions with high-density MBES data. Additionally, this algorithm is effective in facilitating smooth transitions between areas of varying data density, thereby minimizing artifacts and maintaining the overall integrity of the bathymetric model.
The compilation mechanism employed for integrating the hundreds of sources from the Grid DB – specifically, the “Create/Update Model Tiles” process illustrated in Fig. 2 – optimizes computational efficiency by limiting updates to only those model tiles impacted by changes in source data. This targeted approach significantly reduces overall computation time. More broadly, the development of a robust workflow supports the seamless integration of new data sources into the DBM, while ensuring that the final product is presented consistently across iterations. Future research may focus on the development of automated procedures to enhance the efficiency and reliability of the quality control process for the finalized DBM, building on current methodologies (Lubczonek et al., 2021; Masetti et al., 2022b).
The comprehensive metadata and documentation associated with DDM v2.0 are designed to enhance its discoverability among researchers, ensuring that it can be readily identified and utilized for specific scientific purposes. The original datasets, which are not distributed with the DDM v2.0 model, are comprehensively described in the auxiliary layers to provide detailed information about the specific bathymetric sources utilized within the DBM. This approach aligns with the broader goals of facilitating access to marine data, a critical objective under the EU Marine Strategy Framework Directive and the EU Marine Knowledge 2020 agenda, including initiatives such as EMODnet (Schaap & Schmitt, 2020; Thierry et al., 2019). DDM v2.0 is also slated to serve as a data source for the upcoming new release of EMODnet Bathymetry and represents the base for future contributions. The EMODnet Bathymetry initiative supports the integration of ‘composite grids’ – gridded products derived from multiple sources – by employing the SeaDataNet Sextant catalogue service, which has been specifically extended to accommodate the detailed submission of such datasets (Thierry et al., 2019).
DDM v2.0 holds significant potential for a wide range of scientific applications, spanning geological studies, oceanography, and marine biology. High-quality DBMs such as DDM v2.0 are critical for various aspects of marine geosciences, including seafloor characterization, sedimentological analysis, and offshore engineering. Detailed information on how to access DDM v2.0 is available through the Danish Geodata Agency website: https://eng.gst.dk/danish-hydrographic-office/denmark-depth-model.
5 Conclusions
DDM v2.0 is the result of an extensive and rigorous compilation process that integrates a diverse array of bathymetric data sources. These sources encompass several hundred bathymetric surveys, including both contemporary and historical datasets, as well as SDB and CSB bathymetric information. By referencing all depth measurements to the LAT datum, DDM v2.0 ensures uniformity and compatibility with other regional and global bathymetric models.
The model’s design and compilation methodology, which involves the synthesis of data with varying levels of precision and temporal relevance, precludes its use in applications for safety of navigation. Nevertheless, DDM v2.0 serves as an invaluable resource for a wide range of scientific, environmental, and marine spatial planning activities. The model supports coastal and marine researchers by providing detailed and reliable in-depth information essential for studies in areas such as marine geology, oceanography, and habitat mapping.
DDM v2.0 is made publicly accessible through the Danish Geodata Agency’s official website, offering an important tool for both national and international stakeholders. Moreover, it represents a substantial contribution to the EMODnet Bathymetry initiative, thereby enhancing the collective understanding of seabed topography across European waters. The ongoing development and refinement of the DDM underscore Denmark’s commitment to advancing marine science and supporting sustainable marine management.
Acknowledgements
Many past and present colleagues at the Danish Hydrographic Office and the Danish Navy’s Hydrographic Service have contributed to this work by providing feedback, data, and endless source of inspiration. In particular, the authors would like to thank Yvonne Morville Petersen, Elizabeth Hagemann, Katrine Petersen, Torben Weinkouff Rasmussen, James Peter Harris, Jonas Madsen, Juho Salmia, Nicki Riber Andreasen, Niels Bo Nielsen, Ove Andersen, Sotirios Skarpalezos, Sara Despres Abecasis Cardigos, Ian Berg Sonne, Claudia Mirela Mikaelsen, Kasper Møllerup Schnedler, Marie Louise Agerbak Andersen and Claus Buus Jensen, for having actively supported the development and the publication of the model. Special thanks to the EMODnet Regional Coordinators – the Swedish Maritime Authority (SMA), Federal Maritime and Hydrographic Agency (BSH) of Germany and Kartverket of Norway for the provided support in harmonizing DDM v2.0 with neighboring national bathymetric models and available datasets.
References
Andersen, O. B., Knudsen, P. and Berry, P. A. M. (2010). The DNSC08GRA global marine gravity field from double retracked satellite altimetry. Journal of Geodesy, 84(3), p. 191–199.
Bogumil, M., Mittal, T. and Lithgow-Bertelloni, C. (2024). The effects of bathymetry on the long-term carbon cycle and CCD. Proceedings of the National Academy of Sciences, 121(21), p. e2400232121.
Brown, C. J., Sameoto, J. A. and Smith, S. J. (2012). Multiple methods, maps and management applications: Purpose made seafloor maps in support of ocean management. Journal of Sea Research, 72, p. 1–13.
Danish Geodata Agency (2021). National Report of Denmark. IHO Baltic Sea Hydrographic Commission.
De Giosa, F., Scardino, G., Vacchi, M., Piscitelli, A., Milella, M., Ciccolella, A. and Mastronuzzi, G. (2019). Geomorphological Signature of Late Pleistocene Sea Level Oscillations in Torre Guaceto Marine Protected Area (Adriatic Sea, SE Italy). Water, 11(11), p. 2409.
Dierssen, H. M. and Theberge, A. E. (2020). Bathymetry: assessment. Coastal and Marine Environments: Boca Raton, FL, USA, CRC Press, p. 175–184.
Drennon, H., Ferrini, V. and Morton, J. J. (2023). Multibeam Data Curation and Access Through the Global Multi-Resolution Topography (GMRT) Synthesis. Proceedings OCEANS 2023 – MTS/IEEE U.S. Gulf Coast 25-28 Sept. 2023, p. 1–4.
EMODnet Bathymetry Consortium (2020). EMODnet Digital Bathymetry (DTM): Brussels, Belgium.
Erikstad, L., Bakkestuen, V., Bekkby, T. and Halvorsen, R. (2013). Impact of Scale and Quality of Digital Terrain Models on Predictability of Seabed Terrain Types. Marine Geodesy, 36(1), p. 2–21.
ESA (2015). Sentinel-2 products specification document. Thales Alenia Space, Rapport technique.
Fonseca, L., Lurton, X., Fezzani, R., Augustin, J.-M. and Berger, L. (2021). A statistical approach for analyzing and modeling multibeam echosounder backscatter, including the influence of high-amplitude scatterers. The Journal of the Acoustical Society of America, 149(1), p. 215–228.
GEBCO Bathymetric Compilation Group (2024). GEBCO_2024 Grid. NERC EDS British Oceanographic Data Centre NOC. https://doi.org/10.5285/1c44ce99-0a0d-5f4f-e063-7086abc0ea0f
Haigh, M., Holland, P. R. and Jenkins, A. (2023). The Influence of Bathymetry Over Heat Transport Onto the Amundsen Sea Continental Shelf. Journal of Geophysical Research: Oceans, 128(5), p. e2022JC019460.
Hartmann, K., Reithmeier, M., Knauer, K., Wenzel, J., Kleih, C. and Heege, T. (2022). Satellite-derived Bathymetry Online. The International Hydrographic Review, 28, p. 53–75.
Hughes Clarke, J. E. (2018a). The Impact of Acoustic Imaging Geometry on the Fidelity of Seabed Bathymetric Models. Geosciences, 8(4), p. 109.
Hughes Clarke, J. E. (2018b), Multibeam Echosounders. A. Micallef, S. Krastel and A. Savini (Eds.), Submarine Geomorphology (pp. 25–41). Springer International Publishing.
Ribergaard, M.H., Anker Pedersen, S., Ådlandsvik, B. and Kliem, N. (2004). Modelling the ocean circulation on the West Greenland shelf with special emphasis on northern shrimp recruitment. Continental Shelf Research, 24(13), p. 1505–1519.
Jakobsson, M. and Mayer, L. A. (2022). Polar Region Bathymetry: Critical Knowledge for the Prediction of Global Sea Level Rise. Frontiers in Marine Science, 8.
Jakobsson, M., Mayer, L. A., Bringensparr, C., Castro, C. F., Mohammad, R., Johnson, P., Ketter, T., Accettella, D., Amblas, D., An, L., Arndt, J. E., Canals, M., Casamor, J. L., Chauché, N., Coakley, B., Danielson, S., Demarte, M., Dickson, M.-L., Dorschel, B., Dowdeswell, J. A., Dreutter, S., Fremand, A. C., Gallant, D., Hall, J. K., Hehemann, L., Hodnesdal, H., Hong, J., Ivaldi, R., Kane, E., Klaucke, I., Krawczyk, D. W., Kristoffersen, Y., Kuipers, B. R., Millan, R., Masetti, G., Morlighem, M., Noormets, R., Prescott, M. M., Rebesco, M., Rignot, E., Semiletov, I., Tate, A. J., Travaglini, P., Velicogna, I., Weatherall, P., Weinrebe, W., Willis, J. K., Wood, M., Zarayskaya, Y., Zhang, T., Zimmermann, M. and Zinglersen, K. B. (2020). The International Bathymetric Chart of the Arctic Ocean Version 4.0, Scientific Data, 7(1), p. 176.
Jakobsson, M., Stranne, C., O’Regan, M., Greenwood, S. L., Gustafsson, B., Humborg, C. and Weidner, E. (2019). Bathymetric properties of the Baltic Sea. Ocean Sci., 15(4), p. 905–924.
Jarmbæk, J. (2005). Vejledning om højdesystemet. Kort og Matrikelstyrelsen.
Kjeldsen, K. K., Weinrebe, R. W., Bendtsen, J., Bjørk, A. A. and Kjær, K. H. (2017). Multibeam bathymetry and CTD measurements in two fjord systems in southeastern Greenland. Earth Syst. Sci. Data, 9(2), p. 589–600.
Koop, L., Snellen, M. and Simons, D. G. (2021). An Object-Based Image Analysis Approach Using Bathymetry and Bathymetric Derivatives to Classify the Seafloor. Geosciences, 11(2), p. 45.
Lebrec, U., Paumard, V., O’Leary, M. J. and Lang, S. C. (2021). Towards a regional high-resolution bathymetry of the North West Shelf of Australia based on Sentinel-2 satellite images, 3D seismic surveys and historical datasets. Earth Syst. Sci. Data, 13(11), p. 5191–5212.
Lebrec, U., Riera, R., Paumard, V., Leary, M. J. and Lang, S. C. (2022). Automatic Mapping and Characterisation of Linear Depositional Bedforms: Theory and Application Using Bathymetry from the North West Shelf of Australia. Remote Sensing, 14(2), p. 280.
Lecours, V., Dolan, M. F. J., Micallef, A. and Lucieer, V. L. (2016). A review of marine geomorphometry, the quantitative study of the seafloor. Hydrol. Earth Syst. Sci., 20(8), p. 3207–3244.
Lee, J. A. Y. (1991). Comparison of existing methods for building triangular irregular network, models of terrain from grid digital elevation models. International Journal of Geographical Information Systems, 5(3), p. 267–285.
Legeais, J. F., Ablain, M., Zawadzki, L., Zuo, H., Johannessen, J. A., Scharffenberg, M. G., Fenoglio-Marc, L., Fernandes, M. J. andersen, O. B., Rudenko, S., Cipollini, P., Quartly, G. D., Passaro, M., Cazenave, A. and Benveniste, J. (2018). An improved and homogeneous altimeter sea level record from the ESA Climate Change Initiative. Earth Syst. Sci. Data, 10(1), p. 281–301.
Lubczonek, J., Wlodarczyk-Sielicka, M., Lacka, M. and Zaniewicz, G. (2021). Methodology for Developing a Combined Bathymetric and Topographic Surface Model Using Interpolation and Geodata Reduction Techniques. Remote Sensing, 13(21), p. 4427.
Lubczonek, J. and Zaniewicz, G. (2023). Application of Filtering Techniques to Smooth a Surface of Hybrid Digital Bathymetric Model. Remote Sensing, 15( 19), p. 4737.
Lucieer, V., Lecours, V. and Dolan, M. F. J. (2018). Charting the Course for Future Developments in Marine Geomorphometry: An Introduction to the Special Issue. Geosciences, 8(12), p. 477.
Lurton, X. (2010). An introduction to underwater acoustics: principles and applications, Heidelberg, New York, Springer, published in association with Praxis Publishing, Chichester, UK.
Masetti, G., Andersen, O., Andreasen, N. R., Christiansen, P. S., Cole, M. A., Harris, J. P., Langdahl, K., Schwenger, L. M. and Sonne, I. B. (2022a). Denmark’s Depth Model: Compilation of Bathymetric Data within the Danish Waters. Geomatics, 2(4), p. 486–498.
Masetti, G., Faulkes, T., Wilson, M. and Wallace, J. (2022b). Effective Automated Procedures for Hydrographic Data Review. Geomatics, 2(3), p. 338–354.
Masetti, G., Kelley, J. G. W., Johnson, P. and Beaudoin, J. (2018a). A Ray-Tracing Uncertainty Estimation Tool for Ocean Mapping. IEEE Access, 6, p. 2136–2144.
Masetti, G., Mayer, L. and Ward, L. (2018b). A Bathymetry- and Reflectivity-Based Approach for Seafloor Segmentation. Geosciences, 8(1), p. 14.
Masetti, G., Rondeau, M., Baron, B. J., Wills, P., Petersen, Y. M. and Salmia, J. (2020). Trusted Crowd-Sourced Bathymetry: From the Trusted Crowd to the Chart. Danish Geodata Agency & Canadian Hydrographic Service.
Mayer, L. (2023). Uncrewed surface systems facilitating a new era of global ocean exploration. The International Hydrographic Review, 29(1), pp. 42–55. https://doi.org/10.58440/ihr-29-a05.
Mayer, L., Jakobsson, M., Allen, G., Dorschel, B., Falconer, R., Ferrini, V., Lamarche, G., Snaith, H. and Weatherall, P. (2018). The Nippon Foundation—GEBCO Seabed 2030 Project: The Quest to See the World’s Oceans Completely Mapped by 2030. Geosciences, 8(2), p. 63.
Mayer, L., Roach, J. A., Nordquist, M. H. and Long, R. (2021). Marine Biodiversity of Areas beyond National Jurisdiction. The Quest to Completely Map the World’s Oceans in Support of Understanding Marine Biodiversity and the Regulatory Barriers WE Have Created: Leiden, Netherlands, Brill, p. 149–166.
Mayer, L. A. (2022). The Challenges of Mapping the Seafloor, AGU Fall Meeting Abstracts, Volume 2022: Chicago, IL, p. U56A-03.
McMichael-Phillips, J., Rovere, M., Snaith, H., Souri, P. and Weatherall, P. (2024). The pivotal role of bathymetry in safeguarding the future of the planet. STATE OF THE OCEAN REPORT, p. 75.
Morrow, R., Fu, L.-L., Rio, M.-H., Ray, R., Prandi, P., Le Traon, P.-Y. and Benveniste, J. (2023). Ocean Circulation from Space. Surveys in Geophysics, 44(5), p. 1243–1286.
Moses, C. A. and Vallius, H. (2021). Mapping the Geology and Topography of the European Seas (European Marine Observation and Data Network, EMODnet). Quarterly Journal of Engineering Geology and Hydrogeology, 5(1), p. qjegh2020–2131.
O’Toole, R., Judge, M., Sacchetti, F., Furey, T., Mac Craith, E., Sheehan, K., Kelly, S., Cullen, S., McGrath, F. and Monteys, X. (2022). Mapping Ireland’s coastal, shelf and deep-water environments using illustrative case studies to highlight the impact of seabed mapping on the generation of blue knowledge. K. Asch, H. Kitazato and H. Vallius (Eds.). From Continental Shelf to Slope: Mapping the Oceanic Realm. Geological Society of London.
Palmiotto, C. and Loreto, M. F. (2019). Regional scale morphological pattern of the Tyrrhenian Sea: New insights from EMODnet bathymetry. Geomorphology, 332, p. 88–99.
Parrish, C. E., Magruder, L. A., Neuenschwander, A. L., Forfinski-Sarkozi, N., Alonzo, M. and Jasinski, M. (2019). Validation of ICESat-2 ATLAS Bathymetry and Analysis of ATLAS’s Bathymetric Mapping Performance. Remote Sensing, 11(14), p. 1634.
Ritter, N. and Ruth, M. (1997). The GeoTiff data interchange standard for raster geographic images. International Journal of Remote Sensing, 18(7), p. 1637–1647.
Sandwell, D. T., Gille, S. T., Orcutt, J. and Smith, W. H. F. (2003). Bathymetry from space is now possible. Eos, Transactions American Geophysical Union, 84(5), p. 37–44.
Schaap, D. M. A. and Schmitt, T. (2020). EMODnet Bathymetry – further developing a high resolution digital bathymetry for European seas. p. 10296.
Smith, S. M. (2003). The navigation surface: A multipurpose bathymetric database. University of New Hampshire.
Sowers, D. C., Masetti, G., Mayer, L. A., Johnson, P., Gardner, J. V. and Armstrong, A. A. (2020). Standardized Geomorphic Classification of Seafloor Within the United States Atlantic Canyons and Continental Margin. Frontiers in Marine Science, 7.
Sowers, D. C., Mayer, L. A., Masetti, G., Cordes, E., Gasbarro, R., Lobecker, E., Cantwell, K., Candio, S., Hoy, S., Malik, M., White, M. and Dornback, M. (2024). Mapping and Geomorphic Characterization of the Vast Cold-Water Coral Mounds of the Blake Plateau. Geomatics, 4(1), p. 17–47.
Thierry, S., Dick, S., George, S., Benoit, L. and Cyrille, P. (2019), EMODnet Bathymetry a compilation of bathymetric data in the European waters. Proceedings OCEANS 2019 – Marseille17-20 June 2019, p. 1–7.
Vrdoljak, L. (2021). Comparison and analysis of publicly available bathymetry models in the East Adriatic Sea. NAŠE MORE: znanstveni casopis za more i pomorstvo, 68(2), p. 110–119.
Ware, C., Mayer, L. and Johnson, P. (2023). BathyGlobe GapFiller: A planning tool to help fill the gaps in world bathymetry. The International Hydrographic Review, 29(2), pp. 16–27. https://doi.org/10.58440/ihr-29-2-a19
Watson, D. (1999). The natural neighbor series manuals and source codes. Computers & Geosciences, 25(4), p. 463–466.
Weatherall, P., Marks, K. M., Jakobsson, M., Schmitt, T., Tani, S., Arndt, J. E., Rovere, M., Chayes, D., Ferrini, V. and Wigley, R. (2015). A new digital bathymetric model of the world’s oceans. Earth and Space Science, 2(8), p. 331–345.
Westfeld, P., Maas, H.-G., Richter, K. and Weiß, R. (2017). Analysis and correction of ocean wave pattern induced systematic coordinate errors in airborne LiDAR bathymetry. ISPRS Journal of Photogrammetry and Remote Sensing, 128, p. 314–325. https://doi.org/10.1016/j.isprsjprs.2017.04.008
Authors’ biographies

Giuseppe Masetti holds a MSc in Ocean Engineering, a Master in Marine Geomatics and a PhD in System Monitoring and Environmental Risk Management. After having served as hydrographic officer with the Italian Navy, he was a Tyco PostDoc Fellow with the Center for Coastal and Ocean Mapping, where he is at present an adjunct research faculty. In 2019 he has joined the Danish Hydrographic Office, where he is currently focusing on streamlining hydrographic data workflows.

Philip Sigaard Granding holds a MSc in Physics. He is specialized in the field of geophysics and has worked with different applications of remote sensing techniques such as airborne lidar- and satellite derived bathymetry. He joined the Danish Geodata Agency, Hydrographic Office, in 2017, and is currently focused on planning and leading development and innovation projects.

Kasper Langdahl, Cand.geom, Land surveyor. Specialized in database management. 5 years of experience in managing hydrographic data. Work tasks at the Danish Geodata Agency focus on quality control, refining and distributing bathymetry data.

Lasse M. Schwenger earned a cand.polyt degree in Water & Environmental Engineering from Aalborg University in 2021. He then spent a year working in open-channel hydraulics, where he explored the use of sonar technology for river surveying to support flow modeling. Since august 2022 he has worked at the Danish Geodata Agency, engaging in remote sensing activities in both Denmark and Greenland.

Kristian V. Kristmar earned a cand.polyt in Geophysics and Space Engineering with a specialization in Mapping and Navigation at The Danish Technical University, where he graduated from in 2023. He has since worked as a geodesist for the Danish Geodata Agency.
- https://www.atlassian.com/software/jira/ (accessed 31 August 2024).
- https://www.postgresql.org/ (accessed 31 August 2024).
- https://www.geopackage.org/ (accessed 31 August 2024).
- https://www.teledynecaris.com/en/products/bathy-database/ (accessed 31 August 2024).
- https://www.eomap.com/ (accessed 31 August 2024).
- https://eng.gst.dk/danish-hydrographic-office/denmark-depth-model/ (accessed 31 August 2024).