



Abstract
1 Introduction
Coastal zones host approximately 40 % of the global population and many essential infrastructure and ecosystems. These areas are vital for various economic sectors, such as maritime transport and tourism, and are prerequisite regions for deploying offshore renewable energy platforms. Moreover, coastal zones encompass unique habitats, and many major cities are situated along shorelines, making these regions critical for human settlement and development (Small and Nicholls, 2003). Coastal bathymetry is highly dynamic due to erosion, sediment transport and deposition mainly controlled by currents, wave activity, sea-level rise, storm events, and human activities. The ongoing population growth, human-induced changes such as land reclamation and dredging, subsidence issues of mega cities given overload, climate change, extreme weather events, and natural catastrophes are exerting significant pressures and altering the shape and structure of coasts and the bathymetry (Syvitski et al., 2005). Mapping, monitoring, and analyzing shallow water bathymetry and its dynamics are critical for modeling, predicting, and mitigating potential threats to coastal communities, economies, and ecosystems. Comprehensive and sustainable coastal management hinges on up-to-date and detailed bathymetric data availability. Despite its importance, vast global coastal zones remain unmapped, and survey data is often outdated or marred by significant gaps (Mayer et al., 2018). Traditional bathymetric onsite surveys using, e.g., ship-born acoustic measurements or Light Detection and Ranging (LiDAR) surveys face significant limitations in shallow nearshore areas, such as limited coverages, high costs, logistical challenges, and safe navigation access. Facing these challenges and considering the compelling need for area-wide high-resolution bathymetry data, Satellite-Derived Bathymetry (SDB) has become a cost-effective and efficient solution for mapping shallow waters, supporting stakeholders with their survey-planning and modeling activities, providing bathymetric maps in yet unmapped and inaccessible areas and enabling the constant monitoring of seabed dynamics (IHO, 2024).
In order to achieve high comprehensive spatial coverage, SDB methods with gridded results are of particular importance. According to the International Hydrographic Organization (IHO, 2024), these gridded SDB methods can be classified in the following five categories: (1) Empirical SDB methods require onsite bathymetric data and use mathematical models and spectral information from multi- or hyperspectral satellite images (Lyzenga et al., 2006; Stumpf et al., 2003). (2) Machine Learning (ML) models identify patterns in satellite images, correlating them with bathymetric depths based on initial training (Niederjasper, 2020). (3) Photogrammetric SDB utilizes matching points from high-resolution satellite images taken from varied angles to calculate depths through triangulation (Chénier et al., 2018). (4) Physics-based SDB methods invert radiative transfer equations and model the sunlight’s pathway to determine depths without survey data based on multi- or hyperspectral imagery (Kisselev & Bulgarelli, 2004). (5) Bathymetry gathered from waves measures the shoaling effect of waves using radar or multispectral imagery (Pleskachevsky et al., 2011; Bergsma et al., 2019).
Bathymetry from waves has the great advantage that it can also be used in optically turbid waters and over seafloor with low reflectance, which makes it of particular importance regarding the achievement of a global coastal bathymetry coverage. Therefore, this paper focuses on the latter method (5), Wave Kinematics Bathymetry (WKB, e.g., Bergsma et al., 2019 and Almar et al., 2024), and its global applicability (Almar et al., 2021) to derive coastal bathymetry in 100 m spatial resolution. The WKB approach is based on the interconnection between bathymetry and surface wave speed and wavelength, which is also described by the dispersion relation equation (Holthuijsen, 2007). By measuring the wavelength and speed over a short time lag, this equation can be solved to determine water depth. Common analysis methods include the Fast Fourier Transform (Pleskachevsky et al., 2011) and Radon Transform (Bergsma et al., 2019) of image subsets to calculate average depths. Almar et al. (2021) applied the WKB approach in 500 m resolution on a global scale based on the freely available Copernicus Sentinel-2 satellite data. However, local and regional studies showed the potential to derive bathymetry in higher resolutions based on Sentinel-2 satellite data (Bergsma et al., 2019; Delay et al., 2022). Past studies completely neglected post-processing, the systematic exclusion of unfeasible areas, and the elimination of false positives in the final dataset, leading to high error measurements (Almar et al., 2021; Almar et al., 2024).
This study elaborates on how the reliability and accuracy of satellite-derived WKB data can be improved while establishing a fully automatic, scalable, harmonized, and standardized processing framework. Verification and quantification strategies are explored, ensuring an effective process performance and improving the quality and reliability of the bathymetry. Methods are elaborated, increasing the data quality by developing systematic and automatic post-processing techniques to minimize false positives in the final dataset. Finally, a globally applicable WKB process in 100 m spatial resolution is set up.
2 Methodology
2.1 Study sites
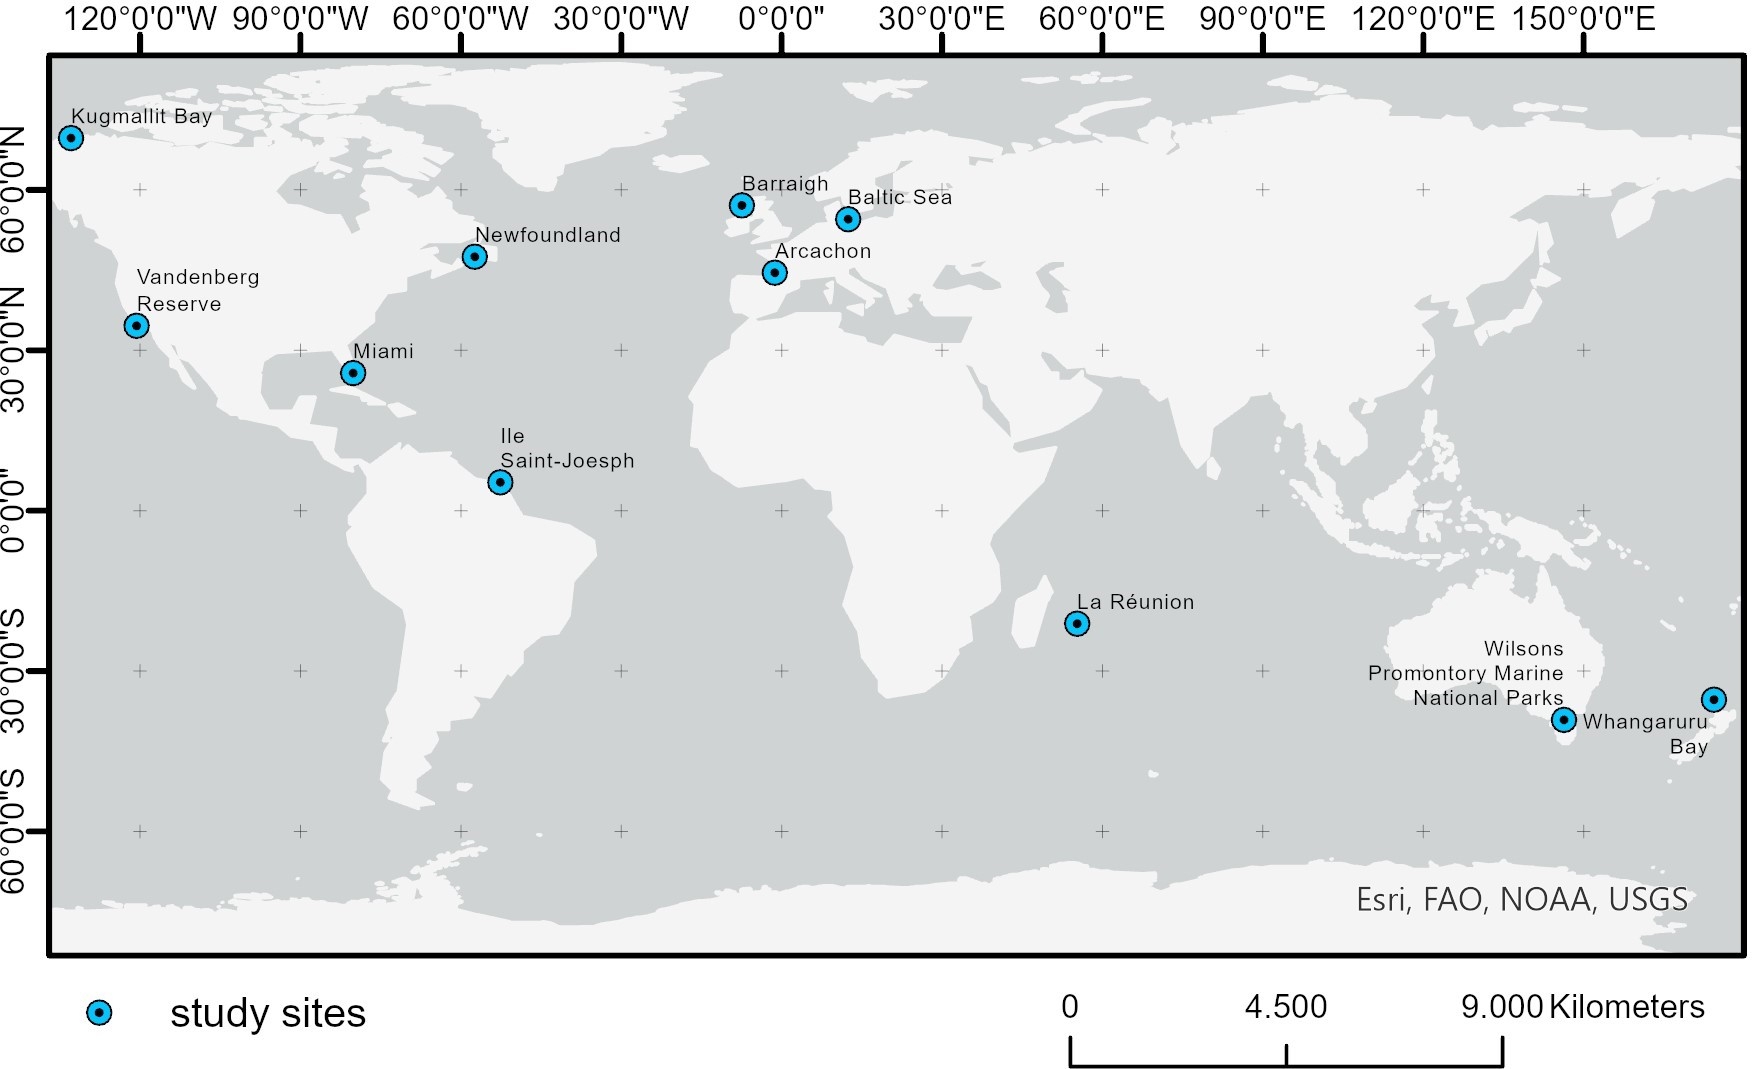
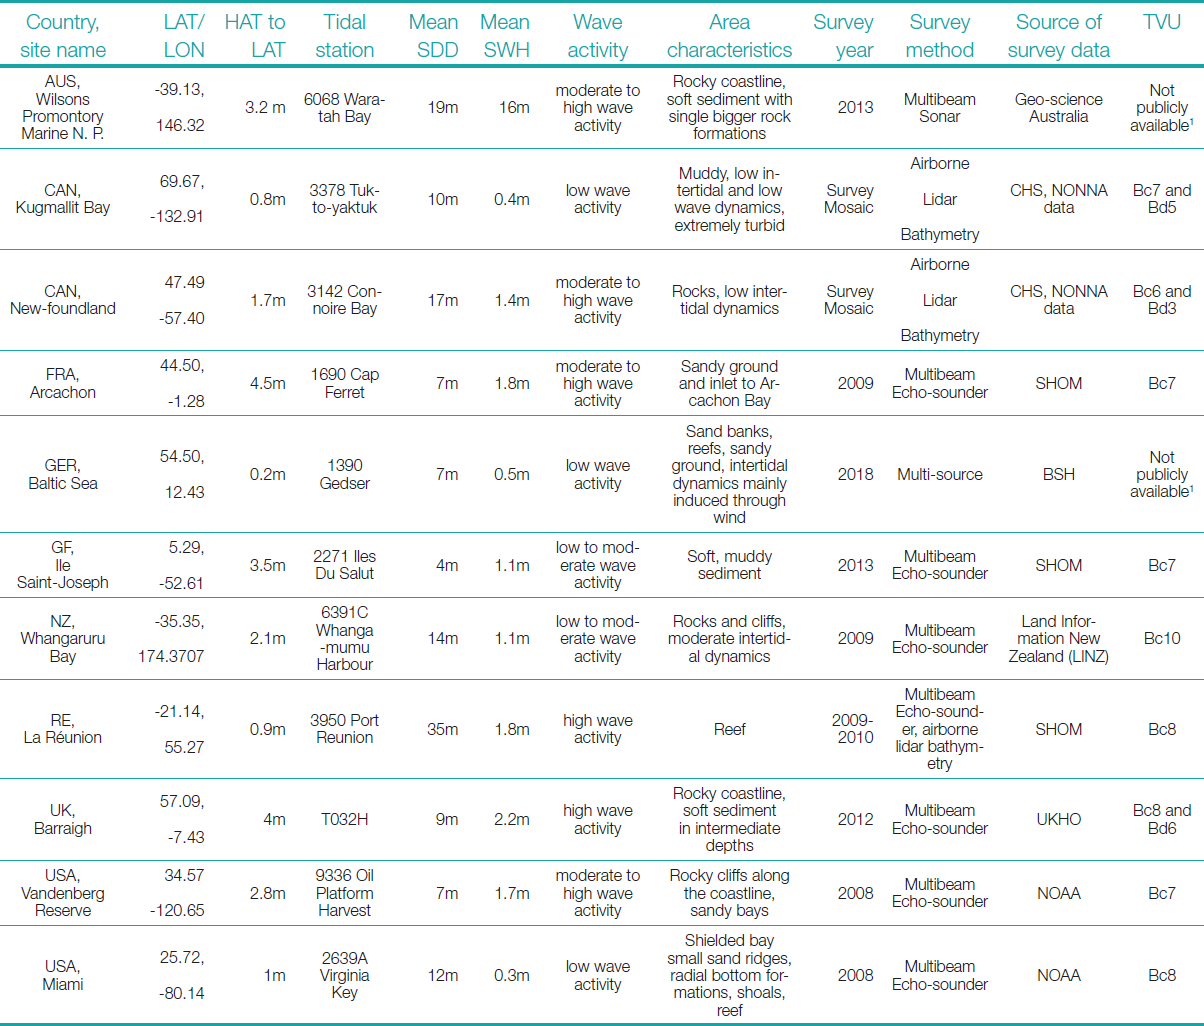
All analyses are carried out on eleven globally distributed study sites shown in Fig. 1. The selected sites are Wilsons Promontory Marine National Parks, AUS, Kugmallit Bay, CAN, Newfoundland, CAN, Arcachon, FRA, Baltic Sea, GER, Ile Saint-Joseph, GF, Whangaruru Bay, NZ, La Réunion, RE, Barraigh, UK, Miami, USA and Vandenberg Reserve, USA. Table 1 summarizes the sites’ most important characteristics and the information on the validation data used.
These study sites were chosen to test the methods in diverse environmental conditions and in a broad range of latitudes, from equatorial regions like Ile Saint-Joseph, GF, to polar regions like Kugmallit Bay, CAN. These sites exhibit a variety of wave and tide dynamics, ranging from the Baltic Sea, GER, with very low wave dynamics and wave heights (0.5 m) at minor tidal differences (0.2 m) to Barraigh, UK, with extremely high waves (2.2 m) and tide dynamics (4 m). Publicly accessible hydrographic shallow water survey data are available for each site, enabling a reliable validation of the final bathymetry results. The hydrographic survey data were transformed from their original coordinate system to the WGS84 geodetic reference system, resampled to 100 m spatial resolution, and referenced to the Lowest Astronomical Tide (LAT) accessing the tidal information from the respective tide gauges via Admiralty Total Tide. These processing steps ensure consistency with the spatial resolution and vertical reference of the WKB results.
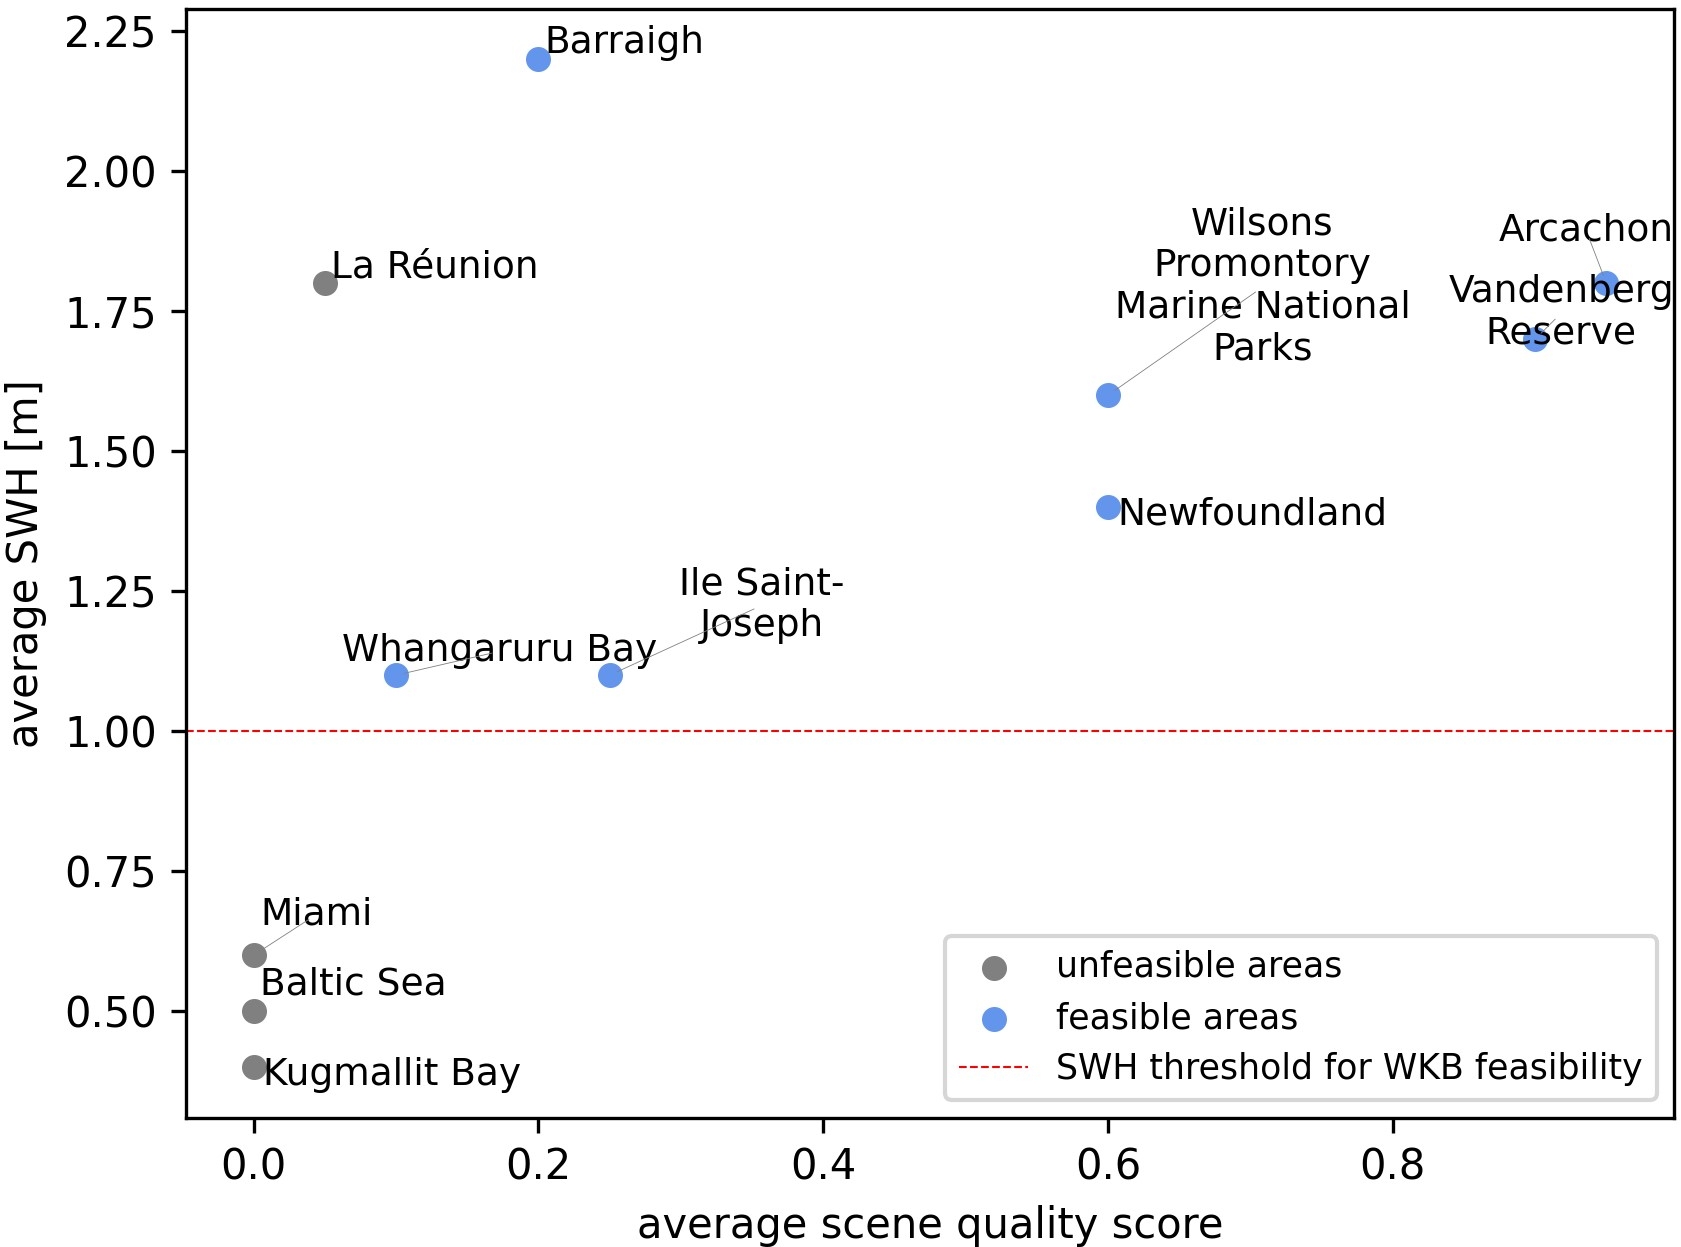
The quality of the WKB results depends strongly on the presence of significant waves in the area (Almar et al., 2019). Accordingly, the WKB feasibility of an area can be assessed depending on globally available wave parameters like the temporally aggregated significant wave height (SWH; Copernicus, 2023b). In line with other WKB studies (Bell, 2008), preceding tests showed that areas with mean SWH smaller than 1 m are not feasible for calculating WKB. Following this, the study sites Kugmallit Bay, CAN, Baltic Sea, GER, and Miami, USA, are not considered feasible for WKB processing. However, they are included in the following analysis for proof of concept on a global scale and for assessing the feasibility prior to processing based on SWH values. Also, the test site at La Réunion is included to ensure a comprehensive analysis, even though it is unlikely to lead to meaningful WKB results. The site is dominated by a very short reef surrounding the island, dropping into deep waters at the reef crest. Despite a high average SWH of 1.8 m, waves mostly break at reef crests, where the elevation is exceptionally steep, and the terrain gets too deep for WKB processing. All other study sites show mean SWH values above 1 m and are categorized as feasible.
2.2 Wave kinematics bathymetry processing
The WKB method utilizes the interconnection between waves and bathymetry in intermediate to shallow waters. When waves approach more shallow waters, they increasingly interact with the seabed; propagation is expressed by the dispersion relation for free surface waves:
| ꞷ2 = k g tanh(k h) | (1) |
Where ω is the wave frequency, k is the wave number, g is the gravitational constant, and h is the water depth (Holthuijsen, 2007). The dispersion relation function can be solved for the water depth by deriving wavelength and speed from comparing two satellite image bands recorded with a slight time lag (Bergsma et al., 2019). This principle is visualized in Fig. 2.
The WKB processing in this study is based on the method described by Bergsma et al. (2019) and is executed in 100 m resolution. The approach combines the Radon transform (RT) and the Fast-Fourier transform (FFT) method to detect waves within a moving window. The window size needs to cover 1–2 surface water wavelengths. As waves become shorter when approaching the shoreline, the window size varies respectively. Areas directly at the shore are calculated using a window of 500 m, increasing to 800 m towards the deep water.

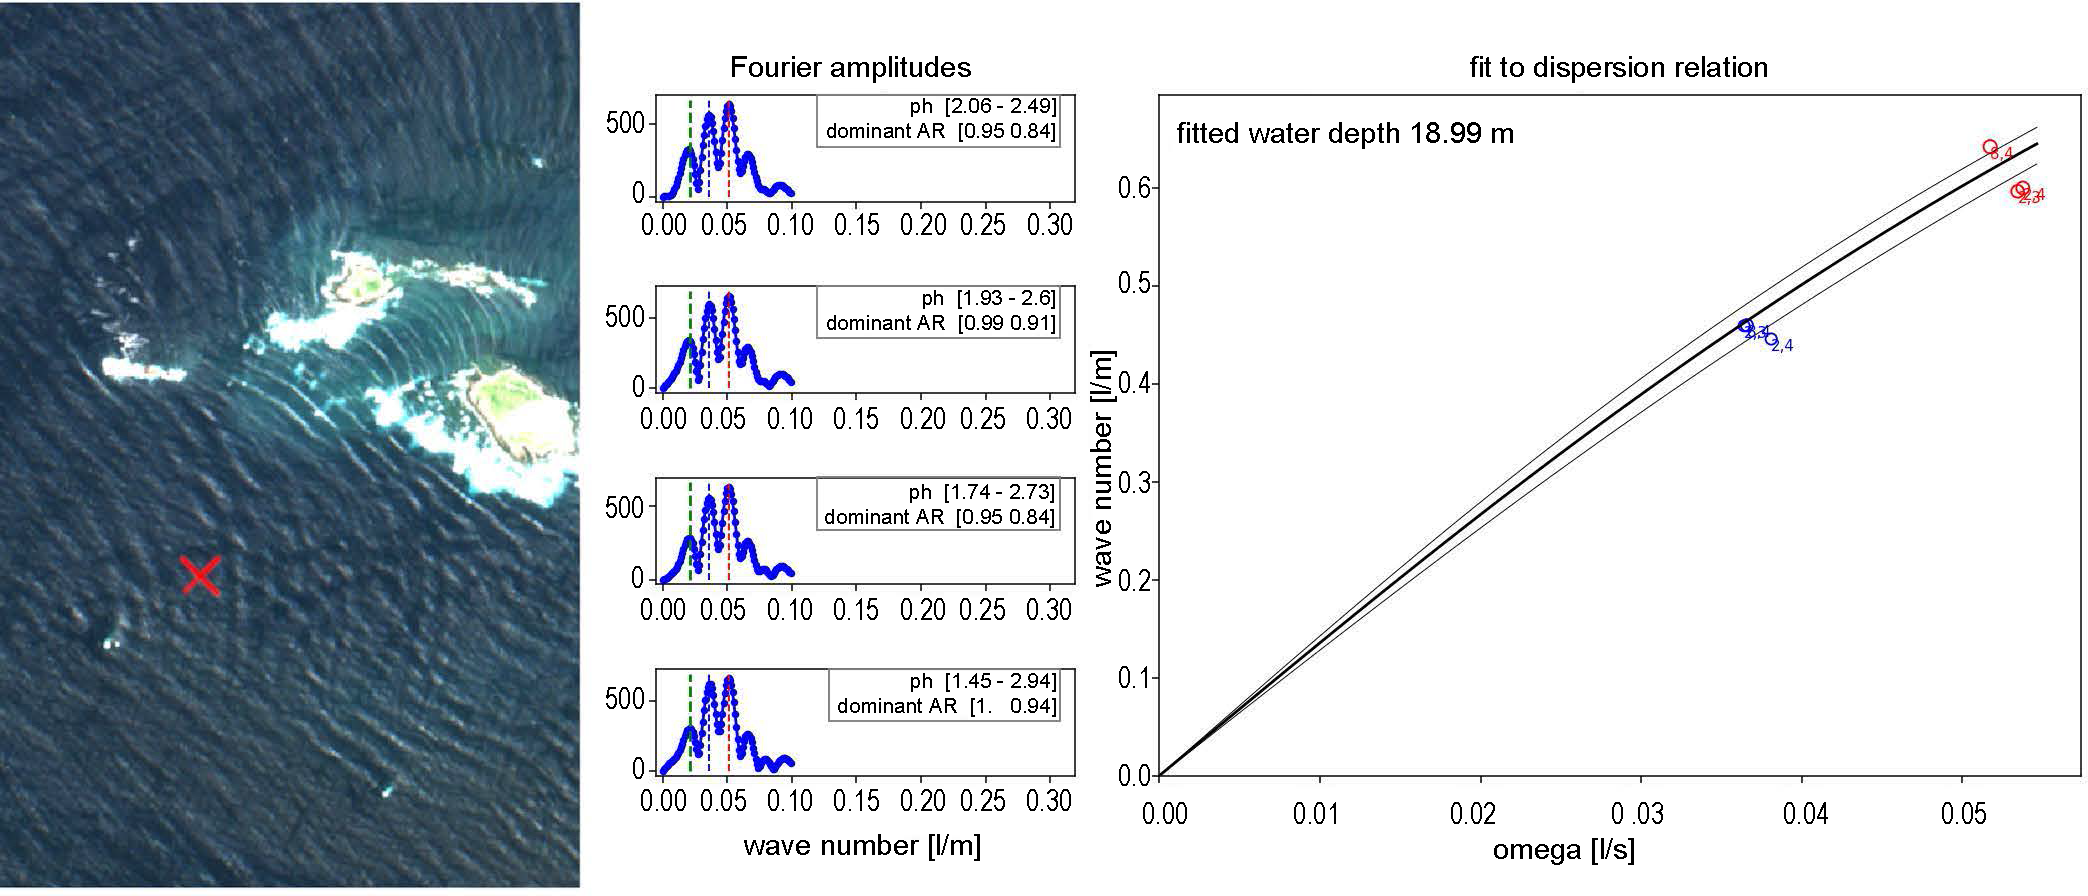
First, an RT is applied to the window, detecting the wave direction (Bergsma et al., 2019). The slice of the RT at the dominant wave direction (the Radon slice) is extracted and shows a one-dimensional signal, which is then analyzed using an FFT that contains information on the wavelengths. Wave speed can be derived when relating multiple different subsets (e.g., from the different image bands) and the time lag of the captures. While past studies carried out the analysis only for one peak in the Fourier spectrum, this study involves analyzing multiple peaks, which enhances wave detection robustness. This methodology is depicted in Fig. 3, where multiple peaks are used to analyze the wave pattern.
Additionally, the algorithm now employs a versatile approach, fitting all speed-wavelength pairs to the wave dispersion relation. This approach, first introduced in the ’80s for Xband radar-based studies by, e.g., Young et al. (1985) and later applied to satellite imagery by Gawehn et al. (2022), provides more robust results, especially in deeper waters. By considering all data points and identifying the best water depth, it overcomes the limitations of calculating effective water depth for each individual speed-wavelength pair, which can lead to invalid results or skewed depth estimates.
Past studies observed overestimation of depths in very shallow waters, resulting from the increasing non-linearity of waves moving toward the shore (Bell, 2001). On the other hand, errors increase with the water depth. The reason for these higher errors in deeper waters is that waves do not interconnect with the seafloor anymore at water depths much larger than the wavelength itself (Simarro et al., 2019).
To address these common errors, a wave quality estimation is calculated, which assesses the similarity of the wave pattern to an ideal sinusoidal pattern. Fig. 4 illustrates this approach based on an example image.
Two points are analyzed: the upper point reveals a well-defined wave pattern that the RT successfully detects, producing a quality estimate of q=1 compared to a sine wave. Conversely, the lower point, dominated by a strong sun glint pattern, shows a significant deviation from the sinusoidal curve, resulting in a quality score of q=0.
The full WKB processing workflow is installed on the AWS cloud environment.

2.3 Satellite data and scene selection
2.3.1 Sentinel-2 satellite data
The WKB processing is based on data from the European Space Agency’s Sentinel-2 satellites. The two Sentinel-2 (2A and 2B) satellites capture the earth’s surface every 3-5 days, depending on latitude, with publicly available data. Each Sentinel-2 satellite features four spectral bands in the visible and near-infrared regions with a spatial resolution of 10 meters, as well as nine additional bands in the visible to shortwave infrared with resolutions of 20 to 60 meters (ESA, 2024). The bands are recorded with a slight time lag, enabling wavelength and speed derivation and solving the linear dispersion function for water depth.
The bands used for this study are blue (band 02, ⁓490 nm), green (band 03, ⁓560 nm), red (band 04, ⁓665 nm), red edge (band 05, ⁓705 nm), and two more near-infrared bands (band 08, ⁓842 nm and band 09, ⁓945 nm). Table 2 lists the bands and the respective recording time lags.

2.3.2 Satellite scene selection workflow
Although waves may be present during satellite image acquisition, they might not exhibit a sufficiently clear optical signature to derive bathymetry (Danilo and Binet, 2013). Therefore, the scene selection must prioritize satellite images with visually detectable waves. The scene selection method utilizes the WKB processing methodology and includes the following steps:
- Cloud filtering: Only Sentinel-2 images with less than 30 % cloud coverage above the processing area are considered for further analysis.
- Wave detection: For the feasible imagery, point sampling is conducted. A window is created around each sample point. The RT, the extraction of the Radon slice, and the FFT are applied, to derive wavelength, speed, and amplitude.
- Quality scoring: The quality score (described in chapter 2.2) is obtained for each sample point. The quality scores within one image are averaged, enabling a satellite scene ranking based on this quality score. The highest-ranked 10 scenes from the scene selection approach are processed and used as a basis for the multi-scene bathymetry grid creation.
All workflows are installed on an AWS cloud environment, enabling direct and fast access to the Sentinel-2 image archive and parallelizing the processing on 500 up to 1000 docker instances.
2.4 Data merging and post-processing
The merging of the single scene WKB results and post-processing of the data are pivotal steps as they reduce noise and artifacts and limit false positives, overall making the results more robust and reliable. In the context of SDB, fully automatic data cleaning presents significant challenges. Removing false positives by visual data analysis and comparisons with charts and other sources are effective on a smaller scale. However, this exclusion must be automated to develop a fully scalable approach. This study combines multiple statistical approaches to reduce invalid water depth values and refine the dataset systematically. The applied cleaning workflow consists of three significant steps:
- Water level correction: All raw WKB single scene outputs are corrected from date and time of the satellite record to LAT using the FES2014 (Lyard et al., 2021) via a direct API access.
- Leveraging multi-scene information on a pixel-basis: The first step involves an analysis on a pixel basis, considering all processed single scenes. A layer stack is created to facilitate this process. This includes:
- Quality Filtering: In very shallow waters, the wavelengths shorten, leading to a lower quality index and higher noise. Pixels with an average quality index of less than 0.3 are removed from the dataset.
- Removal of false positives: Single-scene false positives are removed on a pixel basis. Therefore, z-scores are calculated for each pixel’s single scene values. Values with a z-score more than three are excluded.
- Merging the single scenes: If a pixel contains less than 20 % of the original dataset’s values, it lacks sufficient quality and is removed. The remaining valid water depth values are merged on a pixel basis, applying a weighted average utilizing their respective quality indices.
- Spatial consistency: This step involves determining data noise within a moving window, by considering the standard deviation and the deviation of each pixel’s value from the moving window average. Pixels with a higher absolute deviation from the window average than 2m+10 % water depth (set as TVU requirements Bc6 and Bd2 based on the S-44 matrix; IHO, 2020) and with a standard deviation higher than 2 m are considered noisy and are erased. While this step may create holes in the bathymetry grid, it enhances spatial consistency and removes false positives.
- Smoothing the final dataset: The final dataset undergoes smoothing using a kernel filter to reduce residual noise and artifacts. Any remaining single pixels are deleted to achieve a cleaner and more coherent dataset. The result will show a smooth, spatially consistent bathymetry surface but still contain data holes where the WKB results were insufficient. In operational use, the kernel filter might be exchanged by a median filter or splines with tension interpolation (Wessel and Bercovici,1998), depending on the user requirements and application field of the bathymetry dataset.
2.5 Validation and quality assessment
The quality of the bathymetry results is assessed through visual interpretation and quantitative validation. Visual interpretation involves qualitative analysis of the dataset for anomalies or inconsistencies. The dataset is compared quantitatively against the respective hydrographic survey data. The results are analyzed for spatial correlation and standard error statistics, including correlation coefficient (r), Root Mean Square Error (RMSE), the coefficient of determination (R²), and the slope of the linear regression function. Lower RMSE values, an r and R² close to 1, and a slope near 1 indicate high accuracy and strong spatial correlation.
3 Results
In this chapter, the results will be presented and interpreted.
3.1 Automatic scene selection
The scene selection approach proved to effectively detect the visible waves in the imagery. Table 3 summarizes the results of the scene selection approach for the different areas, including the minimum, maximum, and average scene quality score values.
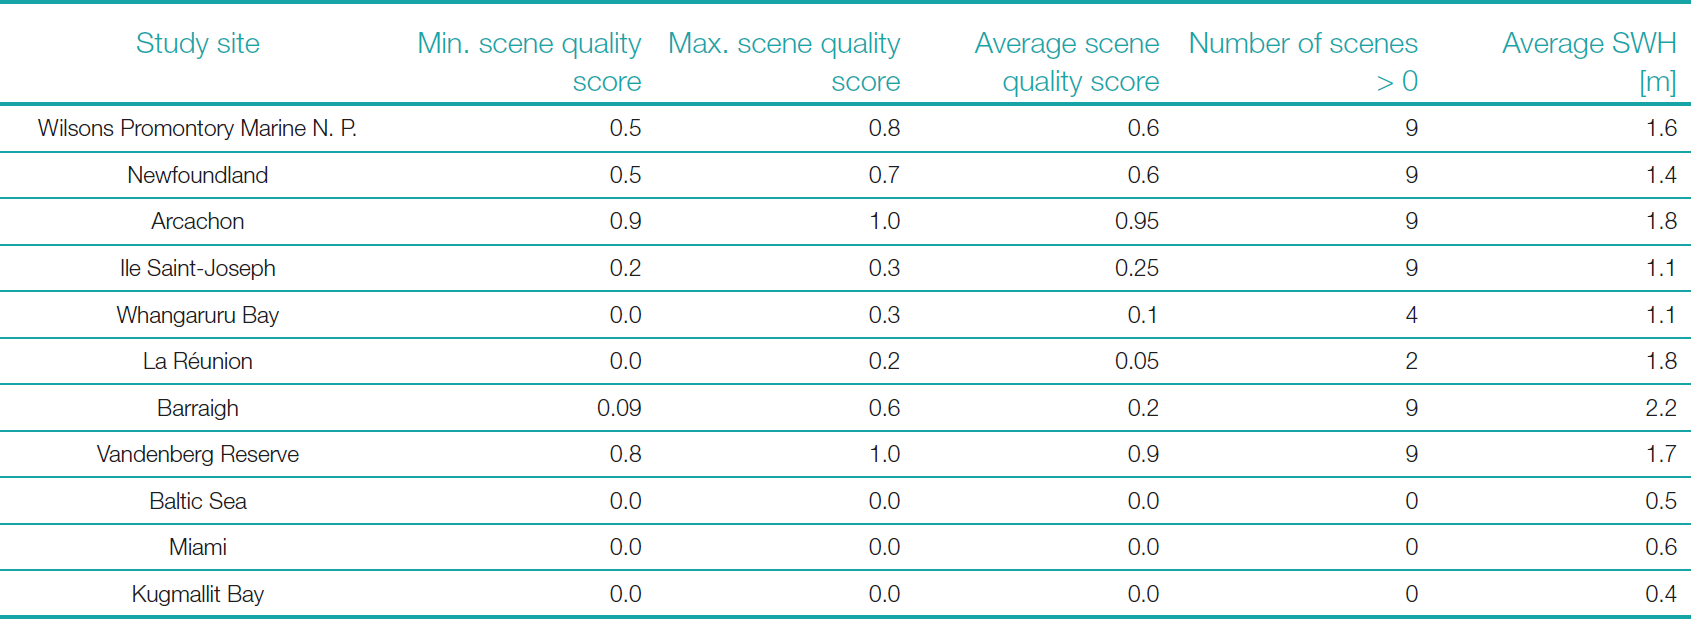
The results initially deemed unfeasible also do not exhibit any distinctly detectable wave signals. Consequently, no satellite scenes with low cloud cover and sufficient wave signals were detected for Miami, US, Baltic Sea, GER, and Kugmallit Bay, CAN. La Réunion shows two scenes with very low scene quality scores. In the other areas, the average scene quality score ranges from very low scores of 0.1 (Whangaruru Bay, NZ) to high scores of 0.95 (Arcachon, FRA).
Fig. 5 illustrates the relation between each area’s average scene quality score and its average SWH. It shows that by applying an average SWH threshold of 1 m, the unfeasible areas Miami, US, Baltic Sea, GER, and Kugmallit Bay, CAN, can be systematically excluded. The other areas show an increased average scene quality score with a higher average SWH. The Barraigh, UK area represents an outlier, which can be attributed to several factors: the region exhibits the highest seasonality of SWH (1.5 m in summer and 3.6 m in winter). In winter, when the SWH is highest, the sun elevation angle is too low to cause sun reflection on the water surface, making visual wave detection significantly more challenging. Additionally, the winter months in this region are the most precipitation-rich, leading to very high cloud cover and a reduction in the number of cloud-free scenes.
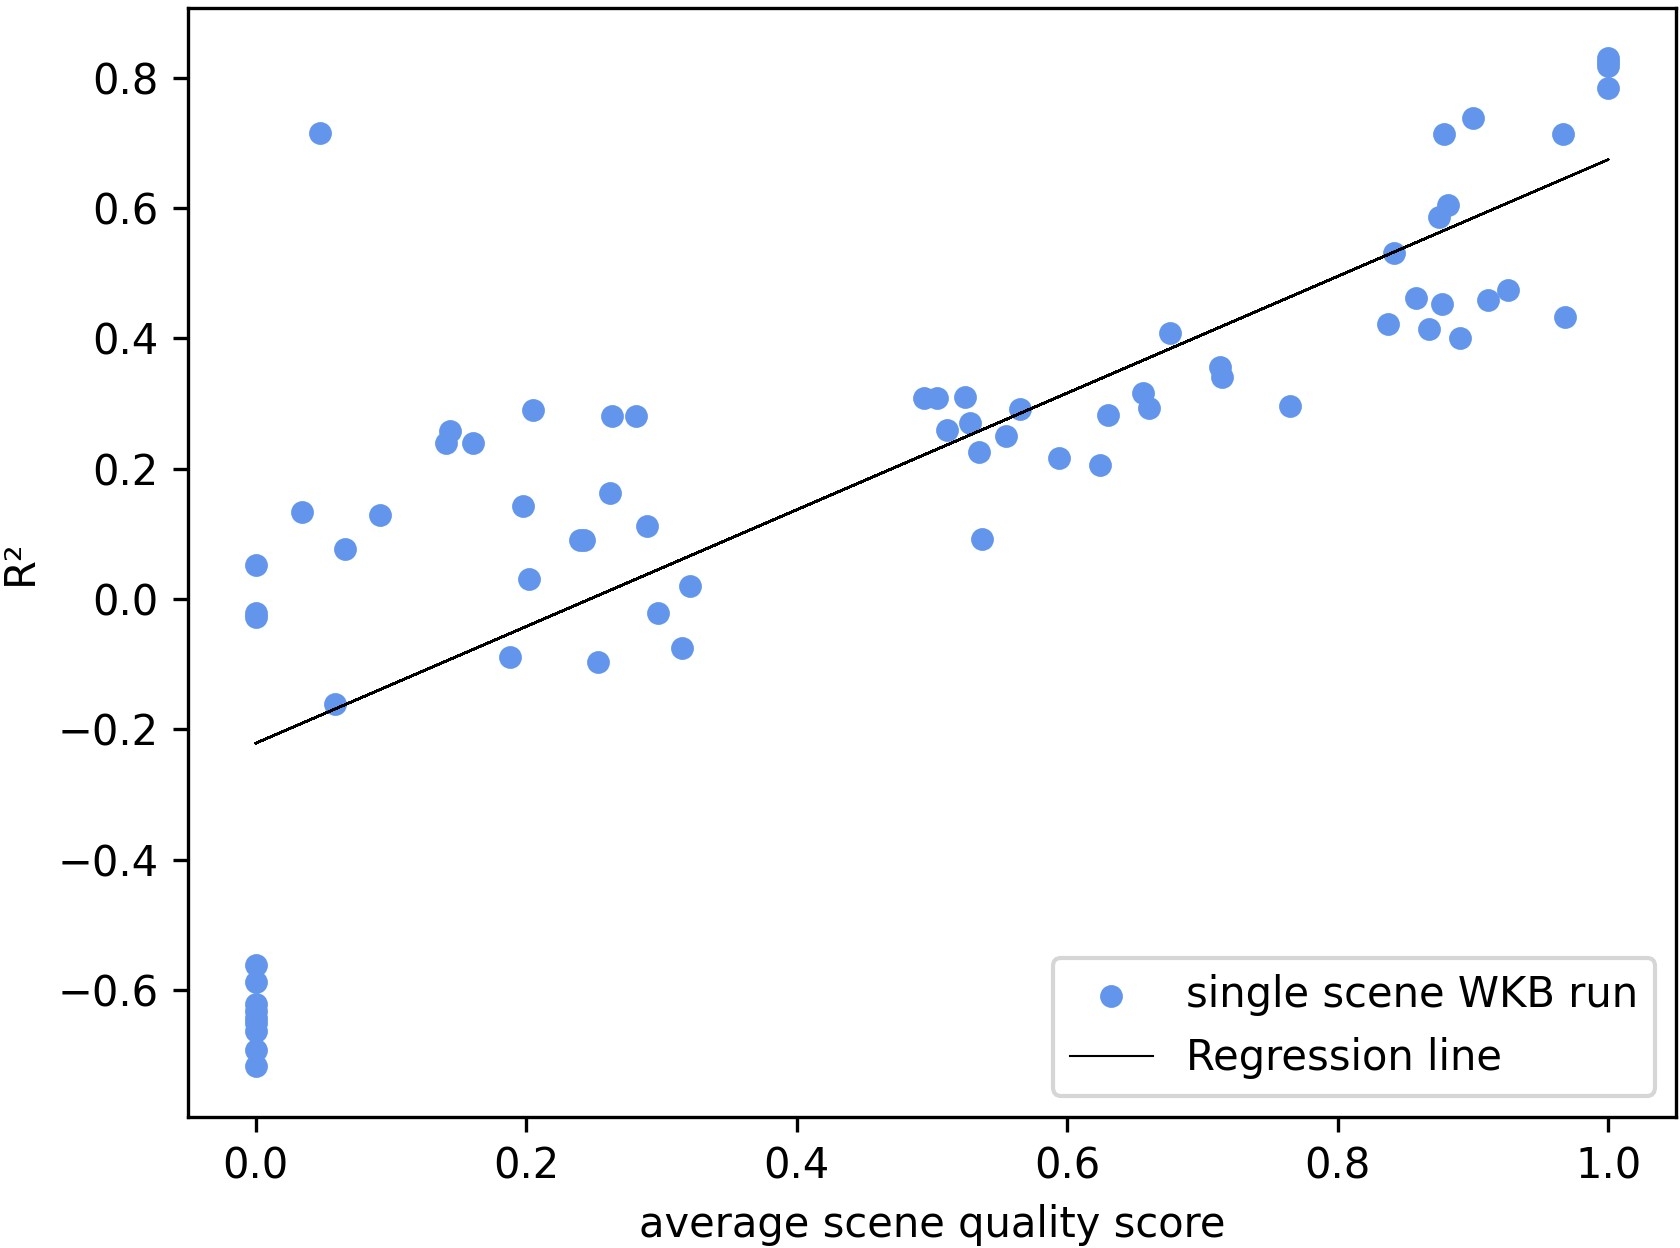
The extent to which the scene score affects the bathymetry results of individual scenes is illustrated in Fig. 6. Therefore, the raw (not post-processed) single-scene bathymetry results were validated against the hydrographic survey data. The resulting R² is compared to the respective scene quality score, showing a linear regression. Scene scores of 0 lead to a negative R² and contain no valid bathymetric information. Therefore, these must be discarded when processing the multi-scene image. Conversely, even scenes with low scores above 0 yield low but positive R² values. When combined to a multi-scene grid, these scenes can contribute to valid bathymetry information and are retained.
The image selection process, based on the automatic visual detection of waves using the average scene quality score proved to be effective to select suitable imagery for WKB processing. Thereby the impact of sun elevation angle and luminosity does not need to be quantified separately. Overall, the scene quality score represents a very good proxy for the WKB quality.
3.2 Wave Kinematics Bathymetry field results
The areas classified as non-feasible in Miami, USA, the Baltic Sea, GER, Kugmallit Bay, CAN, and La Réunion produced exclusively erroneous pixels during processing, which were subsequently automatically removed during post-processing. Consequently, none of these areas contains valid bathymetric information. These areas are excluded from further analysis. The WKB results for all other areas are presented in the following.
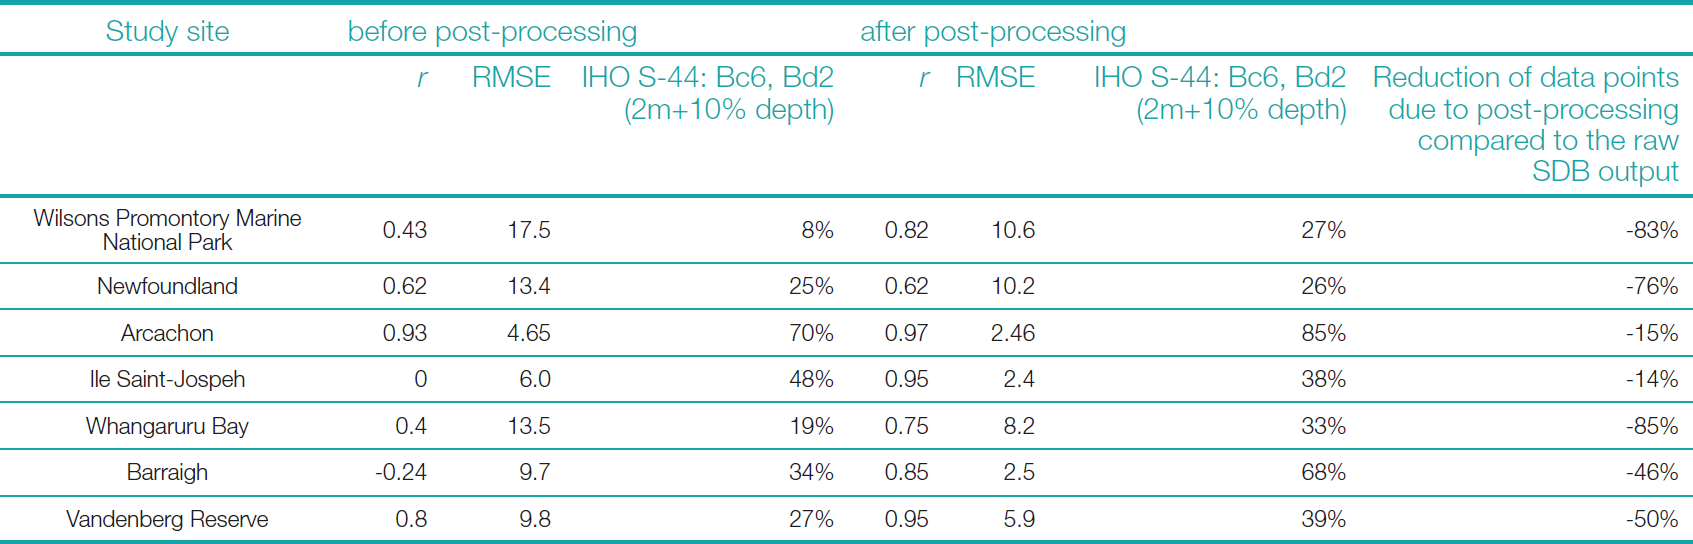
Table 4 presents the r values, RMSE, and the percentage of the WKB data meeting the IHO S-44 TVU requirement Bc6 and Bd2, for the raw multi-scene outputs and for the post-processed bathymetry, as well as the reduction of data points due to post-processing compared to the raw SDB output. The table indicates an average decrease of the RMSE of 4.6 m and a substantial increase of r, induced by the post-processing. Even if the IHO S-44 TVU requirements Bc6 and Bd2 were not achieved in any of the cases regarding the 95% confidence interval, an apparent increase in data points that fall into this category is evident for all areas. However, this quality improvement is accompanied by a considerable reduction of data points in the bathymetry result, shown in the last column as a percentage change compared to the raw bathymetry output.
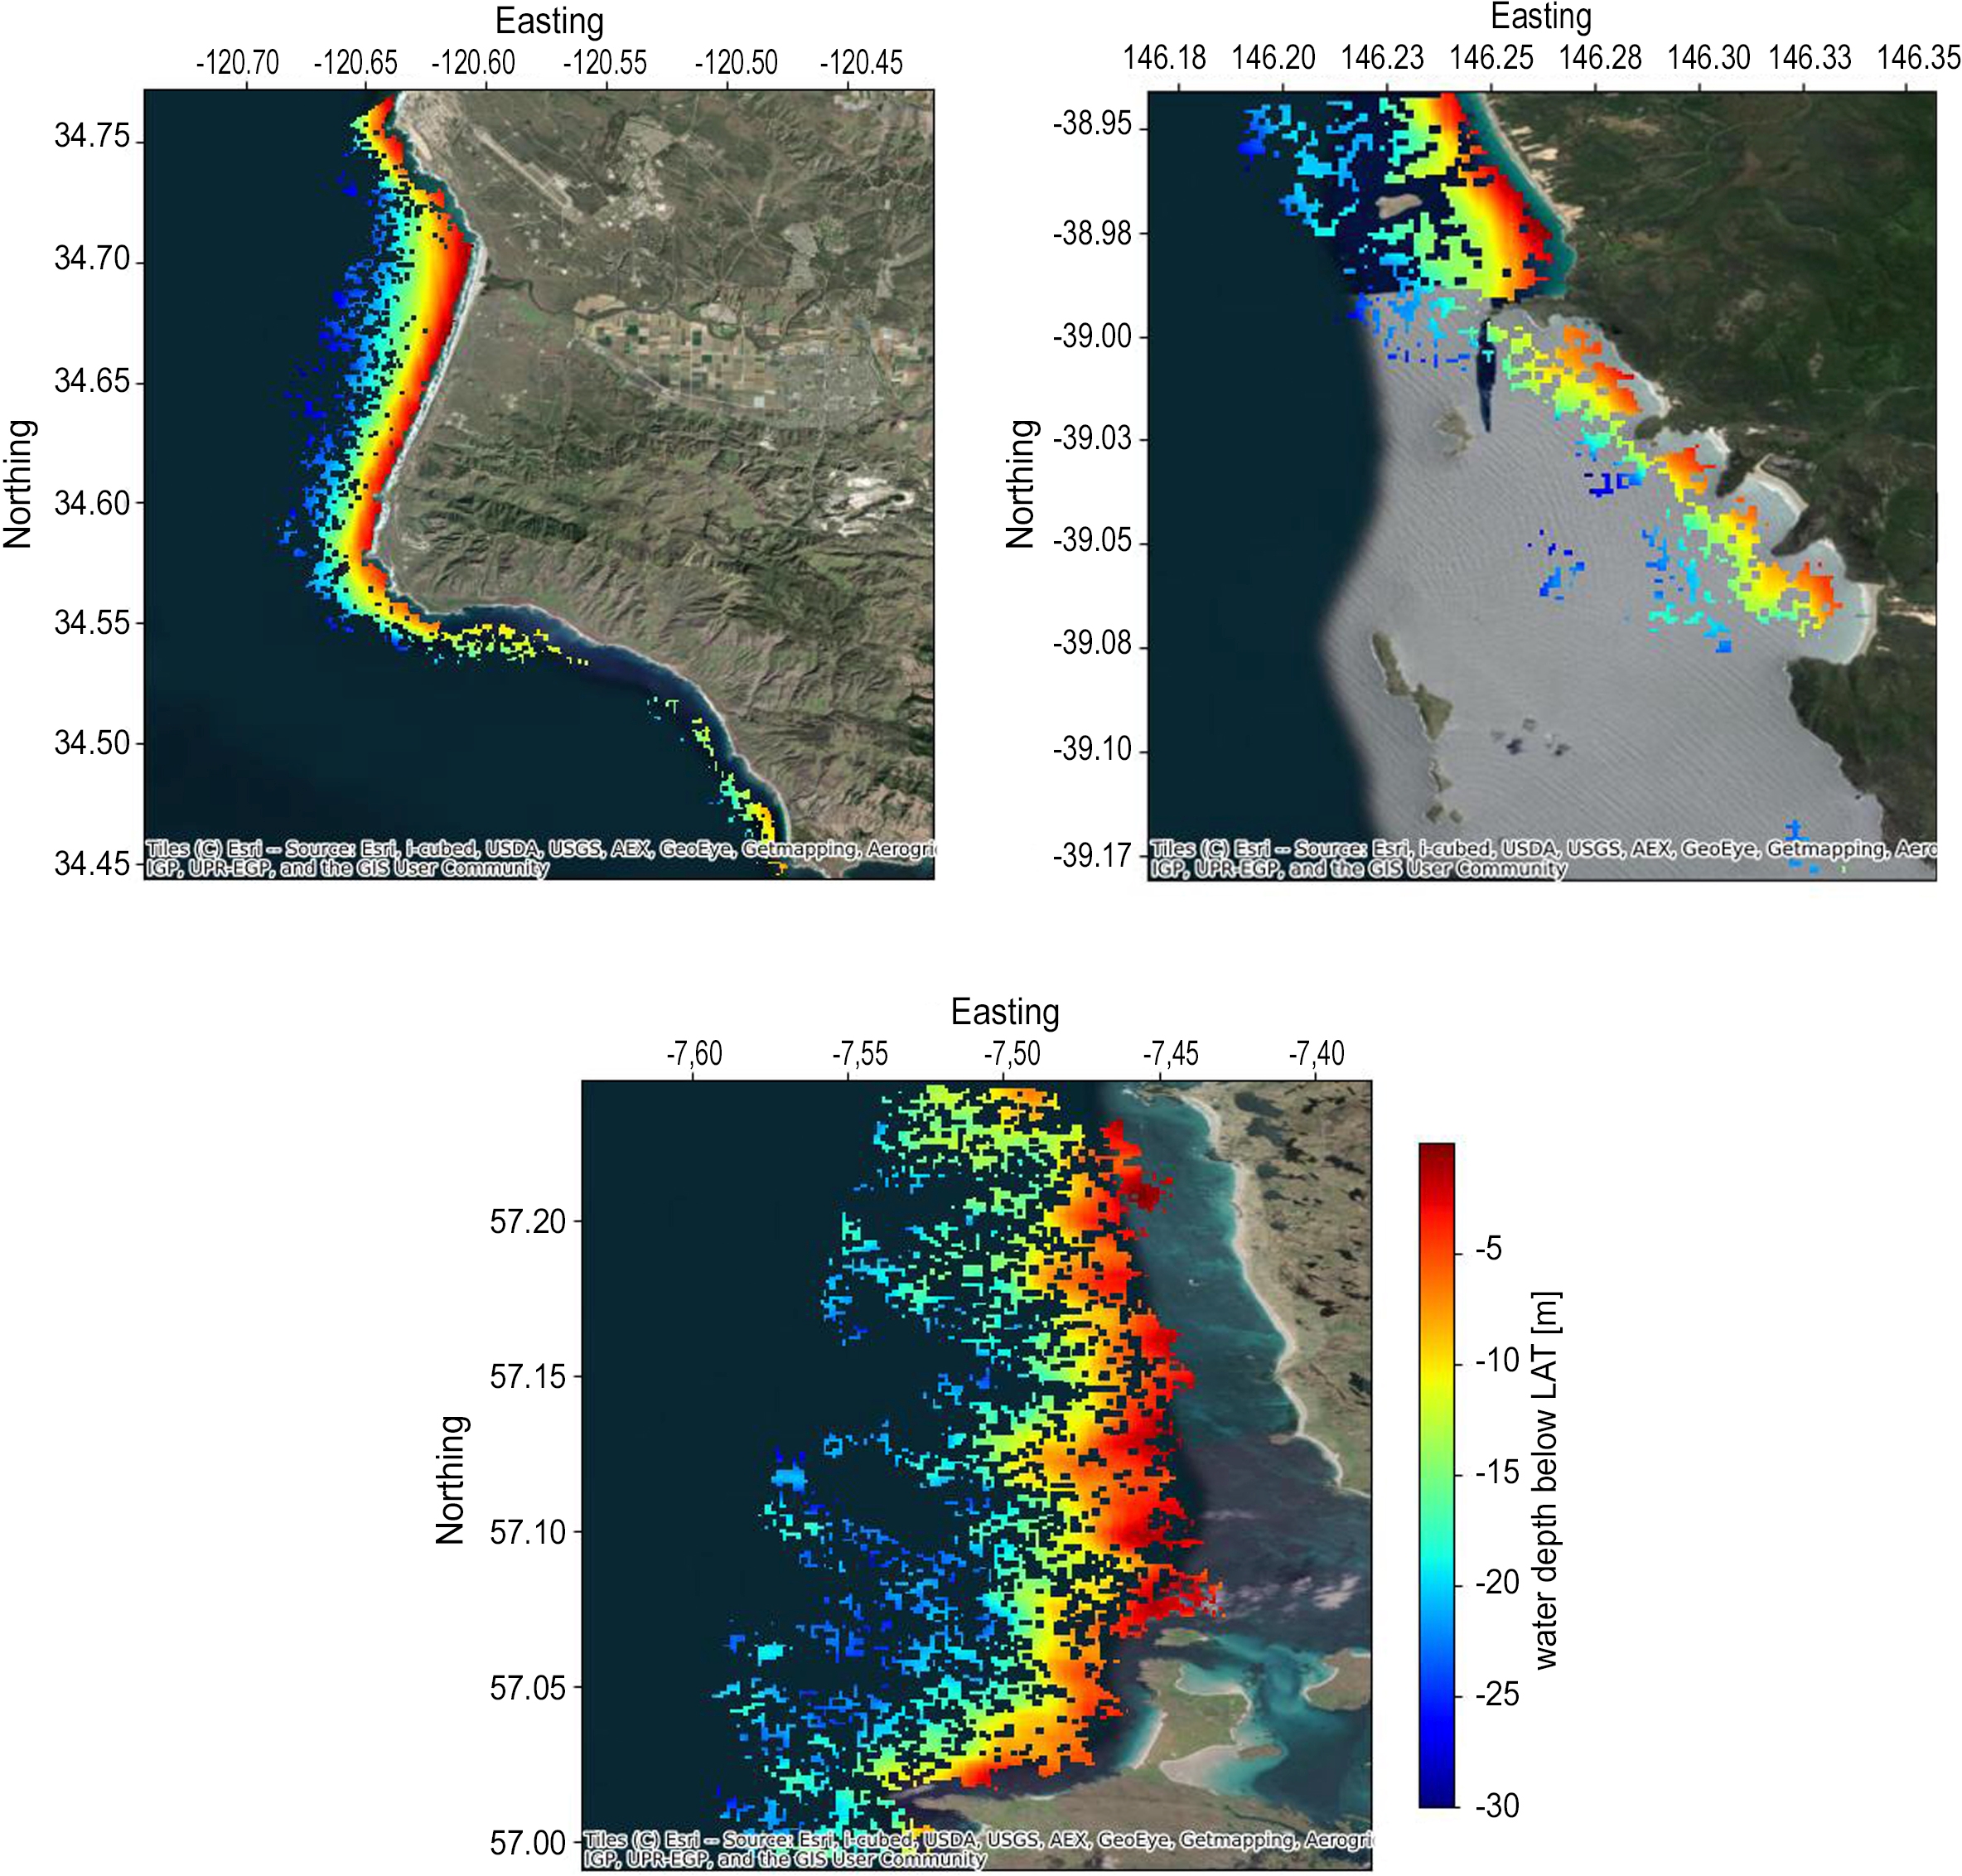
Fig. 7 showcases the results of the fully automated WKB, and post-processing based on the study sites Vandenberg Reserve, USA, Barraigh, UK, and Wilsons Promontory Marine National Park, AUS. The WKB surface is smoothly discernible in each of these areas, displaying visual consistency across varying environments. Areas characterized by lower SWH, such as Barraigh, UK, show larger data gaps due to the automated post-processing. This deliberate exclusion of potentially valid data points is a trade-off designed to enhance the overall dataset quality during post-processing.
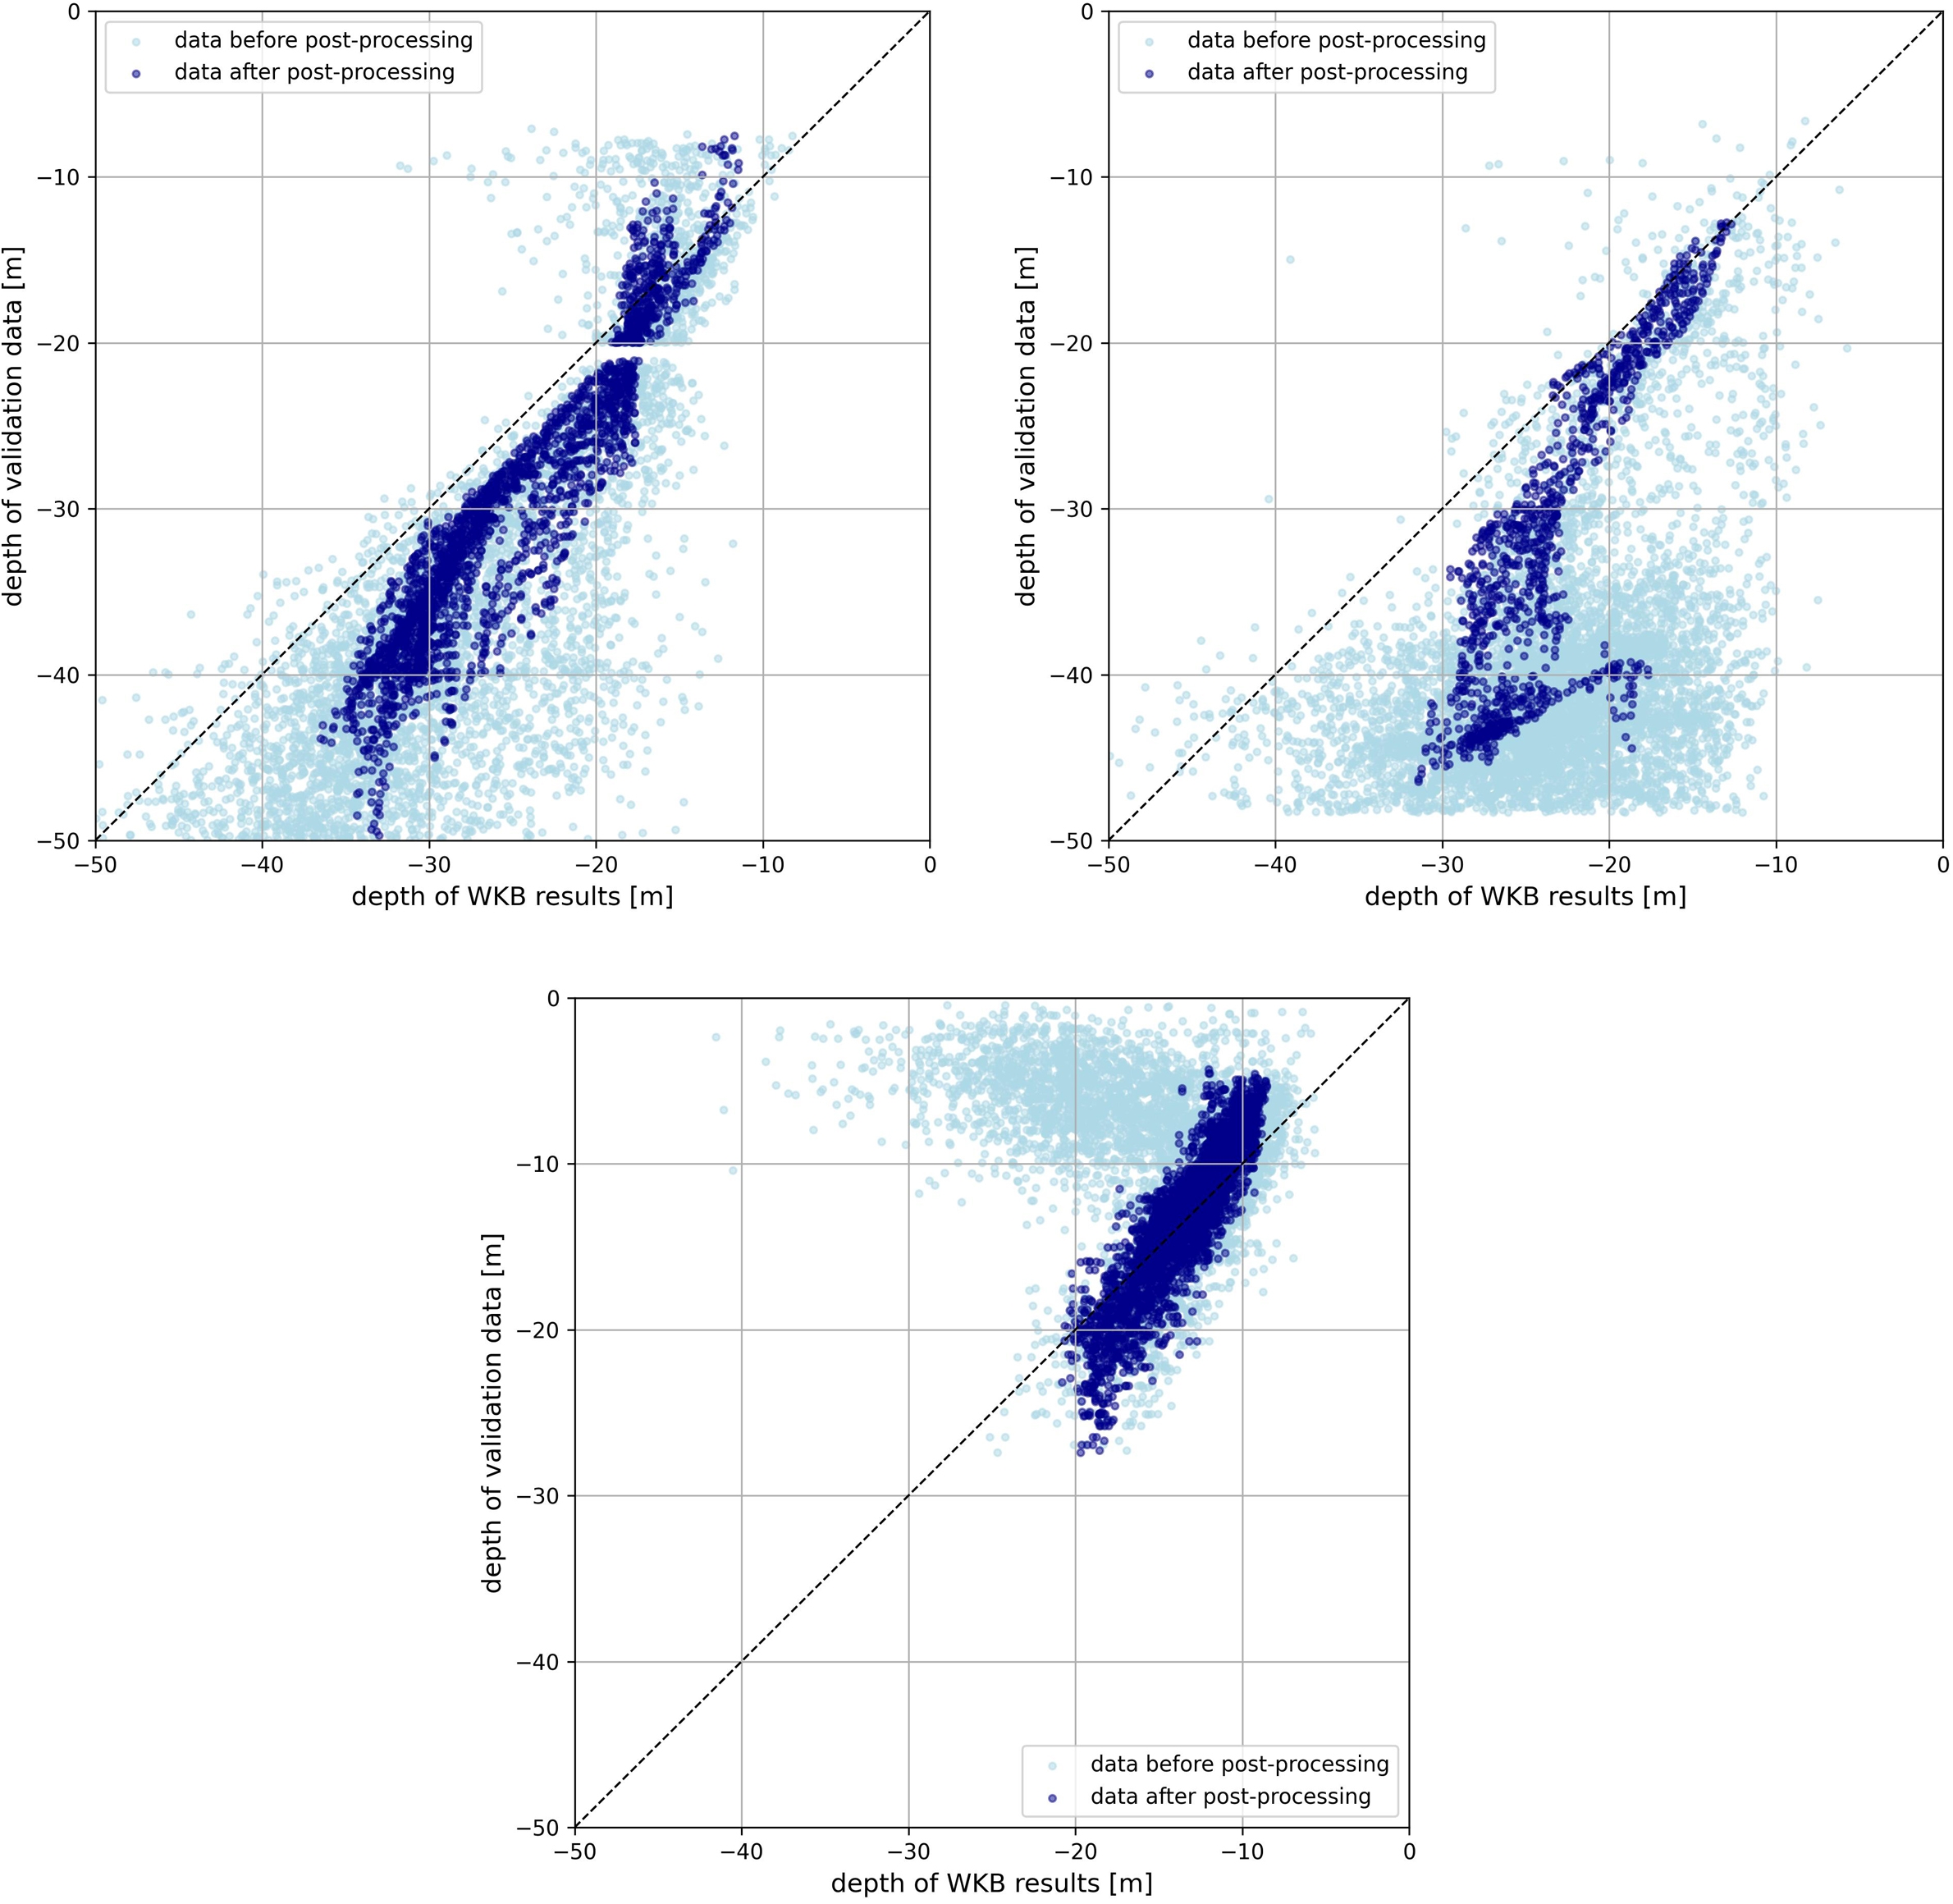
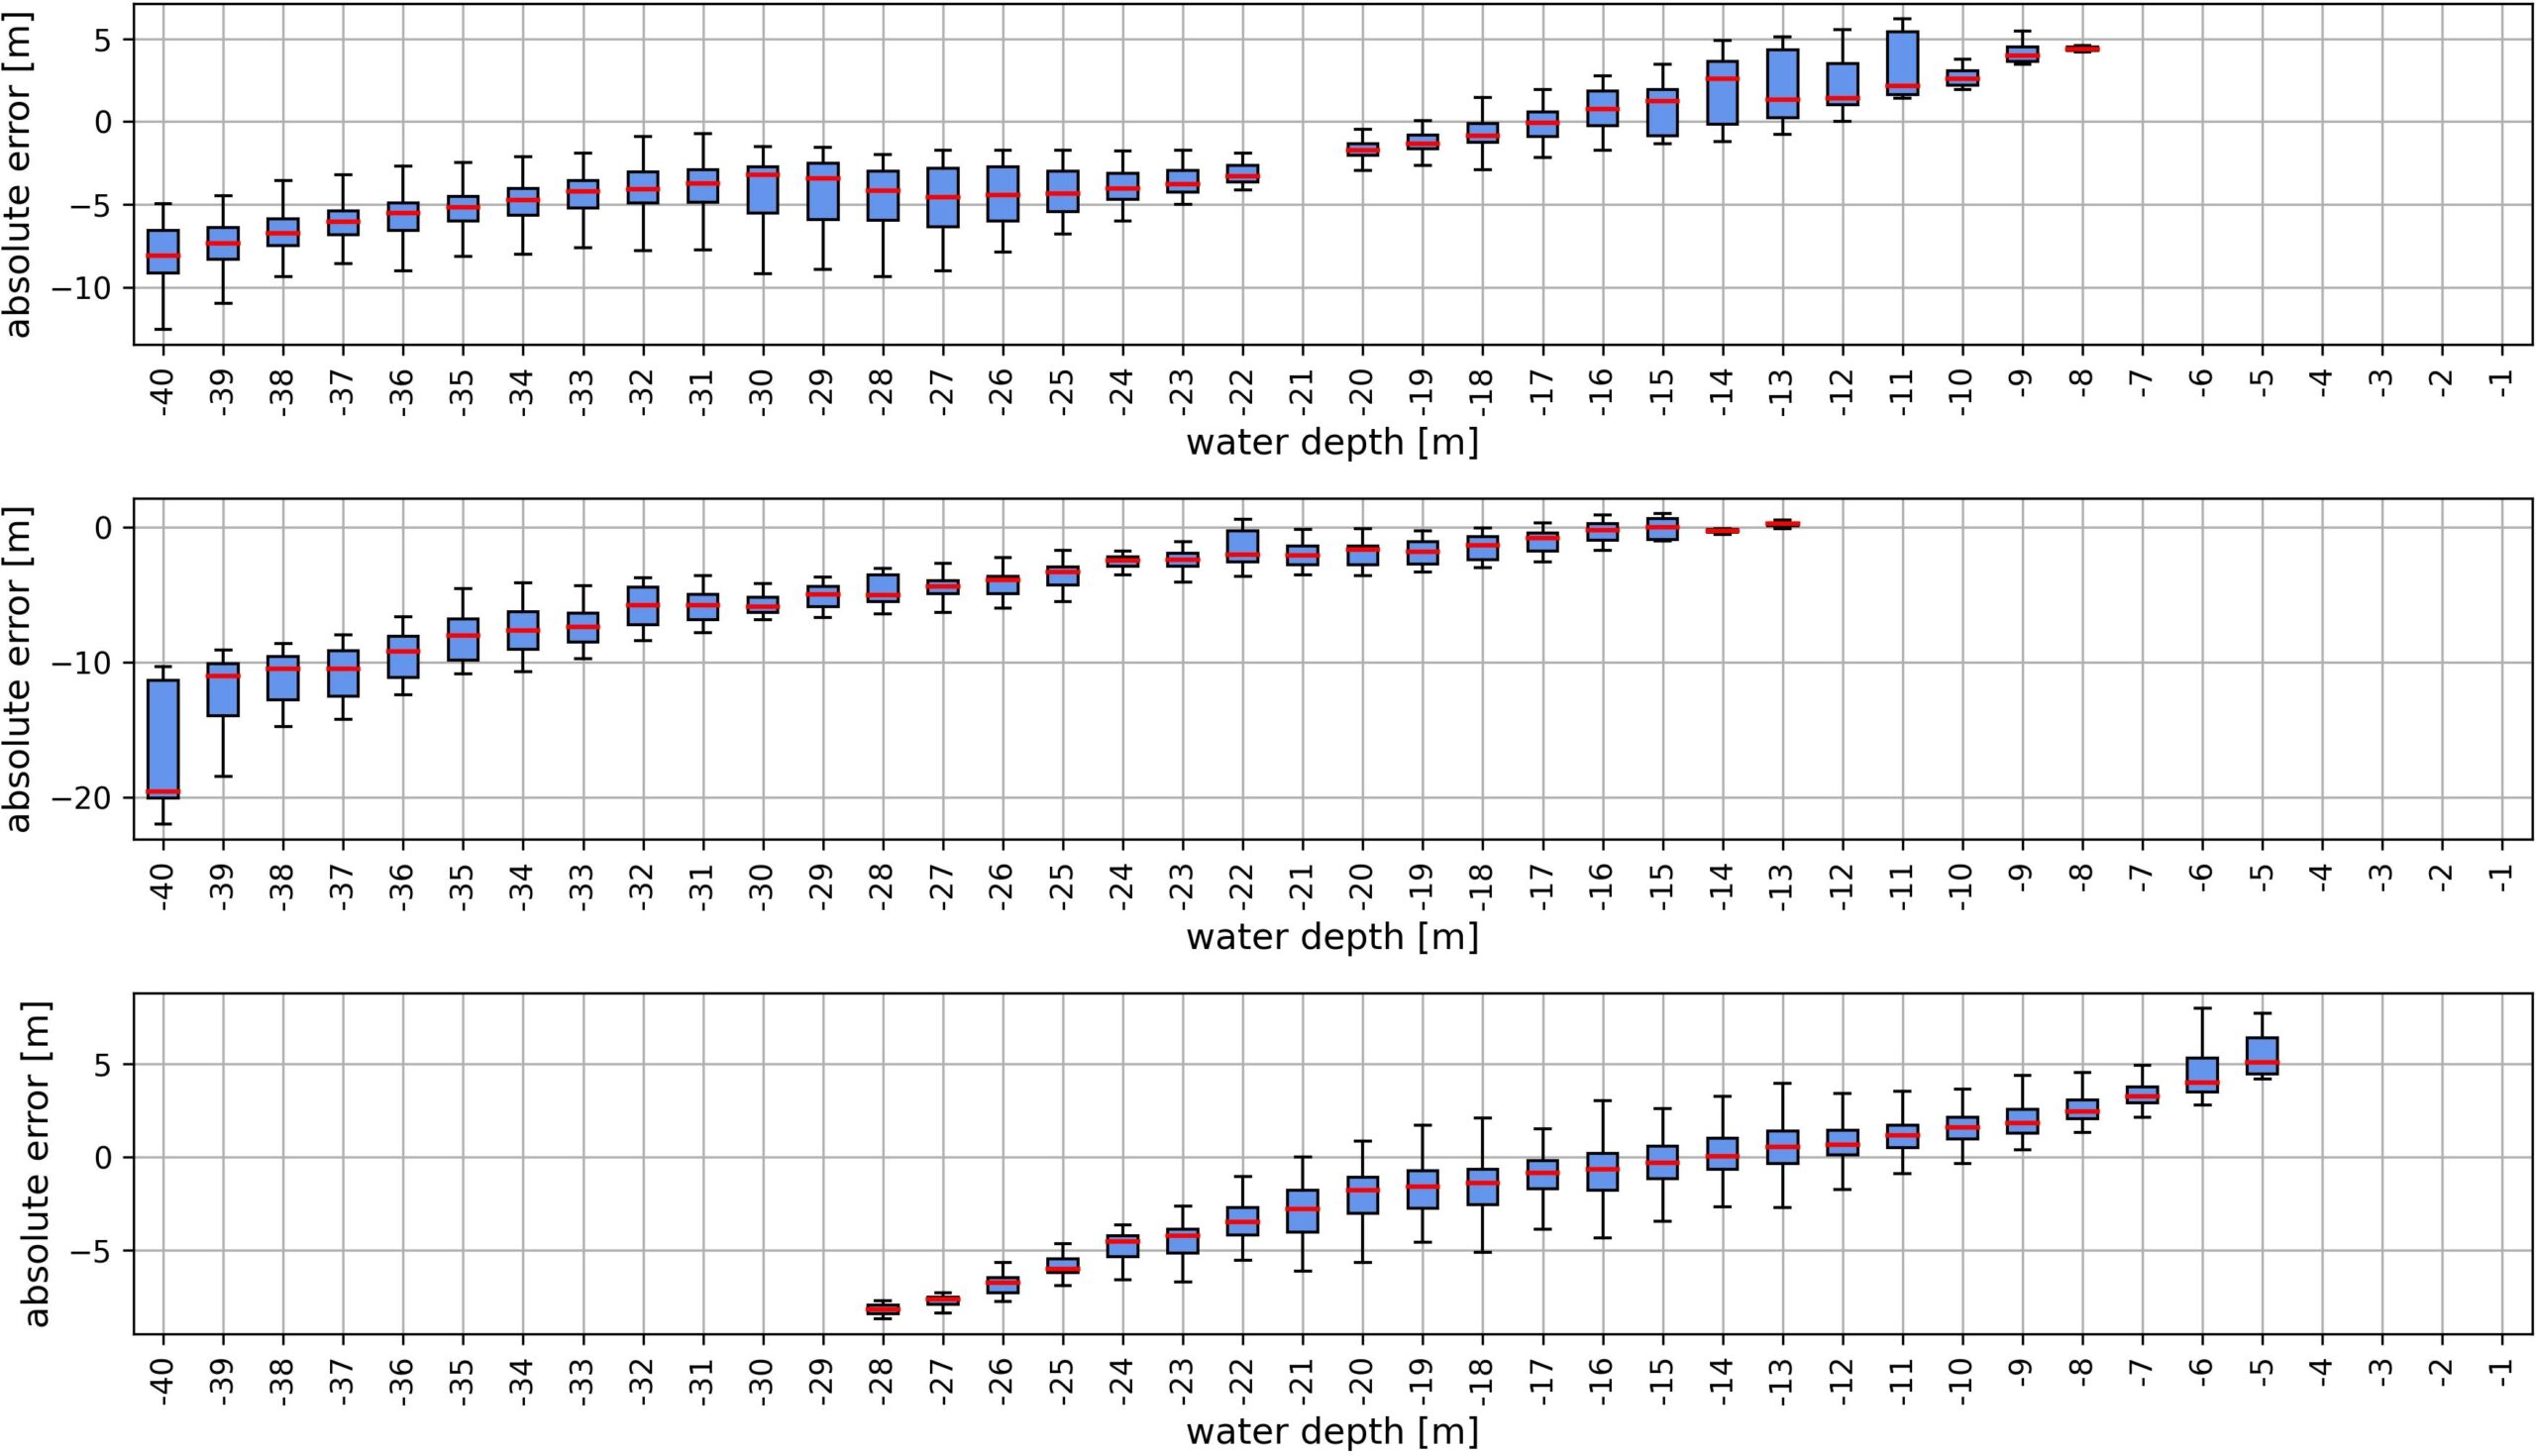
Fig. 8 indicates the vertical error reduction achieved through the post-processing workflow for the three sites, by comparing the validation of the raw and post-processed results. Noise is significantly reduced in all three sites, resulting in point clouds that align more closely with the 1:1 regression line. This automated workflow represents a significant advancement in streamlining bathymetric data generation and ensuring more reliable outputs. Fig. 9 shows that despite these substantial improvements, there remains a tendency to underestimate deeper depths. The mean error increases with the water depth. The absolute Mean Error values differ significantly across the study sites, highlighting the necessity for an area-dependent deep-water cut-off threshold.
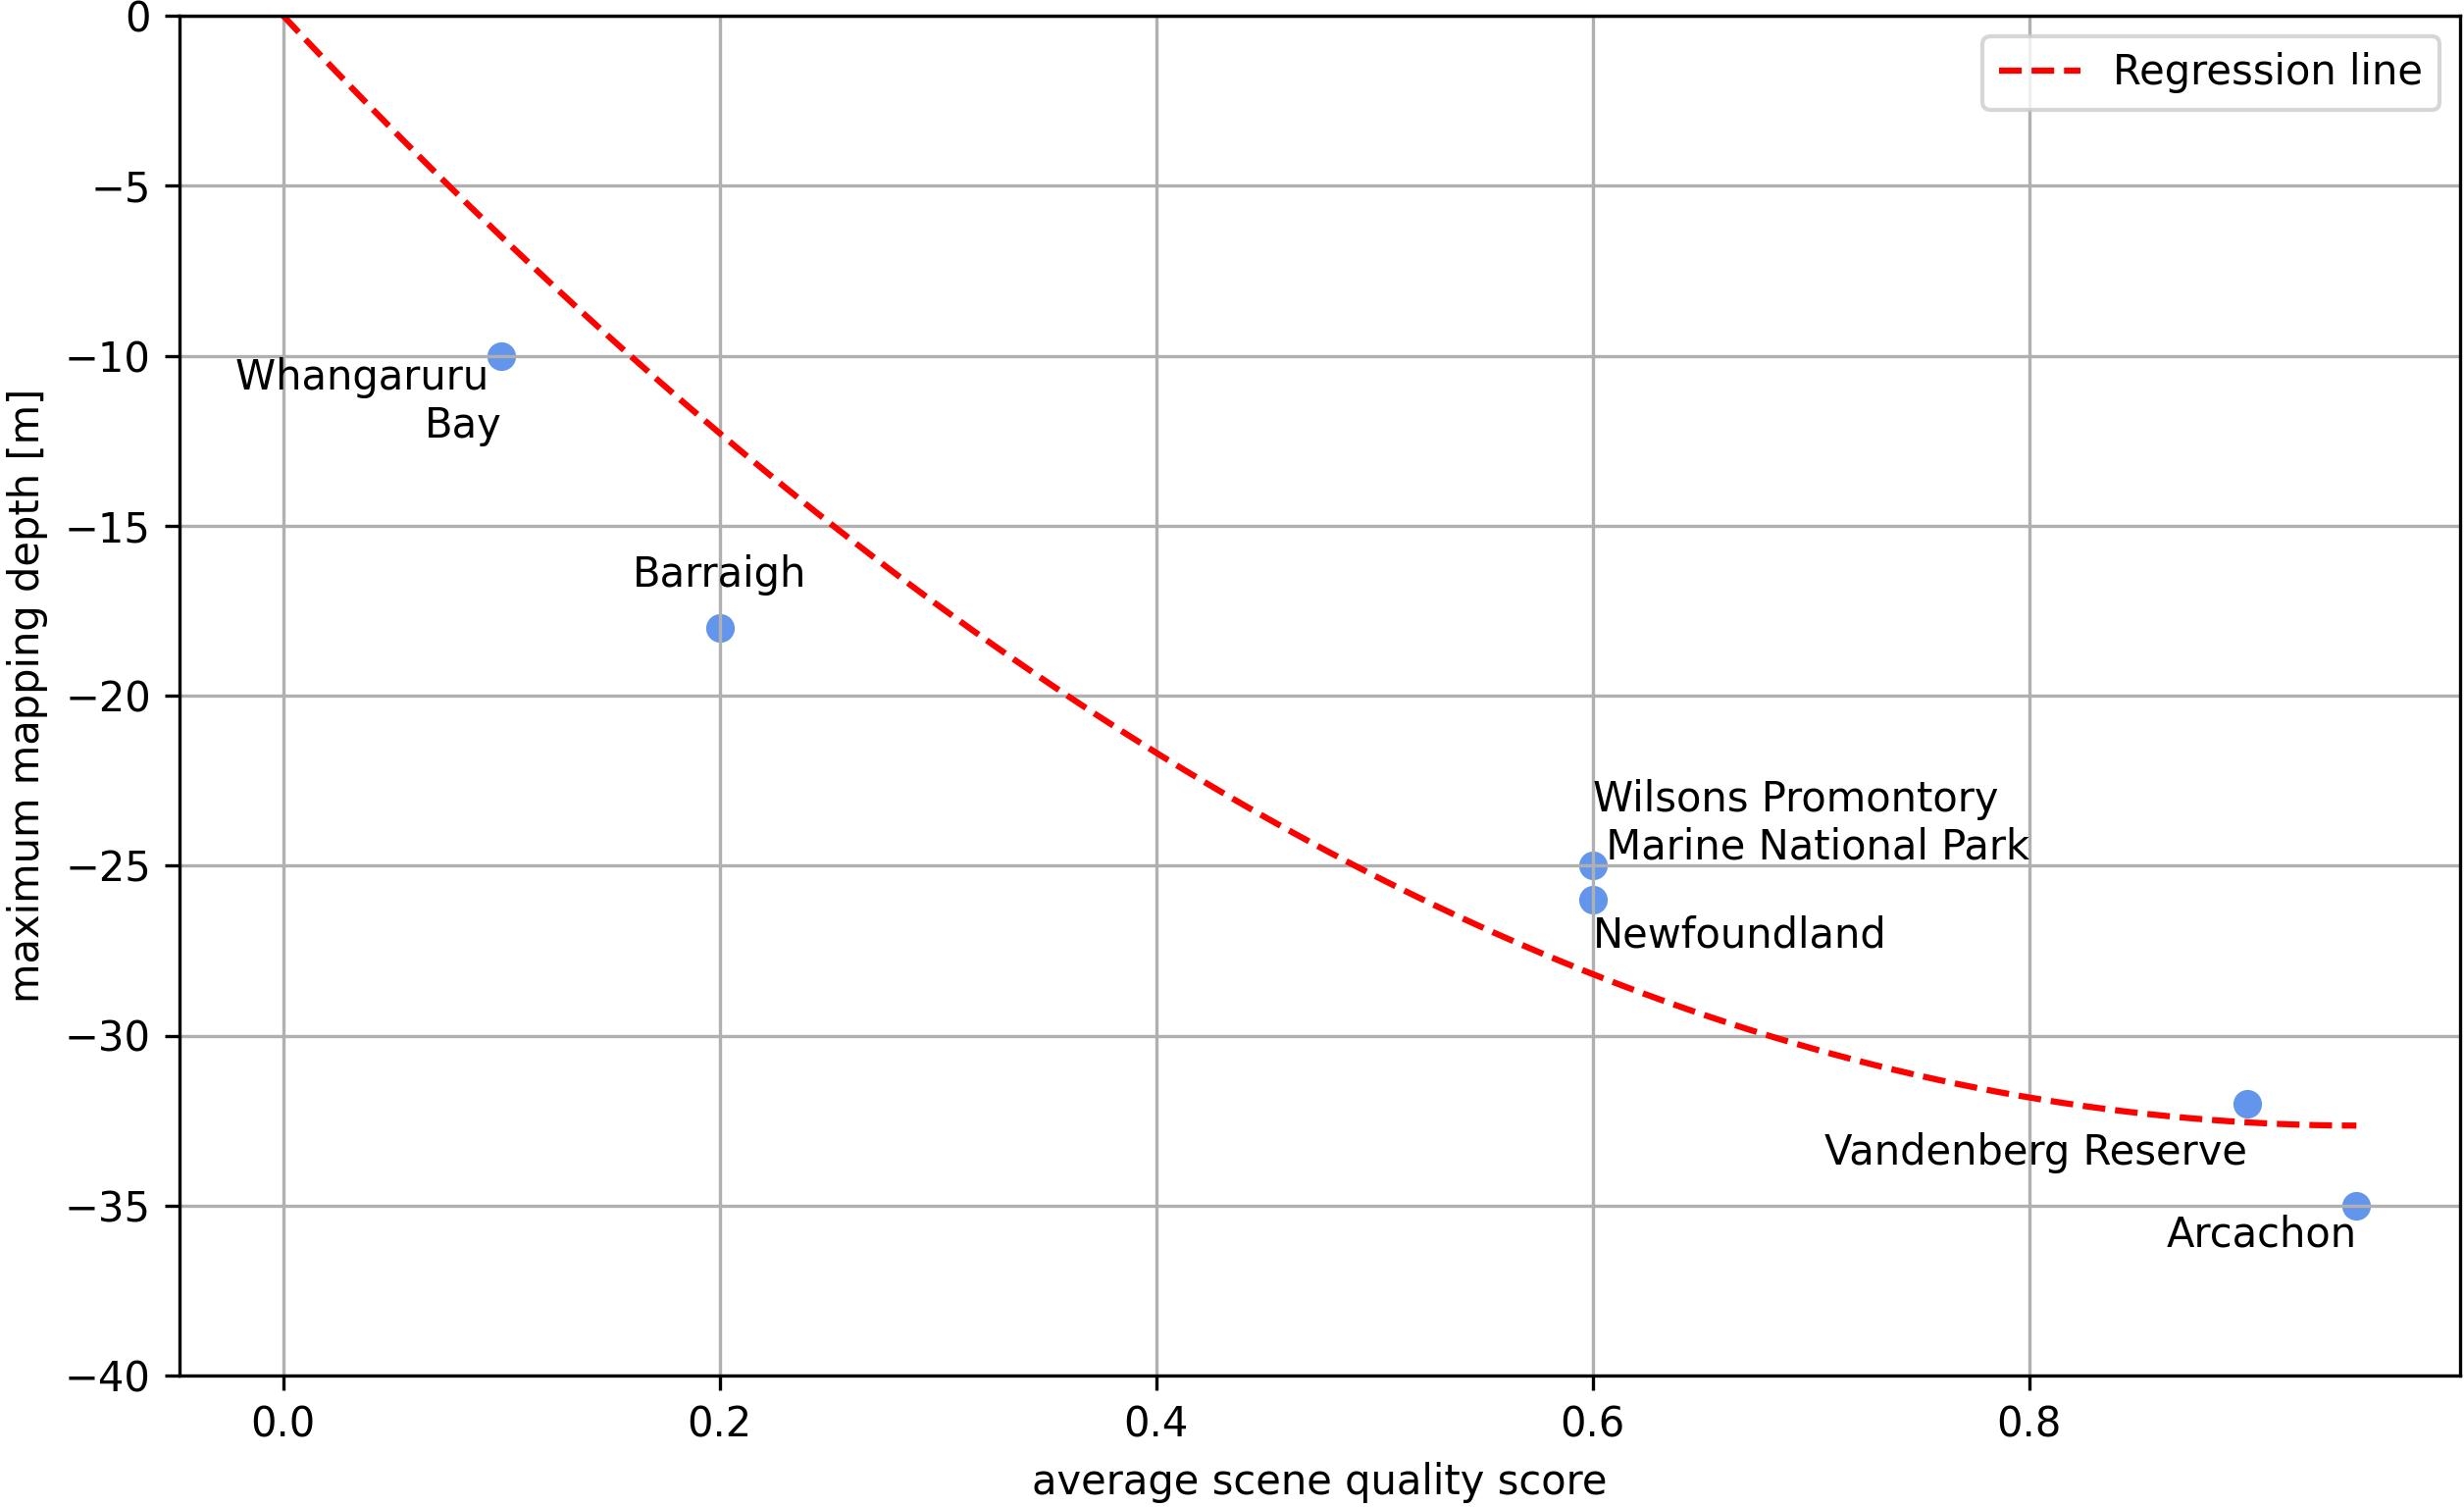
This maximum mapping depth was derived for the different study sites based on visual WKB interpretation by comparing chart data contour lines and the hydrographic survey data with the WKB results.
Fig. 10 shows the relationship between the visually derived maximum mapping depth and the average scene score quality. The area Ile Saint-Joseph, GF, is excluded, as it was not processed to the maximum mapping depth. This relationship allows for a further reduction of false positives in addition to the described post-processing steps. This integration of the automatically defined cut-off depth in the post-processing workflow, is crucial when scaling up the approach to the globe.
4 Discussion
In the following the results of this study and the potential of a global 100 m spatial resolution bathymetry derived from WKB methods are discussed and concluded.
4.1 Potential of 100 m WKB processing
This study demonstrates the improvements, results, performance, and accuracy of a fully automated and scalable WKB approach operating at a 100 m spatial resolution. The method leverages time lags between bands in multispectral Sentinel-2 satellite data, eliminating the need for locally adapted assumptions and calibration using pre-existing bathymetric data, which are often required in radar-based methods (Hennings, 1990; Wiehle et al., 2019). WKB is robust across various environmental conditions, including turbid waters and areas with extensive seafloor overprinting by flora and fauna, which typically change seafloor color and challenge optical SDB approaches (Hartmann et al. 2022). Introducing a sophisticated satellite scene quality score allows for systematically excluding unfeasible areas. This score provides a reliable proxy for the quality of the raw WKB results. Implementing the pixel-based quality score in a fully automatic post-processing routine significantly minimizes false positives, improving the results’ reliability.
The designed workflow, running on the AWS cloud environment, is fully scalable and capable of global application. The bathymetry outputs offer substantial potential for a range of applications, particularly in unmapped, difficult-to-access, and turbid regions. This data can be instrumental in survey planning, bridging existing data gaps, and serving as a robust foundation for numerical coastal flooding and hazard modeling. Ultimately, this data resource supports more accurate coastal assessments and informed decision-making in marine and environmental management.
4.2 Horizontal and vertical accuracies
The bathymetry results have a raster resolution of 100 m. However, due to the moving window approach with window sizes of 500–800 m, only coastal features with a few hundred meters extent such as sand bars and coastal reefs become visible in such data. The WKB approach is most stable for intermediate to shallow water depths, ranging from -5 m to -35 m. Very shallow water depths (shallower than –5 m) are more sensitive to errors in the derivation of the single wave parameters due to the increasing non-linearity of the wave approaching the shore. The quality score depicts this non-linearity. Combined with the post-processing approach, false positives are eliminated in very shallow waters. Data gaps in the very shallow waters can be covered, e.g., by the fully scalable, optical physics-based SDB approach, described by Hartmann et al. (2022). Overall, with WKB, errors increase in deeper waters. The maximum mapping depth depends strongly on the site-specific morphology and waves and shows a relationship to the average scene quality score. This relationship can be applied to automatically derive a site-specific cut-off threshold and to eliminate false positives in deeper waters.
4.3 Limitations
The primary limitation of this methodology is the necessity of the presence of waves. Areas without sufficient wave dynamics can be precluded from processing using parameters such as the average SWH, with a threshold of 1 m (Bell, 2008). This limitation mainly affects bays, waters sheltered by morphology (e.g., fjords, or between islands) and shallow areas on reefs. By excluding these unfeasible areas prior to processing, the method ensures efficient and effective application of resources. Water depths can be calculated using WKB processing independent of water clarity, vegetation, or seafloor darkness. However, vertical uncertainties are typically higher in clear waters compared to optical approaches, especially the physics-based optical SDB method (Hartmann et al. 2022). Furthermore, this workflow does not cover very shallow areas. Therefore, a combination of WKB and physics-based optical SDB is considered to enhance overall accuracy and coverage.
4.4 Scalability and global applicability of WKB
By integrating all the methods described, a fully automated WKB workflow is achieved. The deployment on the AWS Cloud enables up to a 1,000-fold parallelization of computations, making the workflow fully scalable.
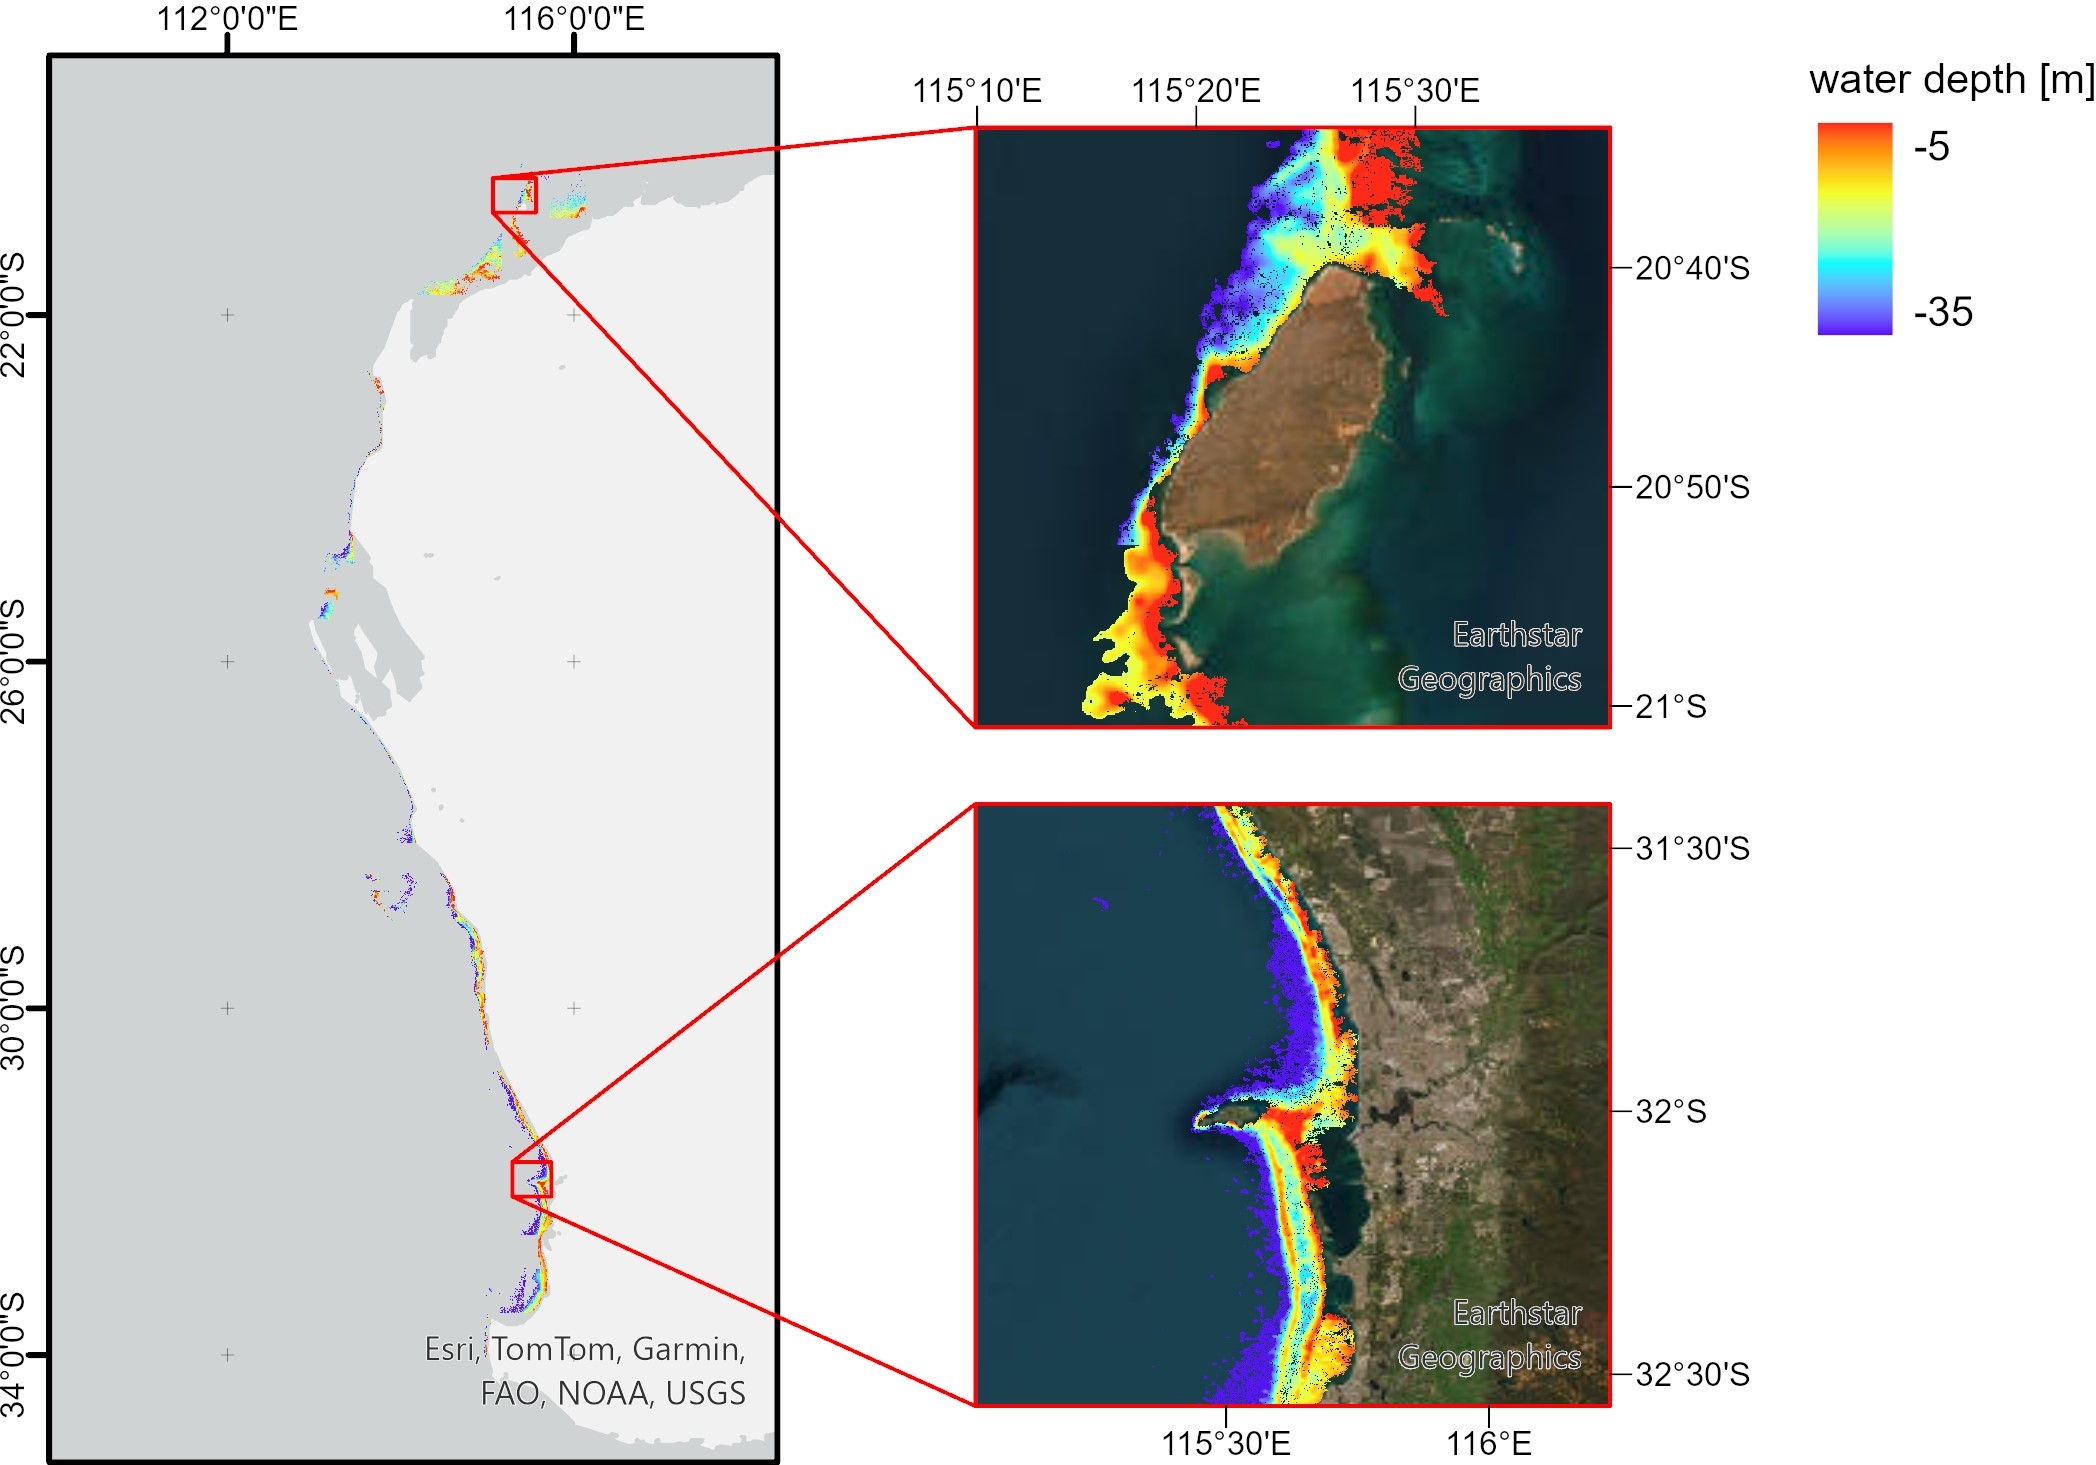
To showcase the degree of automation and scalability, the full scene selection, WKB processing and post-processing workflow were executed along the entire west coast of Australia. This was completed within two hours (parallelized on 300 docker containers), without any manual data manipulation, demonstrating the method’s robustness and efficiency. The result, depicted in Fig. 11, encompasses over 9,900 km² of data in a highly dynamic environment. The bathymetry was fully processed and post-processed within 90 min, further reinforcing the efficiency of the WKB process.
Given the full automation and scalability of this workflow, the 100 m WKB process holds substantial potential for achieving global coastal bathymetry coverage. This is particularly valuable for providing data for previously unmapped areas.
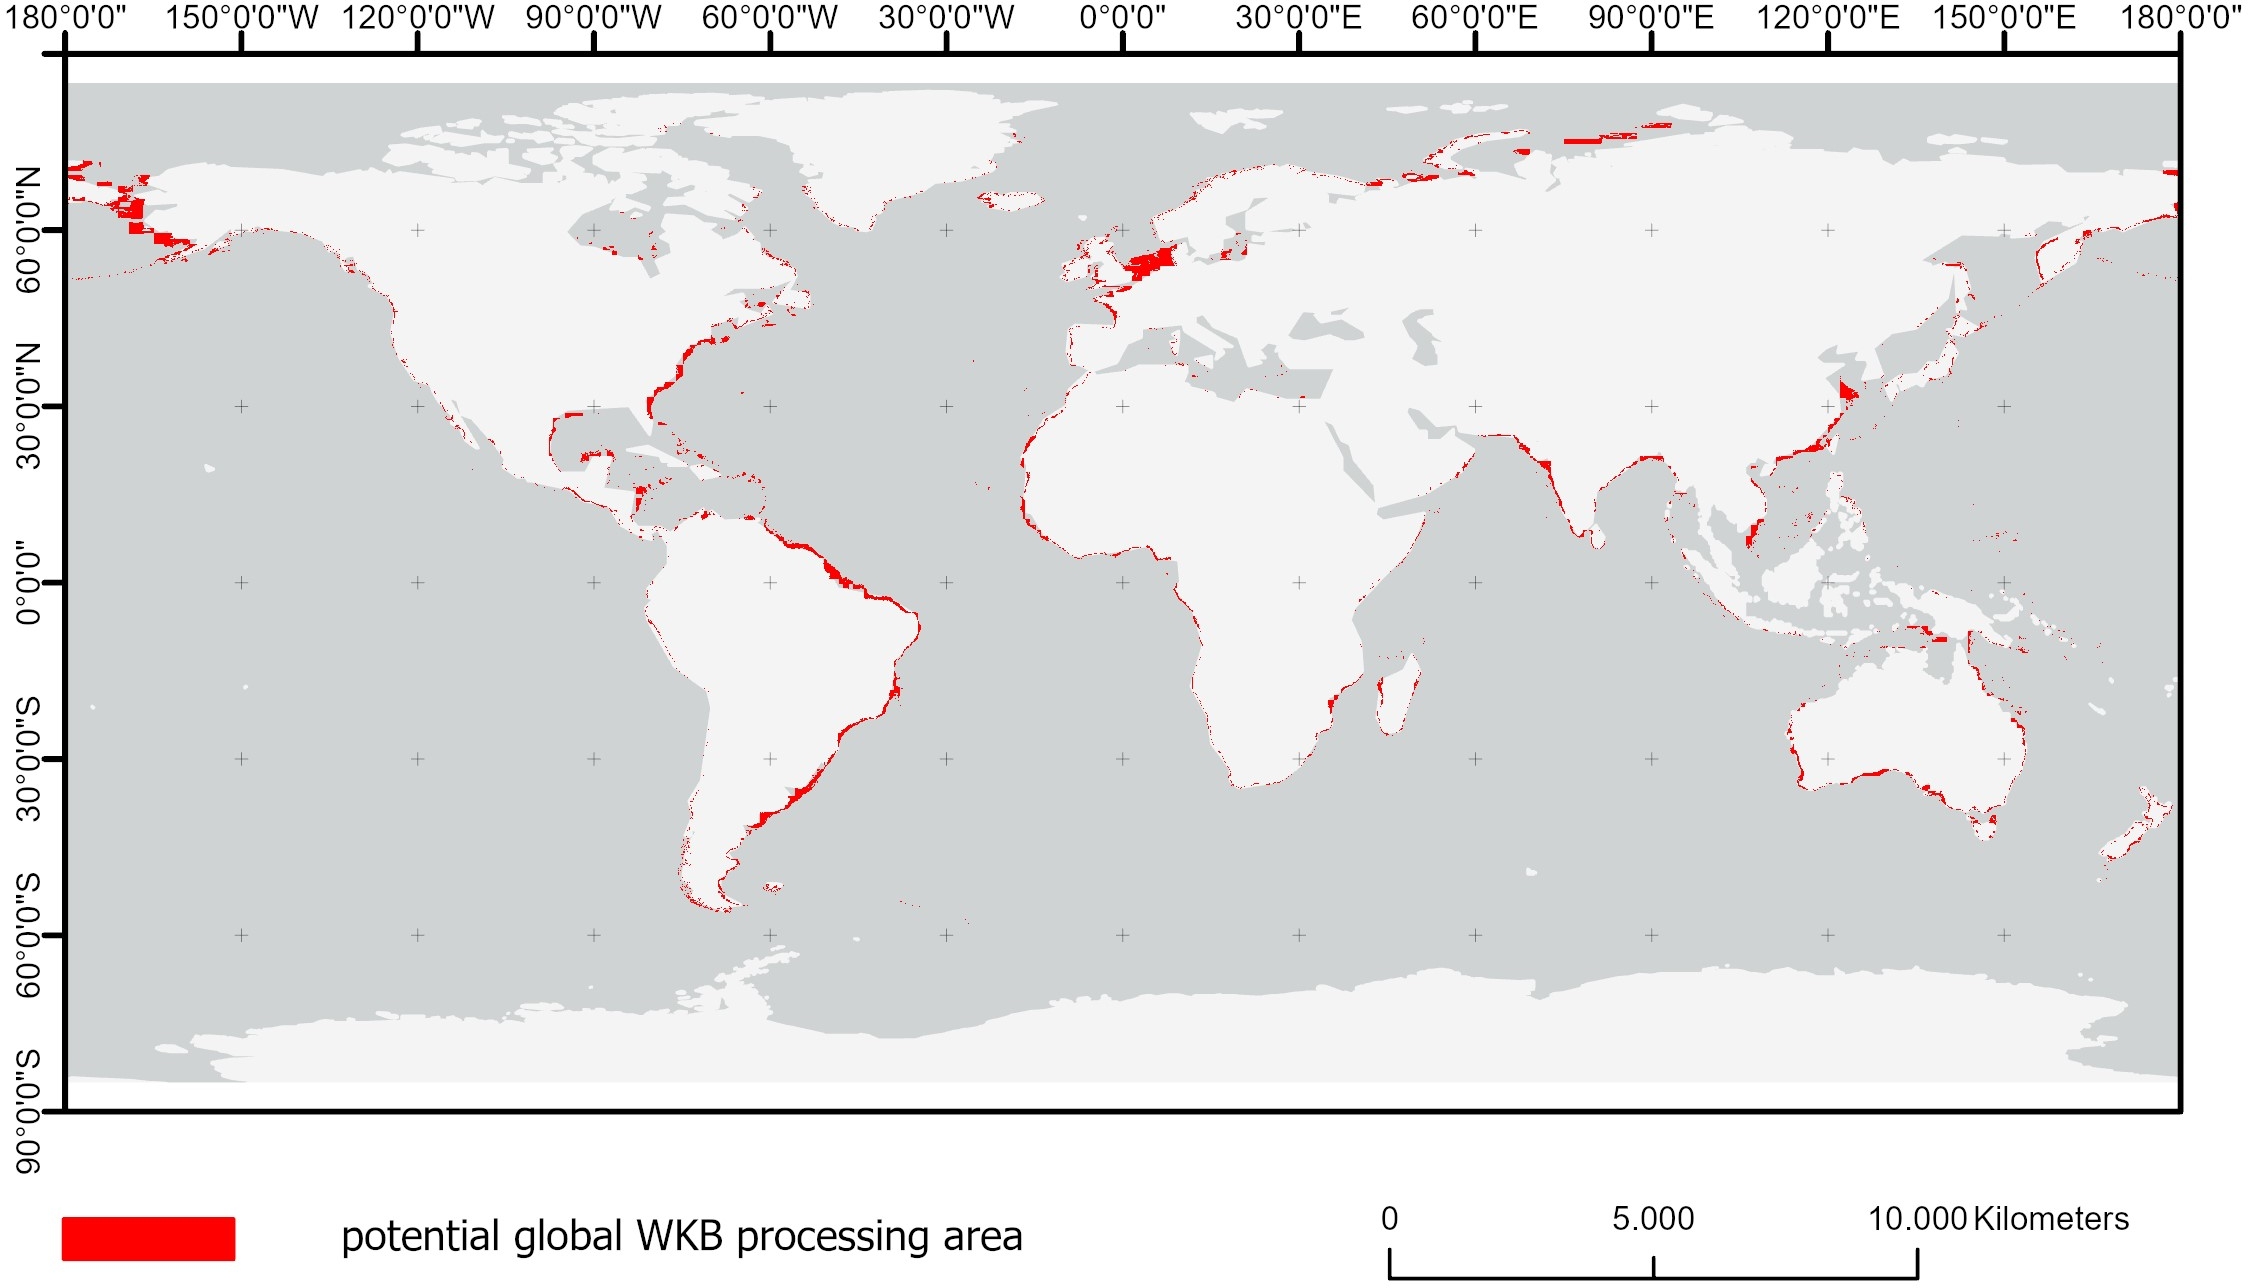
Fig. 12 illustrates the estimated global feasible WKB area based on the GEBCO 2024 bathymetry –50 m contour line, excluding reefs and atolls and regions with an average SWH of less than 1 m. Validation of a global data set can be carried out on a global scale or sample based. Validation against global data includes soundings of nautical charts (which need to be licensed) and the GEBCO bathymetry layer. Sample-based validation can be carried out for single sites, using the bathymetry points of the green active LiDAR IceSat-2 satellite in clear waters and the available hydrographic survey data in turbid waters. The processing of this global WKB dataset is already in progress and will support a wide range of applications, from survey planning to coastal hydrodynamic modeling (Gawehn et al., 2022).
4.5 Applications
The spatial resolution, depth coverage and uncertainties of the WKB model define its potential use for coastal applications. While the spatial resolution and uncertainties will forbid its use in nautical charting of safety of navigation it is of value for regional to global hydrodynamic models. This value is especially high when other bathymetric data do not exist, are not available or are interpolated. Its spatial resolution aligns with the Nippon Foundation-GEBCO Seabed 2030 Project, which aims to provide a global 100m bathymetry grid by 2030. It also supports the objective of Copernicus Marine to potentially include this dataset in the European Copernicus Marine Service. The latter funds this research and upscaling and the final datasets are aimed to be released in the data portal and contribute to Seabed2030 and the global GEBCO datasets.
5 Conclusion and outlook
This study successfully demonstrates the full automation and scalability of a standardized and harmonized WKB workflow, encompassing satellite scene selection, WKB processing, and post-processing at a 100 m spatial resolution. We identified a scene quality score as a reliable proxy for WKB result quality. This quality score is the basis of the new and effective satellite scene selection approach, enabling a feasibility analysis before processing. The WKB processing was improved by taking multiple peaks of the Fourier spectrum into account, making results more robust. Incorporating advanced fully automatic post-processing mechanisms significantly improved the accuracy of results, minimizing errors and false positives in very shallow and very deep waters. The degree of automation and scalability was showcased on a regional basis but enables the extension of this method globally, which is already ongoing. A comprehensive global WKB dataset will substantially enhance the utility of the SDB dataset for coastal applications like survey planning or hazard modeling. It will provide critical bathymetric insights in areas currently lacking data. WKB-derived data still falls short in accuracy when compared to optical physics-based SDB methods in shallow waters. Therefore, integrating WKB with optical physics-based techniques has the potential to harness the strengths of both methods, thereby minimizing their individual limitations and achieving the best possible global coverage and accuracy.
While this study focused on developing a fully automated and scalable WKB approach to derive one WKB dataset, it did not explore the applicability for monitoring areas characterized by high seabed dynamics. Investigating WKB’s monitoring capabilities in such dynamic environments could significantly enhance our understanding of coastal processes and dynamics. This, in turn, would support more effective coastal management strategies, ultimately strengthening coastal resilience in the face of environmental changes.
Acknowledgements
This work has been carried out as part of a Copernicus Marine Service contract. Copernicus Marine Service is implemented by Mercator Ocean in the framework of a contribution agreement with the European Union.
References
Almar, R., Bergsma, E. W. J., Maisongrande, P. and Pedro Melo de Almeida, L. (2019). Wave-derived coastal bathymetry from satellite video imagery: A showcase with Pleiades persistent mode. Remote Sensing of Environment, 231, p. 111263.
Almar, R., Bergsma, E. W. J., Thoumyre, G., Solange, L. C., Loyer, S., Artigues, S., Salles, G., Garlan, T. and Lifermann, A. (2024). Satellite-derived bathymetry from correlation of Sentinel-2 spectral bands to derive wave kinematics: Qualification of Sentinel-2 S2Shores estimates with hydrographic standards. Coastal Engineering, 189, p. 104458.
Almar, R., Bergsma, E. W. J., Thoumyre, G., Baba, M. W., Cesbron, G., Daly, C., Garlan, T. and Lifermann, A. (2021). Global Satellite-Based Coastal Bathymetry from Waves. Remote Sensing, 13(22), p. 4628.
Bell, P. S. (2001). Determination of bathymetry using marine radar images of waves. The Fourth International Symposium on Ocean Wave Measurement and Analysis, pp. 241–257. San Francisco, USA.
Bell, P. S. (2008). Mapping shallow water coastal areas using a standard marine x-band radar. Hydro8 Conference. International Federation of Hydrographic Societies, Liverpool.
Bergsma, E. W. J., Almar, R. and Maisongrande, P. (2019). Radon-Augmented Sentinel-2 Satellite Imagery to Derive Wave-Patterns and Regional Bathymetry. Remote Sensing, 11(16), p. 1918.
Chénier, R., Faucher, M.-A., Ahola, R., Shelat, Y. and Sagram, M. (2018). Bathymetric Photogrammetry to Update CHS Charts: Comparing Conventional 3D Manual and Automatic Approaches. International Journal of Geo-Information, 7(10), p. 395.
Copernicus (2023a). Global Ocean Colour (Copernicus-GlobColour), Bio-Geo-Chemical, L3 (daily) from Satellite Observations (Near Real Time). Copernicus Marine Service, European Union. https://data.marine.copernicus.eu/product/OCEANCOLOUR_GLO_BGC_L3_NRT_009_101/description (accessed 15 August 2024).
Copernicus (2023b). Global Ocean Waves Reanalysis. Copernicus Marine Service, European Union. https://data.marine.copernicus.eu/product/GLOBAL_MULTIYEAR_WAV_001_032/description (accessed 15 August 2024).
Danilo, C. and Binet, R. (2013). Bathymetry estimation from wave motion with optical imagery: influence of acquisition parameters. 2013 MTS/IEEE OCEANS – Bergen, Bergen, Norway, pp. 1–5. https://doi.org/10.1109/OCEANS-Bergen.2013.6608068
Delay, C., Baba, W., Bergsma, E., Thoumyre, G., Almar, R. and Garlan, T. (2022). The New Era of Regional Coastal Bathymetry from Space: A Showcase for West Africa using Sentinel-2 Imagery. Remote Sensing of Environment, 278, p. 113084.
ESA (2024). S2 Mission – Overview of Sentinel-2 Mission. SentiWiki, European Space Agency. https://sentiwiki.copernicus.eu/web/s2-mission (accessed 7 September 2024).
Gawehn, M., Almar, R., Bergsma, E. W. J. and De Vries, S. (2022). Depth Inversion from Wave Frequencies in Temporally Augmented Satellite Video. Remote Sensing, 14, p. 1847.
Hartmann, K., Reithmeier, M., Knauer, K., Wenzel, J., Kleih, C., Heege, T. (2022). Satellite-Derived Bathymetry Online. The International Hydrographic Review, 30(1), pp. 53–75. https://doi.org/10.58440/ihr-28-a14
Hennings, I. (1990). Radar Imaging of Submarine Sand Waves in Tidal Channels. Journal of Geophysical Research, 95(C6), pp. 9713–9721.
Holthuijsen, L. H. (2007). Waves in Oceanic and Coastal Waters. Camebridge University Press, Camebridge.
IHO (2022). Standards for Hydrographic Surveys (6th ed.). IHO Special Publication S-44, International Hydrographic Organization, Monaco. https://iho.int/uploads/user/pubs/standards/s-44/S-44_Edition_6.1.0.pdf (accessed 14 September 2024).
IHO (2024). Satellite-Derived Bathymetry Best Practice Guide (1st ed.). IHO Publication B-13, International Hydrographic Organization, Monaco. https://iho.int/uploads/user/pubs/bathy/B_13_Ed100_032024.pdf (accessed 6 September 2024).
Kisselev, V. and Bulgarelli, B. (2004). Reflection of light from a rough water surface in numerical methods for solving the radiative transfer equation. Journal of Quantitative Spectroscopy and Radiative Transfer, 85(3), pp. 419-435.
Lyard, F. H., Allain, D. J., Cancet, M., Carrère, L., and Picot, N. (2021). FES2014 global ocean tide atlas: design and performance. Ocean Science, 17(3), pp. 615–649.
Lyzenga, D. R., Malinas, N. P. and Tanis, F. J. (2006). Multispectral bathymetry using a simple physically based algorithm. IEEE Transactions on Geoscience and Remote Sensing, 44(8), pp. 2251–2259.
Mayer, L., Jakobsson, M., Allen, G., Dorschel, B., Falconer, R., Ferrini, V., Lamarche, G., Snaith, H. and Weatherall, P. (2018). The Nippon Foundation—GEBCO Seabed 2030 Project: The Quest to See the World’s Oceans Completely Mapped by 2030. Geosciences, 8(2), p. 63.
Niederjasper, M. (2020). Satellite-derived bathymetry in practice. Hydrographische Nachrichten – Journal of Applied Hydrography, 116, pp. 40–47. https://doi.org/10.58440/10.23784/HN116-06
Pleskachevsky, A., Lehner, S., Heege, T. and Mott Claudius (2011). Synergy and fusion of optical and synthetic aperture radar satellite data for underwater topography estimation in coastal areas. Ocean Dynamics, 61, pp. 2099–2120.
Simarro, G., Calvete, D., Luque, P., Orfila, A., Ribas, F. (2019). UBathy: A New Approach for Bathymetric Inversion from Video Imagery. Remote Sensing, 11(23), 2722.
Small, C. and Nicholls, R. J. (2003). A Global Analysis of Human Settlement in Coastal Zones. Journal of Coastal Research, 19(3), pp. 584–599.
Stumpf, R. P., Holderied, K. and Sinclair, M. (2003). Determination of Water Depth with High-Resolution Satellite Imagery over Variable Bottom Types. Limnology and Oceanography, 48(1part2), pp. 547–556.
Syvitski, J. P., Harvey, N., Wolanski, E., Burnett, W. C., Perillo, G. M. E. and Gornitz, V. (2005). Dynamics of the Coastal Zone. In C. J. Crossland, H. H. Kremer, H. J. Lindeboom, J. I. Marshall Crossland and M. D. A. Le Tissier (Eds.), Coastal Fluxes in the Anthropocene. Global Change — The IGBP Series. Springer, Berlin, Heidelberg.
Wessel, P., Bercovici, D. (1998). Interpolation with Splines in Tension: A Green’s Function Approach. Mathematical Geology, 30(1), pp. 77–93.
Wiehle, S., Pleskachevsky, A. and Gebhardt, C. (2019). Automatic bathymetry retrieval from SAR images. CEAS Space Journal, 11(5), pp. 105–114.
Young, I. R., Rosenthal, W. and Ziemer, F. (1985). A three-dimensional analysis of marine radar images for the determination of ocean wave directionality and surface currents. Journal of Geophysical Research, 90(C1), pp. 1049–1059.
Authors’ biographies

Mona Reithmeier is a Remote Sensing expert with extensive experience in aquatic applications, data analysis, and product development. At EOMAP, she works as a project manager and EO data analyst for global mapping projects, specializing in Satellite-Derived Bathymetry (SDB) and Seafloor Classification (SFC). She also manages product development and go-to-market strategies for WebApps SDB-Online and COASTS, which support stakeholders in their decision-making for coastal projects. Mona holds an MSc in Physical Geography from the Ludwig-Maximilians University Munich and joined EOMAP in 2021.

Dr. Ingo Laut is senior researcher and the EOMAP R&D department. He holds a PhD and Msc. in physics from the University of Munich and worked at the German Aerospace Centre (DLR) and the Max Planck Society in the fields of data analytics, time series analysis and numerical simulations. Since 2022 Ingo works at EOMAP and is – amongst others – responsible for the analytical process to derive bathymetry from EO using wave kinematics approach.

Matthijs Gawehn, MSc, PhD, earned his degrees in Hydraulic Engineering with a specialization in Coastal Engineering from Delft University of Technology. Since 2015, he has been with the Applied Morphodynamics department at Deltares, focusing on coastal hydrodynamics and morphodynamics data analysis. His publications cover topics such as very-low frequency wave analysis at coral reefs and coastal bathymetry estimation using various optical imagery sources, including XBand radars, drones, fixed cameras, and satellites.

Christoph Kleih is a senior software developer and works at EOMAP’s IT department since 2009 as software engineer. He has profound knowledge in Software development, geoinformatics and IT infrastructure. Between 2015 and 2020 he worked in projects for companies in the automotive and in the medical sector. At EOMAP he was involved in developing the core workflow systems for automated processing and transformed that to cloud-based web applications.

Dr. Jens Schneider von Deimling is a senior scientist and lecturer at the Institute of Geosciences at Kiel University, Germany, in the department of Marine Geophysics and Hydroacoustics. His work bridges gaps between hydrography and habitat mapping and his research focuses on seafloor mapping combining optics and experimental hydroacoustic methods. Dr. Schneider von Deimling has spent more than 600 days at sea and led many cruises and research projects. In addition to intensive scientific collaboration, he works closely together with hydroacoustic system manufacturers, authorities and surveyors. Dr. Schneider von Deimling supports international and national hydrographic societies, e.g. via his former vice-presidency of the German Hydrographic Society (www.dhyg.de) and now as an active member of the international GEOHAB Backscatter Working Group (https://geohab.org/backscatter-working-group/).He was recently coordinating the multinational EU habitat mapping project ECOMAP (www.bonus-ecomap.eu).

Dr. Knut Hartmann leads EOMAP’s coastal team, where he is responsible for delivering geospatial data and IT solutions. He holds the position of Chief Operating Officer (COO). His technical expertise lies in business and technology development and remote sensing and geospatial innovations, with a special emphasis on coastal and aquatic environments. Knut has received academic awards for excellence, served as an expert advisor for Earth Observation in the International Law of the Sea (ITLOS) court case, chairs the Satellite-Derived Bathymetry Best Practice Project Team (SDBPT) – a supporting body of the International Hydrographic Office (IHO)’s Hydrographic Surveys Working Group (HSWG) –, and is a member of the UK and Ireland Hydrographic Society as well as the German Hydrographic Society.