

Abstract
1 Introduction
According to the Nippon Foundation-GEBCO Seabed 2030 Project, approximately 74 % of the world’s oceans remain unmapped (Seabed 2030 Project, 2024). With limited worldwide resources to fill these gaps, Hydrographic Offices (HOs), private industry, and educational institutions are trying to find novel ways to collect and process data to augment traditional mapping. One option is the use of Volunteered Bathymetric Information (VBI), commonly called Crowdsourced Bathymetry (CSB; Jencks & Chappell, 2018). VBI is data that is supplied to an HO from an outside source (Calder, 2021). The capabilities of these sources range from those with survey-grade equipment to data collected with standard navigational sonar systems. This disparity in capability necessitates rigorous data quality analysis to determine the viability of data from each contributor.
A large amount of VBI data is publicly available in the International Hydrographic Organization (IHO) Data Centre for Digital Bathymetry (DCDB; Jencks & Chappell, 2018). Data stored in the DCDB CSB database were collected by contributors using vessel navigational sonar and positioning equipment during normal maritime operations (IHO, 2022a). Determining the quality of this data is difficult and time consuming using traditional methods due to a general lack of metadata, limiting its current use. Many HOs agree that CSB has potential use in ocean mapping initiatives, but there is disagreement about its role because quality is so difficult to ascertain (Calder, 2021).
In 2021, a method of determining VBI contributor (and data) reputation by comparing it to authoritative data sources (vetted for charting or official use) was proposed (Calder, 2021). Additionally, a standardized processing method for CSB data has been developed for HOs (Klemm & Krabiel, 2023) by applying tide data and deriving sonar draft via authoritative data comparisons. Notably, both methods provide potential options for determining data quality through comparisons to authoritative data, but currently require manual discovery and data management, a time-consuming process prone to error. The advent of the IHO’s S-100 suite of specifications (IHO, 2022b) and the growing desire for more precise navigational and modeling tools is putting stress on the prevailing data pipelines. This necessitates the need for more time-efficient processes to allow additional data sources to be ingested.
The source of authoritative data used for VBI data comparisons depends on the needs of the HO employing the tool and should be based upon where and how their trusted data is stored. It could be a HO’s own database, or an external database containing data trusted to be the best available for the area it covers. In this case study, by way of example, data from the NOAA National Bathymetric Source (NBS; OCS, 2024) is used as it is the authoritative public data source for the United States Office of Coast Survey. Other authoritative data sources for different regions (e.g. NONNA in Canada (NONNA, 2022), EMODnet for the European Union (EMODnet, 2024), etc.) could equally be used with similar techniques.
In addition to requiring VBI data and coincident authoritative data, the Calder VBI reputation calculation requires a file management scheme that allows the necessary spatially coincident data to be stored and later retrieved for processing (Calder, 2021). Both local and cloud data storage and processing are possible for the execution of data quality calculations, however each has different input requirements. Additionally, file management is critical to ensure the intended data is used in calculations to ensure the greatest possible accuracy. Therefore, a successful file management tool must be flexible to allow for multiple processing options, be time-efficient and capable of evaluating the age and condition of selected files.
Similar to file management, different methods of reputation calculation are required depending upon whether the algorithm is deployed locally or in the cloud. A programmatic solution for file management and reputation calculation could make this workflow less cumbersome thus helping to promote VBI as a viable data source for HOs.
Presented here are semi-automated methods to discover and manage data necessary for VBI data comparisons from the DCDB and diverse authoritative databases. These methods are integrated into a program dubbed VBI Compare1. A case study is also described using NOAA’s National Bathymetric Source authoritative data and the DCDB CSB database to show how this semi-automated program compares to manual data discovery and management methods while demonstrating how it may be adopted by HOs to handle VBI in their areas of responsibility.
2 Databases
To compare VBI data to authoritative sources, the minimum set of VBI data attributes required includes location, depth, and observation time. Additional metadata may help increase accuracy and uncertainty estimation including, e.g., vessel offsets or sound speed profiles. These data are often managed differently, each with its own data storage, metadata and access methods; an approach to abstracting away these differences is therefore required. This section demonstrates an approach for DCDB and NBS as an illustration of how this could be done generally.
2.1 IHO Data Centre for Digital Bathymetry Database
According to the DCDB, their CSB database houses over 2.3 million linear nautical miles and 1 billion individual soundings of VBI data from all over the world (as of July 2024). These data sets have been standardized for metadata and format by trusted nodes prior to submission to the database (IHO, 2022a).
The DCDB has multiple ways to access the VBI data it houses. The first is a web map interface or a MapServer ArcGIS REST Service Application Programming Interface (API), which allows the user to select desired files geographically or by selected attributes then submit an asynchronous request to extract the data from the archive (DCDB, 2022). The user receives an email containing a download link to access the requested data in GeoJSON (GeoJSON, 2016) and Comma Separated Value (CSV) (Safranovich, 2005) format along with a limited amount of metadata in JSON format. The second access method is an Amazon Web Service (AWS) Simple Storage Service (S3) bucket (Amazon, 2023), or cloud object storage container, hosted by the NOAA Open Data Dissemination Program (NODD). The CSV-format data files in this cloud-hosted resource are organized by year/month/day which makes it convenient to programmatically download data within a given date range but more challenging when searching for files by geographic area of interest or other attributes. The third access method is a new Pointstore API (Pointstore-API, 2024)2. This API, while still in testing, allows the user to query the archive of soundings as a seamless virtual collection of data, i.e. without concern for which files contain the data of interest. Filter criteria include geographic envelope, platform, date, etc. The API uses an asynchronous request model and REST-style HTTP queries to POST a new request and GET the status (and download URL) of an existing request. The user will also be notified via email when a download package is available but all interaction can be handled programmatically. Data are in CSV format and the user can optionally request a gridded output of the data as well.
Regardless of which service is used, the files delivered contain depths, time, and location along with other metadata, satisfying the requirements of the VBI Comparison algorithm. The Web MapServer does not allow for direct download of the files it contains. When using this service, the user must supply an email address to receive a message containing a File Transfer Protocol (FTP) URL for local file downloads, making it difficult to automate. On the other hand, the S3 bucket does allow for file downloads or collection of URLs pointing directly to the data in the bucket itself. Currently, however there is no direct way to query the S3 bucket with geographic parameters or other attributes to determine the required data. A solution using the MapServer REST API to identify files and the S3 bucket to download them is outlined in Section 3.1.
2.2 National Bathymetric Source Database
The NBS S3 Bucket houses authoritative data in GeoTIFF format (OGC, 2019). The bucket contains a folder for each NBS tile area which contains the GeoTIFF and an associated XML file.
A difficulty in using NBS is that it uses its own tile tessellation convention, separate from that of the NOAA Marine Chart Division (MCD) electronic chart tiles used in navigation equipment. MCD uses a tile set at specific dimensions and resolutions that correspond to the areas, name, and characteristics of their Electronic Navigation Charts (ENCs). The tile scheme NBS uses has a different naming scheme and a wider range of resolution options. While many of the NBS tiles do line up with chart tiles geographically, they may be at a different, often finer, resolution. This disparity in naming conventions makes searching for specific NBS tiles based on a navigational chart name difficult. A mechanism for resolving this disparity is given in Section 3.1.
3 Programmatic data discovery methods
As described in Section 2, the schema and query methods of the databases required for VBI data comparison differ greatly which makes acquisition, visualization, and comparison of colocated datasets from each difficult and time consuming. Programmatic data discovery methods have been created to address each of these concerns allowing for semi-automated data processing.
3.1 Database selection and query
The DCDB S3 bucket contains the desired VBI data and access to it is relatively easy through downloading files from the bucket or direct access via S3 URL, making it the preferred database for obtaining VBI. Using the S3 bucket also allows for deployment of the reputation algorithm to the cloud, which could avoid data egress or copying charges if deployed in the same AWS region. To ease data querying, the REST API is used to enable programmatic search. The file names in the GeoJSON server and the S3 bucket are similar, so it is possible to use the API to determine the desired files and translate those file names to the S3 bucket naming convention to access them.
Similarly, easy access to NBS data stored in cloud object storage (i.e., AWS S3 bucket) makes it the preferred database for authoritative data. To overcome the aforementioned naming convention incompatibilities between ENC and NBS tiles, geographic area queries, based on the extent of the VBI for which authoritative data are needed, are executed against an index stored as a GeoPackage file (OGC, 2021) housed at the top level of the NBS S3 bucket. This file can be accessed directly in the S3 bucket and queried to yield the desired file names and URLs to the data stored in the bucket. The area used is obtained from the ENC charts of interest using a programmatic API query of the MCD ENC Rescheme Status database (OCS, 2022b). Alternatively, the GeoPackage file can be queried using a user defined area then subsequently searching for colocated VBI. While the NBS database only covers areas where NOAA has charting authority, using it for this case study shows how an authoritative database controlled by an HO can be used to compare DCDB CSB data to determine reputation and uncertainty.
3.2 Query visualization
The data held in the DCDB can be visualized online using a web map display 3 designed by the National Centers for Environmental Information (NCEI). This web map also allows for geographic area or point queries. However, the map display cannot be reliably used to programmatically download data and is not connected to the DCDB S3 bucket, making it a less useful option for visualizing all required data streams.
NBS data tiles can be visualized in NOAA’s nowCOAST suite (OCS, 2023), but nowCOAST does not have the capability to query the NBS tile set by a user-defined area, nor can it access the data in the S3 bucket. An alternative option is the GeoPackage file in the NBS S3 bucket. As described previously, this file can be used to query the NBS database, but it requires a separate geographic information system (GIS) software to open for visualization purposes.
Therefore, although both data sets have visualization methods, neither of them allows for the visualization of both datasets simultaneously. This inability is consequently addressed using a GIS monitoring window built into VBI Compare. The map display is the primary data visualization tool showing how many files were collected and their geographic location, allowing the user to confirm that the data extracted covers the area of interest and that the datasets are colocated.
3.3 Data integration
Collection of each individual data type from its respective database is possible programmatically. To execute a reputation calculation, both data sets are required. Further, for a calculation to be completed both data sets must be colocated. This necessitates a query of one database using the results of the other. While these databases and files are diverse as described previously, they both use the World Geodetic System of 1984 (WGS 84; NGA, 2022) geographic coordinate reference system both within the data files themselves and the query interfaces, making geographic queries possible across databases. In VBI Compare, regardless of how the first database is searched, whether by specific chart or vessel or by geographic area, the second database is queried using the geographic extent of the first.
3.4 Executing VBI comparisons
Comparison between VBI and authoritative data is conducted in a batch computation using an index file of local storage locations or URLs for the affected files. The outputs are saved to a local directory tree structure and a Fig. showing reputation score as a function of transit time is created. Access to the discovered files requires a local download or internet connectivity for cloud data. A programmatically constructed directory tree structure ensures the desired files are supplied to the calculation algorithm each time it is executed.
Two directory structures were considered in developing VBI Compare. The first was to collect all the files discovered by each query into one central directory built per run of VBI Compare. The second option was to construct a directory tree that houses the files corresponding to a specific tile or vessel in a separate directory for each along with index files detailing their locations. The second method provides a local cache, thereby minimizing local storage and maximizing reuse, improving performance thus making it the preferred directory structure.
In the cloud, for efficiency, processing is done through accessing the data directly in the database where it resides. This method is faster and may lead to cost savings because data egress fees are reduced over local downloads. Access via S3 URLs is more efficient for the VBI comparison algorithm as only segments of the GeoTIFF authoritative data that are coincident with VBI need to be downloaded rather than entire files and is therefore preferred in this example.
4 Implementation architecture
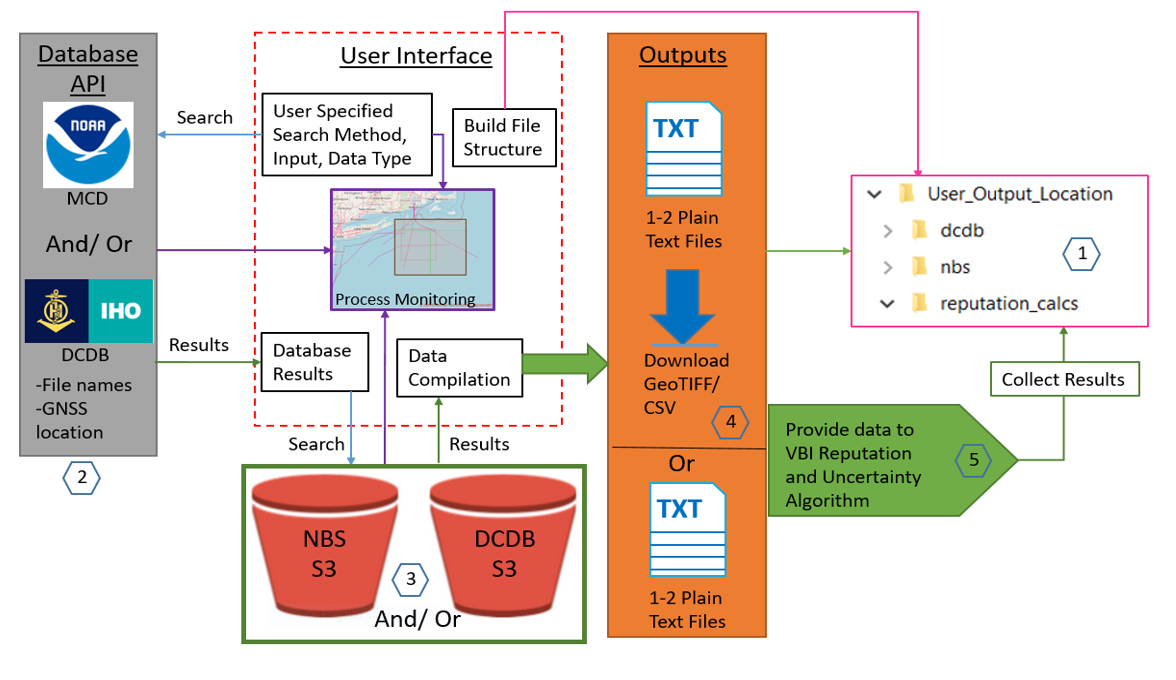
The DCDB/ NBS implementation of VBI Compare (Fig. 1) consists of five major steps. The code builds a directory tree structure for data handling [1], then determines which authoritative or VBI data the user is looking for [2], cross references those results with the files available in the S3 bucket for the respective data type [3], and either downloads or indexes the URLs for the required files [4] in a plain text file depending on user needs. The reputation algorithm is then executed [5] if certain constraints are met.
VBI Compare was developed as a desktop application in Python for compatibility with existing tools such as The Center for Coastal and Ocean Mapping (CCOM) / NOAA Hydroffice (HydrOffice, 2022) or the NOAA/ CCOM Pydro suite (OCS, 2022a). This application is open source, allowing for modification to suit the local environment (e.g. with different databases) without licensing.
The VBI Compare GUI provides for search parameter specification and can be customized to launch the reputation calculation for the area, vessel, or chart of interest. A monitoring sub-window allows for visualization of the data discovery processing status and the data collected. On the monitoring window, the map display is the primary data visualization tool showing how many files were collected and their geographic location. Additionally, text outputs and progress bars allow the user to monitor and confirm progress.
5 Case study
A case study was completed using the Galveston Ship Channel (US Gulf Coast). For comparison, the same data discovery was attempted both manually and programmatically using VBI Compare.
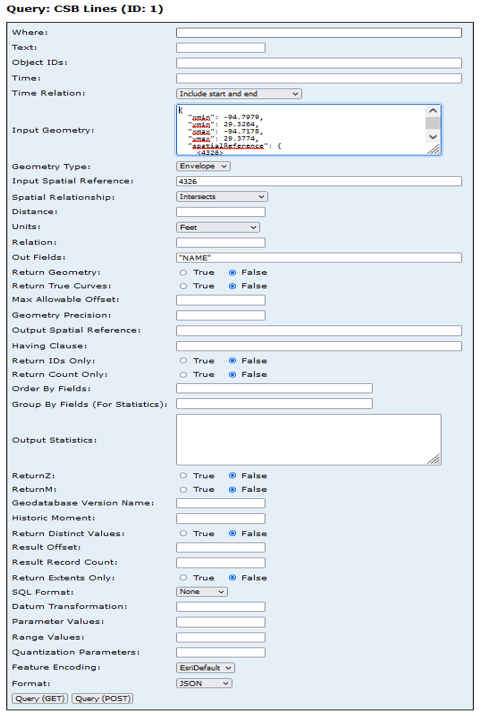
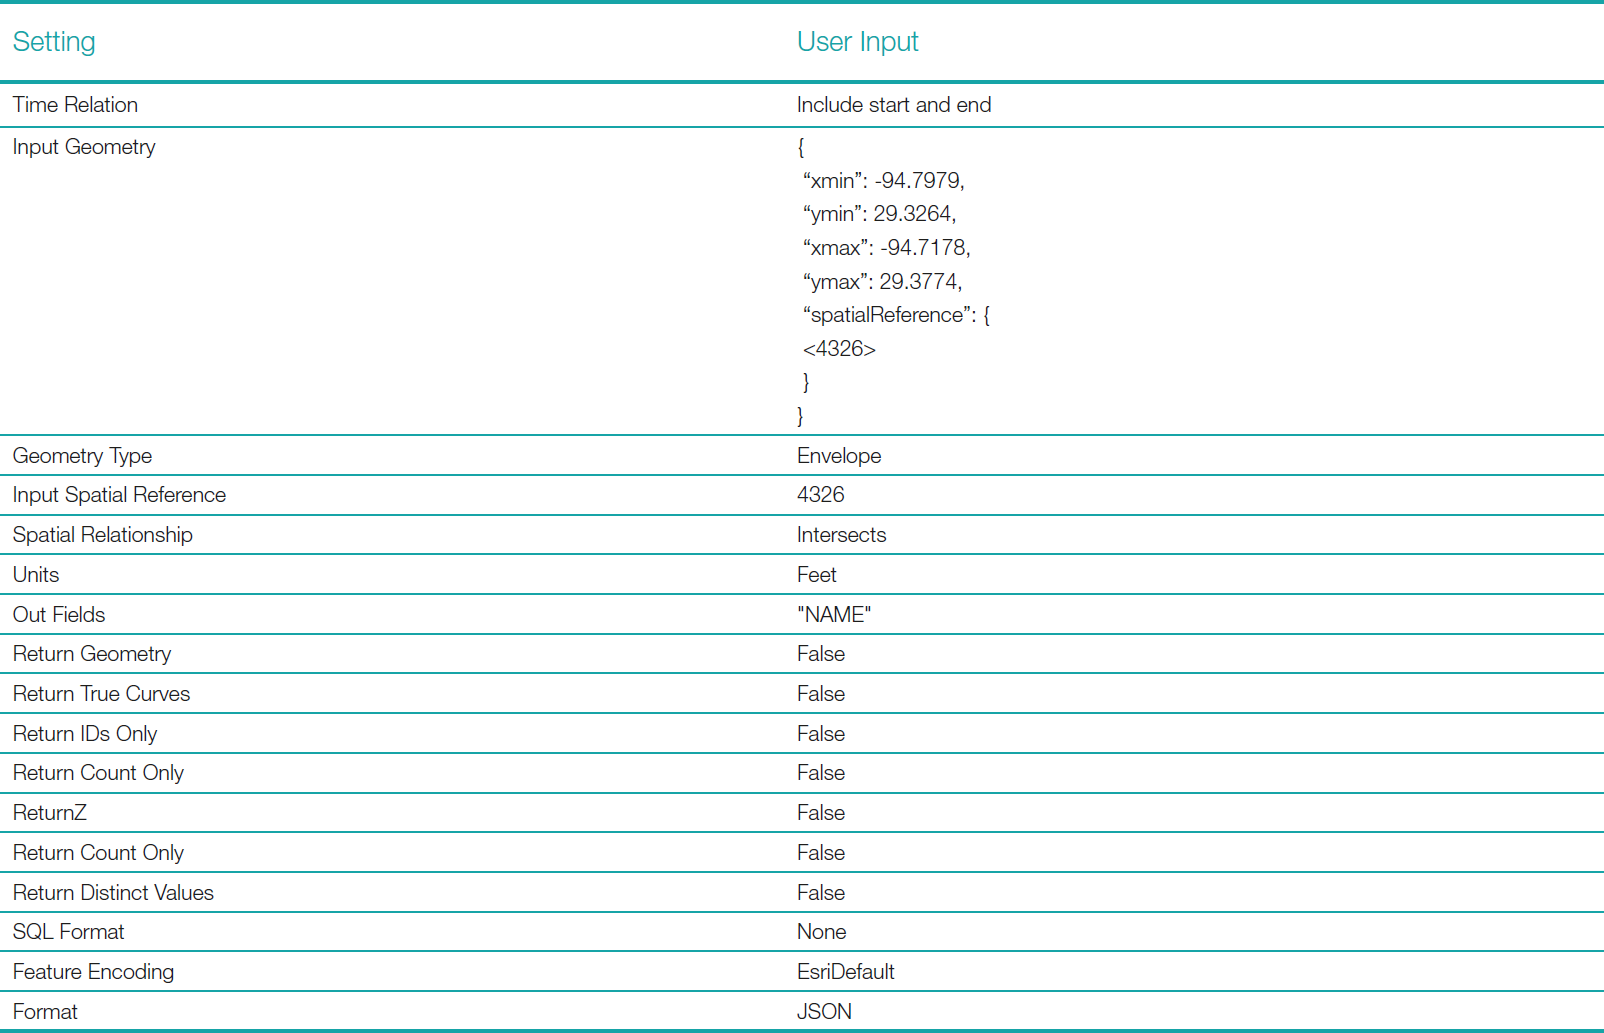
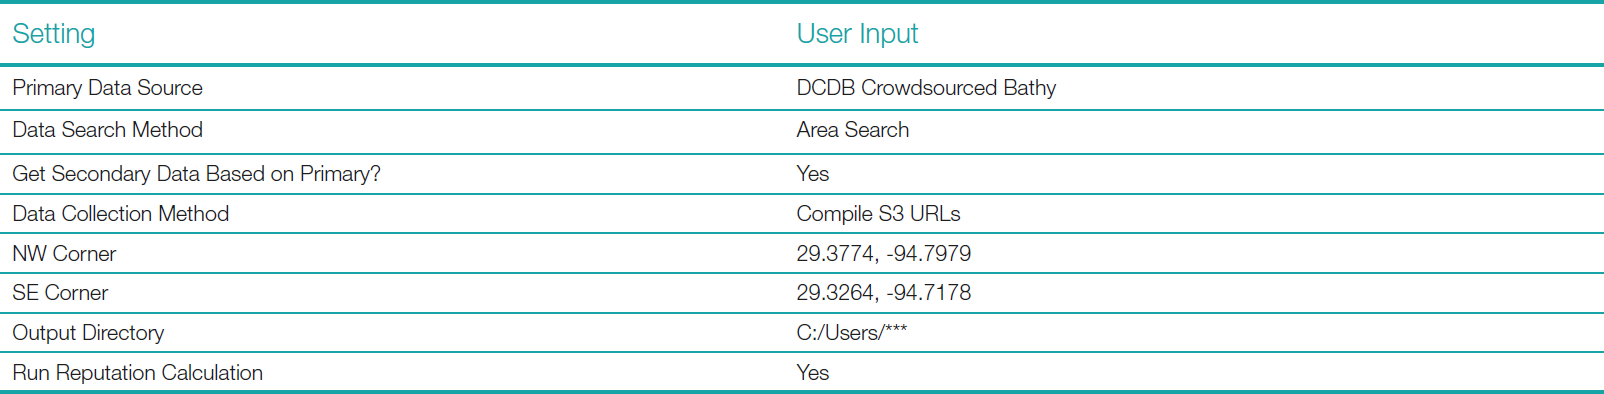
The use case for this study was to first search the DCDB CSB S3 bucket based on a user defined geographic area. Then the NBS bucket was searched using the resulting track-line geometry of the VBI data returned from DCDB. This use case was selected because it could be commonly used by HOs, and it exercises VBI Compare to its maximum extent. VBI Compare was instructed to collect S3 URLs for cloud-based processing. The manual data discovery and management attempt followed this same workflow. The settings used for the query can be seen in Appendix 1.
5.1 Case study using manual methods
The DCDB CSB ArcGIS REST API was used to determine the CSB files that are available for the area of interest. The query resulted in one thousand file names. This output does not provide data or links to data, so the user was required to copy the JSON text to a Microsoft Excel file, and then parse the result to yield the file names; Excel string manipulation formulae were used for transformation to URLs. The DCDB portion of the workflow was complete when the user copied these URLs to a plain text index file. Excel was used instead of, e.g., Python to reflect notional use experience in the field, i.e., Excel experience is more common than Python. This simulates the methods a user would need to employ without prior training, specialized programs, or skills yielding a better estimation for level of effort.
The DCDB trackline geometry was used to determine the intersecting NBS tiles. During manual testing, it was found that collecting and managing this track line geometry was difficult without writing a script. It became too cumbersome to attempt, so the user opted to query the NBS GeoPackage using the original user supplied area rather than track line geometry; this resulted in only the NBS tiles that were strictly necessary for the area.
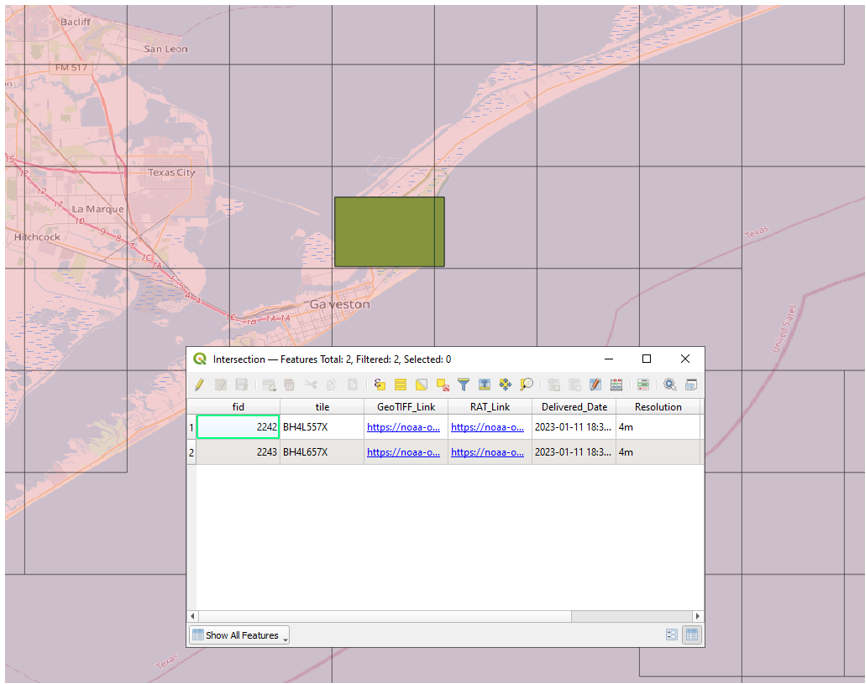
The user opened the NBS GeoPackage in the desktop QGIS application. After importing the GeoPackage, a Shapefile layer was created encompassing the user supplied search area. An intersection analysis was completed between the two files yielding a list of the resultant file names and links to two NBS GeoTIFF tiles in the NBS S3 bucket (Fig. 2). The user then copied the GeoTIFF links to an index file, completing data discovery. The total time to complete manual data discovery took about 29 minutes, 17 minutes for the DCDB steps and 12 minutes for the NBS steps.
5.2 Case study using VBI Compare
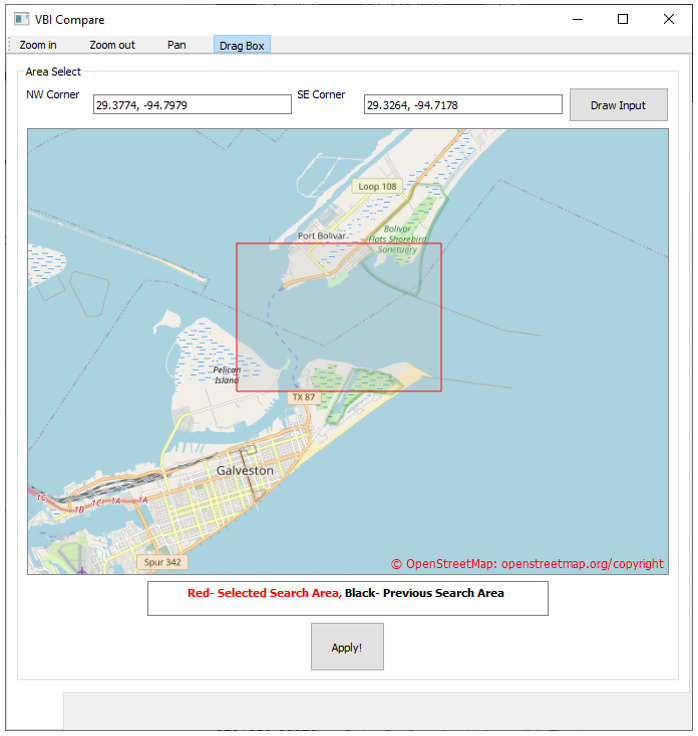
The bounding box in Fig. 3 used for automated data discovery using VBI Compare was the same as that used above in the manual workflow.
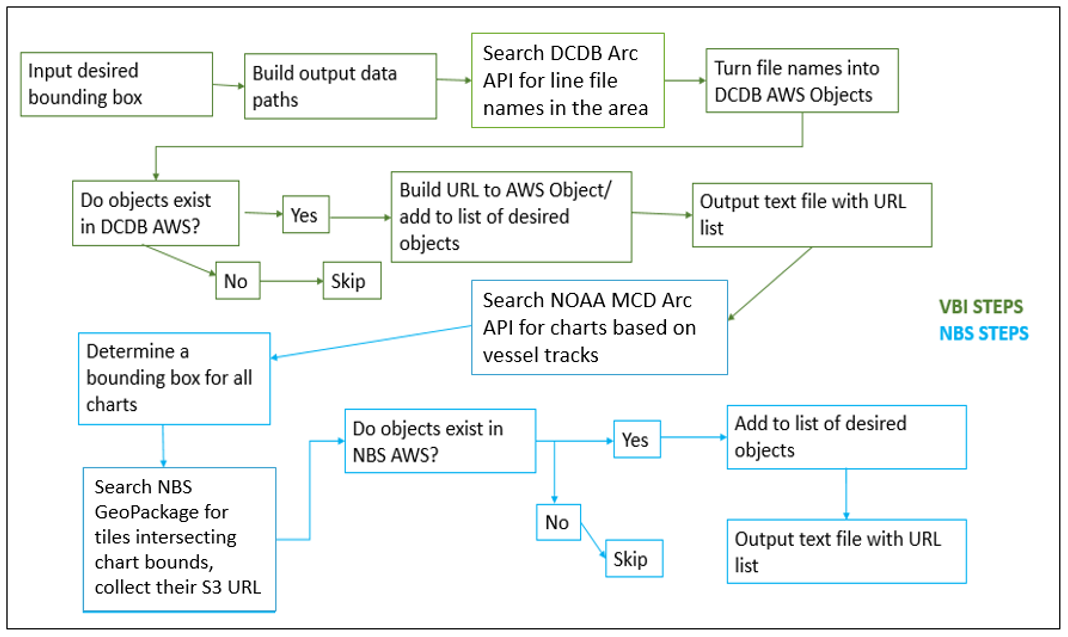
The workflow of VBI Compare is given in Fig. 4. The VBI Compare run of the case study resulted in the same one thousand DCDB track lines as were collected manually. However, this portion of the workflow completed in about 30 seconds (compared to 17 minutes). Additionally, the track line geometry could be automatically collected and managed by the program. Since track line geometry was extracted, 141 S3 URLs for NBS tiles were collected covering the entire length of each track line, compared to the 2 NBS tile URLs collected manually. This step was completed in approximately ninety seconds (compared to 12 minutes for this portion of the manual workflow). Execution of the workflow in VBI Compare resulted in the creation of two plain-text index files in the constructed directory tree as well as a download of the most up to date NBS GeoPackage file. Finally, the program took 13 seconds to determine that 122 MCD charts could be affected by the reputation calculations using the data sets collected. It also provided the user with a list of those chart numbers. In total, it took VBI Compare 180 seconds to collect, package, store, and display all this data (Fig. 5). This test was repeated several times with varying loads on the internet bandwidth. These tests all fell within a total runtime range of 120–210 seconds. This range of results showed some dependence on internet bandwidth but was still much faster (approximately 700–1,000 %) than the manual workflow, regardless of the load.

6 Discussion
Several limitations became apparent while testing the manual data discovery workflow, shedding light on its limitations. The first was that the DCDB API query does not return data or links to data, but rather a simple list of file names. The need to translate the results from the query into URLs was a tedious and time-consuming process. While significant time might be saved with an experienced Excel user, the process is still error-prone. Secondly, the complexity of trackline geometry management made it impractical to do for manual processing. While the results are still valid collecting colocated data over only the original area of interest, the manual process collects far fewer NBS tiles, lacking additional context. Although the manual method collects all VBI data that exists for the area of interest, collecting all VBI data for track lines that intersect the area of interest (as VBI Compare can do) enables the user to discover more data points for the reputation algorithm to compare leading to more accurate reputation scores. The QGIS intersection analysis required by the manual workflow did not take much time, but still required basic knowledge of the QGIS platform or GIS systems. Additionally, manually creating the two index files (one for VBI and one for authoritative data) was not particularly taxing, but it is error-prone. Further, in the case where local downloads of the files is desired, the manual download process may be too difficult or time consuming to perform for large search areas. The 29-minutes it took to complete the manual method did not include the time to click each link and save each file in a manually constructed directory tree that would be required for local processing. While not fully evaluated, it was clear that the time added for local downloads and file management would be significant.
With the manual method, determining the MCD charts that could be affected by a reputation calculation with the discovered datasets would require the collection of the track line geometry and an API search against that geometry using the MCD Rescheme Status API. There are six ENC resolution bands. Band one is excluded because of the small scales it uses, so each NBS tile would have to be cross referenced to each of the five remaining bands to determine the charts of interest. For one thousand track lines, this would result in five thousand manual API queries. Clearly this would be impractical. While not a strict requirement of the project, VBI Compare is able to determine the MCD nautical charts that might be affected by a reputation calculation. This could be used in the future to inform users about the reputation of data used to build a given chart.
The uptake of VBI as a data source by hydrographic offices has met resistance due to the time expense of determining data quality or constructing a final usable product. It has been shown here that VBI Compare in conjunction with a data comparison algorithm could unlock VBI as a viable data source by significantly reducing the workload of determining data quality. While VBI Compare has significant potential, additional updates to the DCDB and the NBS could further these contributions. Still, there are some potential limitations to VBI Compare.
As shown, the DCDB S3 bucket is not directly searchable, necessitating the use of its API and a translation of file names from the DCDB API to the S3 bucket naming convention. This could be alleviated by either making the file naming conventions of both databases the same, or alternatively using a GeoPackage type file within the S3 bucket similar to that of the NBS. Further, vessel metadata stored in DCDB VBI GeoJSON files (which are only accessible via the ArcGIS REST API) are not available in the CSV file encoding of the same data stored in the S3 bucket. If the DCDB were to store a dictionary file, mapping the vessel metadata attributes to vessel unique identifier, in the S3 bucket, VBI Compare would be able to collect this data as part of its data discovery process.
Until the DCDB S3 bucket becomes directly searchable, it will still be necessary to translate filenames returned by the ArcGIS REST API to the naming convention used in the S3 bucket, making the data discovery mechanism used by VBI Compare brittle to future changes in either the REST API or S3 file naming convention. In such cases, VBI Compare would no longer function until the code is updated. Aligning the naming conventions between these databases and updating VBI Compare would alleviate this issue going forward. The new Pointstore API may alleviate this concern because it can be interacted with programmatically and allows for a direct search with criteria such as geographic envelope, platform, date, and more.
The naming convention of the data tiles in the NBS differs from that of ENC, making a comparison between the tessellations necessary to determine which ENC charts may be affected by a data quality calculation. This disparity in conventions also makes searching by a specific ENC chart more difficult. The GeoPackage file used by NBS could also serve as a cross reference file for ENC charts. If a mapping between ENC charts and NBS tiles existed in the GeoPackage file, then an intersection analysis could be executed on the GeoPackage by both geometry and chart number removing the need to use the MCD ENC Rescheme API.
7 Conclusion
VBI Compare makes significant contributions toward expanding the use of VBI by HOs for authoritative or monitoring purposes. This case study showed that rapid discovery of colocated authoritative and VBI data sets is possible using a semi-automated programmatic method. Not only can data sets be discovered in any geographic area where authoritative and VBI data sets exist, but they can be collected and managed rapidly. Additionally, by being open- source, VBI Compare can be adapted to the needs of the user allowing for different data sources or search criteria in the future. Furthermore, its design as a desktop application allows it to be integrated into existing hydrographic tool suites for ease of dissemination.
It was shown in this case study that consistent results given the same input were achieved, ensuring that VBI Compare could be used in further testing and development of VBI reputation and data uncertainty calculation algorithms. Its robust operation, simple interface, and transportability make VBI Compare, in conjunction with the VBI reputation and uncertainty calculation algorithm (Calder, 2021), a viable alternative to manually discovering, acquiring, and managing VBI data and calculating VBI reputation and uncertainty.
Acknowledgements
This research was supported by NOAA grant NA20NOS4000196, and significantly benefited from the comments of the peer reviewers. The support of the Center for Coastal and Ocean Mapping, Office of Coast Survey, NOAA National Bathymetric Source Team, and Data Centre for Digital Bathymetry is also gratefully acknowledged.
References
Amazon (2023). Amazon S3 – Object storage built to retrieve any amount of data from anywhere. Amazon Web Services, Inc. https://aws.amazon.com/s3/ (accessed 29 March 2023).
Calder, B. (2021). Estimating Observer and Data Reputation in Mariner Volunteered Bathymetry. The International Hydrographic Review, 25, pp. 77–96.
EMODnet (2024). European Marine Observation and Data Network (EMODnet). European Commission, European Union. https://emodnet.ec.europa.eu/en (accessed 20 July 2024).
GeoJSON (2016). The GeoJSON Format. GeoJSON Working Group, Internet Engineering Task Force (IETF). https://datatracker.ietf.org/doc/html/rfc7946 (accessed 12 October2024).
HydrOffice (2022). HydrOffice – A Research Framework for Ocean Mapping. HydrOffice team. https://www.hydroffice.org/ (accessed 16 December 2022).
DCDB (2022). csb (MapServer). IHO Data Centre for Digital Bathymetry. National Centers for Environmental Information, National Oceanic and Atmospheric Administration, USA. https://gis.ngdc.noaa.gov/arcgis/rest/services/csb/MapServer (accessed 19 December 2022).
IHO (2022a). Guidance to crowdsourced bathymetry (3rd ed.). IHO Publication B-12, International Hydrographic Organization, Monaco. https://iho.int/uploads/user/pubs/bathy/B_12_CSB-Guidance_Document-Edition_3.0.0_Final.pdf (accessed 16 December 2022).
IHO (2022b). Universal Hydrographic Data Model (5th ed.). International Hydrographic Organization, Monaco. https://iho.int/uploads/user/pubs/standards/s-100/S-100_5.0.0_Final_Clean_Web.pdf (accessed 16 December 2022).
Jencks, J. and Chappell, A. (2018). Working Together to Map the Gaps. Hydro International, September, p. 11.
Klemm, A. R. and Krabiel, T. (2023). From Crowd to Chart: Methods and Applications of Crowdsourced Bathymetry in Support of Safe Navigation. https://github.com/anthonyklemm/Crowdsourced_Bathy_Processing/blob/main/Klemm_CSB_USHYDRO23.pdf (accessed 6 April 2023).
NGA (2022). World Geodetic System 1984 (WGS 84). Office of Geomatics, National Geospatial-Intelligence Agency, USA. https://earth-info.nga.mil/index.php?dir=wgs84&action=wgs84 (accessed 16 December 2022).
NONNA (2022). Canadian Hydrographic Service Non-Navigational (NONNA) Bathymetric Data. Canadian Hydrographic Service, Canada. https://open.canada.ca/data/en/dataset/d3881c4c-650d-4070-bf9b-1e00aabf0a1d (accessed 5 April 2023).
OCS (2022a). Introduction to Pydro. National Oceanic and Atmospheric Administration, USA. https://svn.pydro.noaa.gov/Docs/html/Pydro/universe_overview.html (accessed 16 December 2022).
OCS (2022b). MarineChart_Services/Status_New_NOAA_ENCs (MapServer). National Oceanic and Atmospheric Administration, USA. https://gis.charttools.noaa.gov/arcgis/rest/services/MarineChart_Services/Status_New_NOAA_ENCs/MapServer (accessed 19 December 2022).
OCS (2023). nowCoast. National Oceanic and Atmospheric Administration, USA. https://nowcoast.noaa.gov/ (accessed 8 May 2023).
OCS (2024). National Bathymetric Source. National Oceanic and Atmospheric Administration, USA. https://www.nauticalcharts.noaa.gov/learn/nbs.html (accessed 20 July 2024).
OGC (2019). OGC GeoTIFF standard. Open Geospatial Consortium. http://docs.opengeospatial.org/is/19-008r4/19-008r4.html (acessed 16 December 2022).
OGC (2021). OGC GeoPackage Encoding Standard. Open Geospatial Consortium. https://www.geopackage.org/spec130/ (accessed 16 December 2022).
Pointstore-API (2024). Crowdsourced Bathymetry Pointstore API. National Centers for Environmental Information, National Oceanic and Atmospheric Administration, USA. https://github.com/CI-CMG/pointstore-api-docs/blob/main/pointstore_api.md (accessed 19 July 2024).
Safranovich, Y. (2005). Common Format and MIME for CSV Files. The Internet Society, Seabed 2030 Project, 2024, Seabed 2030 announces latest progress on World Hydrography Day. https://seabed2030.org/2024/06/21/seabed-2030-announces-latest-progress-on-world-hydrography-day/ (accessed 20 July 2024).
Appendix 1: Query settings

Authors’ biographies

LCDR Patrick Debroisse, CMH(A) has served in the NOAA Commissioned Officer Corps since 2014 and is currently the Operations Officer of the NOAA Ship Ferdinand R. Hassler. He earned his M.S. in Ocean Engineering: Ocean Mapping from the University of New Hampshire completing his thesis supporting programmatic solutions for Volunteered Bathymetric Information quality assessment in 2023. He also earned the FIG/ IHO Category A certification and became a THSOA/ NSPS Certified Master Hydrographer while studying at the University. In addition, he holds a degree in Mechanical Engineering from Norwich University (Vermont, USA).

Dr. Miles is trained as a software engineer and physical geographer. His research has focused on ecohydrology modeling in urbanized and forested watersheds; this work included developing tools to support reproducible ingest and transformation geospatial data, as well as model calibration and uncertainty estimation using HPC resources. He has current and prior experience in software engineering, Internet of Things, environmental monitoring, and geospatial data storage and analysis. Dr. Miles is currently focused on translating research codes and algorithms into deployable software artifacts supported by robust documentation, automated testing, continuous integration, observability, fault tolerance, and scalability.
- VBI Compare is available at https://github.com/CCOMJHC/VBI-Compare/ (accessed 29 July 2024).
- The DCDB Pointstore API was released in the spring of 2023 after the initial research and development phase of VBI Compare was completed and was therefore not considered for use.
- https://www.ncei.noaa.gov/maps/iho_dcdb/ (accessed 29 July 2024).