


Abstract
1 Introduction
Global navigation satellite systems (GNSS), such as the American GPS and the European Galileo, have very low-power received signals, sitting even bellow the noise level of a typical receiver, due to the long propagation paths between satellites and Earth receivers. For this reason, the system is considerably vulnerable to interference signals, which might come from varied sources, from TV stations to portable privacy devices (Dovis, 2015). Non-intentional GNSS interference might be caused by spurious transmissions generated by faults on electronic systems, by natural phenomena like solar bursts, and by other electronic systems sharing the spectrum, such as Aeronautical Radio-Navigation Services (ARNS) whose signals give support to the navigation of aircrafts. Intentional interference is caused by a malicious agent whose objective is to disrupt navigation by jamming or spoofing the signal. Jammers operate by emitting strong signals that saturate the GNSS receiver, and thus makes it blind to the satellites. Spoofers, as described in Günther (2014), intend to cause wrongful operation of the receiver, leading to integrity risks. Usually spoofing is achieved through the emission of fake GNSS signals carrying false positioning information. An overview of different types of GNSS interference and corresponding countermeasures can be found in Morales-Ferre et al. (2019).
Because of the ever-increasing reliance of the modern world on GNSS services (e.g. localization for transports, and time synchronization for banking systems), and the growing number of interference events, the attention on the threats posed by the GNSS interference has increased, bringing about efforts to closely monitor the situation and counteract accordingly. Because of good visibility of interference sources at the flight altitudes of airplanes even at long distances, the aviation community was probably one of the first alarmed and starting to search for efficient countermeasures (Duchet & Berz, 2018). The threat of GNSS jamming and spoofing was also recognized in the maritime domain leading to the inclusion of potential countermeasures in the e-Navigation plan issued by the International Maritime Organization (IMO, 2018). For supporting the identification of the suitable countermeasures, possible impact of GNSS jamming and spoofing on maritime navigation has been experimentally studied by several research groups (Grant et al., 2009; Medina et al., 2019; Bhatti & Humphreys, 2017; Appel et al., 2019). Although some large interference events got well known to the GNSS community, see for example a detailed analysis of so-called Black Sea spoofing event in C4ADS (2019), the actual interference situation experienced by the GNSS users in the maritime domain on the everyday basis is, however, not really well studied. While the interference threat scenarios for GNSS users in the aviation and ground-based navigation domains can be well assessed using information from multiple measurements campaigns (Dumville, 2018; Thombre et al., 2017; Gerrard et al., 2021; Sokolova et al., 2022) and existing monitoring capabilities (Jada, 2022; Raghuvanshi et al., 2024; Wiseman, 2022; Liu et al., 2023; SkAI-Data-Services, 2023) only few maritime-dedicated campaigns have been carried out in the past (Pérez-Marcos et al., 2018).
In this regard, the German Aerospace Center (DLR) in partnership with the German Federal Maritime and Hydrographic Agency (BSH) and the Maritime German Federal Police (BPol See) conducted measurement campaigns in the Baltic and North Seas to assess the current situation of the interference scenario in maritime. Three prototypes of an interference detection and monitoring system suitable for maritime applications have been developed on the basis of the DLR’s GALANT receiver platform (Cuntz et al., 2008). Thanks to the measurement campaigns, a wealth of raw signal data and receiver observables could be gathered allowing for the characterization of the many interference events through signal processing. With these, the scenario of interference in maritime domain could be profiled with respect to the days and months, and to their location of occurrence.
In Section 2 the developed prototypes are presented with their antennas and electronic components. They provide extended monitoring capabilities thanks to the use of array antennas for signal reception, as has been proven in past in the maritime domain (Konovaltsev et al., 2017). The array provides spatial diversity for navigation and interference signals impinging from different directions resulting in the capacity of direction-of-arrival estimation, leading to the identification of interference sources in some situations. The prototypes allow also for real-time monitoring of the quality of the navigation signals and the signal spectra in two domains: GPS L1/Galileo E1 around 1575.42 MHz, and GPS L5/Galileo E5a around 1176.45 MHz.
Section 3 presents the interference detection strategies based on statistical and spatial signal processing, which also allowed for the identification and characterization of interference signals. Depending on the type of signal waveform, an interference event can be more or less destructive to the nominal GNSS signals reception. Further in Section 4, the perspective of the maritime interference scenario is presented with the geographical distributions of the relevant interference events in L1 and in L5. In Section 5, conclusions are drawn on the current threat level on the maritime domain.
2 Monitoring platform
Three prototypes of a system for detecting GNSS interference in the form of jamming and spoofing signals have been developed in order to allow the measurement campaigns and to prepare suitable monitoring solutions to be used by state authorities in the maritime domain such as BSH and BPol See. The interference detection was carried out for the civil signals of Galileo and GPS in E1/E5a and L1/L5 bands. In the last two prototypes, a suitable graphical user interface presenting information about the detected interference signals and status of GNSS-based navigation in an intuitive and concise form was one of the main design goals.
The prototype development was based on the GALANT flexible multi-antenna receiver platform that has being developed by the Institute of Communications and Navigation of DLR since 2008. The multi-antenna strategy adopted by the GALANT platform allows for exploring spatial diversity, i.e. discriminating received signals by their directions of arrival (DoA), and increasing the receiver’s robustness to radio-frequency interference (RFI) (Heckler et al., 2011; Antreich et al., 2015).
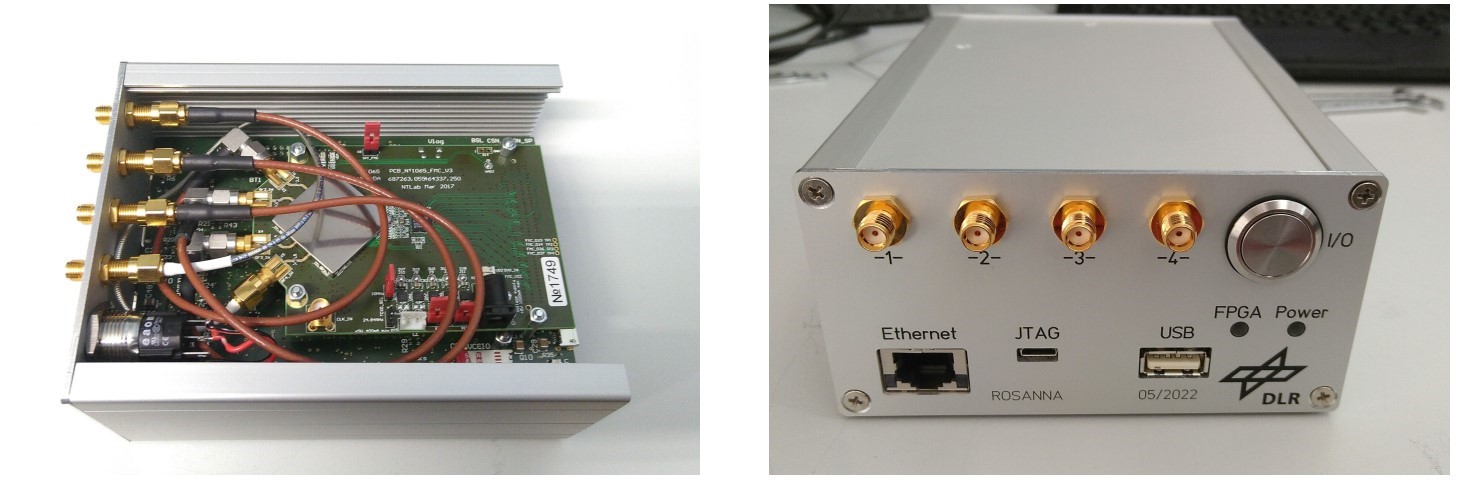
In the first and third prototypes, a maritime version of the array consisting of seven antenna elements disposed in a hemispherical platform was used. In the array, six elements are arranged radially and the seventh is placed on the top as shown in Fig. 1. The patch antenna elements allow for dual-frequency reception in both L1/E1 and L5/E5a bands. The antenna array is connected to the radio-frequency (RF) front-ends capable of processing information from the seven antennas with two channels, L1 and L5, allocated for each antenna element. The front-end operates at the intermediate frequency of 75 MHz with a bandwidth of 20 MHz for L1 and 24 MHz for L5. The analog intermediate-frequency (IF) outputs of the frontends are connected to a Nutaq PicoDigitizer digital signal processing platform. For sampling, the platform uses a bank of 14-bits analog-to-digital (ADC) converters operating at 100 Msps sampling rate. The signal samples of all antennas at both frequency bands were recorded not continuously but in the form of snapshots, each of 30 ms long. The snapshot recording was triggered either on a regular basis for system monitoring purpose every 10 minutes or each time when GNSS interference is detected (Konovaltsev et al., 2017). Two ADCs are used for each array element because of the dual-band operation. The output power of the RF front-ends is fixed so that only 3–4 bits are used in nominal interference-free signal conditions and the most of the ADC dynamic range is preserved for strong interference signals. In this way, no automatic gain control is used and the increase of the received RF power due to RFI can be directly observed. The pictures of the hardware are reproduced on Fig. 2.
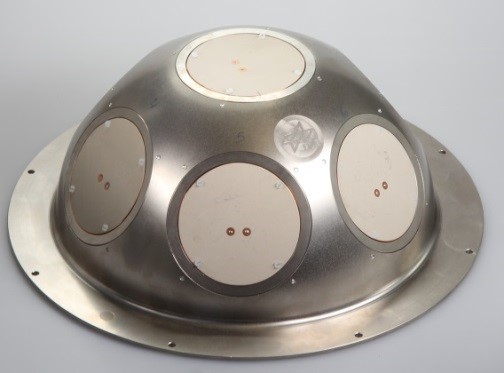

and frequency response of a single antenna (b).

On the second measurement campaign, in 2022 on board of a ship of BPol See, a monitoring system prototype base on a miniaturized version of the GALANT platform, which was operated as an array GNSS receiver, was deployed. In order to enable the interference detection and monitoring, the array receiver was extended to produce several test metrics as described later. While this platform has a small form factor and reduced cost, only four antennas and single-band operation can be supported. Therefore, a four-elements array shaped in a two-by-two square grid was used in this case (Fig. 3). Each of the array elements operates on GPS L1/Galileo E1.
The digital hardware of the miniaturized GALANT is based on a PicoZed-type system-on-module (SoM) mounted on top of a commercial base-board. The SoM is equipped with a Xilinx system-on-chip formed by a field-programmable gate array (FPGA), which enables simultaneous parallel processing of the four antenna channels, and a central processing unit (CPU), which allows for fast data exchange between the FPGA and a generic processor (Fig. 4).


The prototype based on the miniaturized GALANT was deployed with a tablet running a graphical user interface (GUI) allowing the user to monitor in real-time the quality of the navigation signal and the directions of arrival of interference signals in form of an angular spectrum (Fig. 5). Among the signal quality metrics given by the GUI were: position information, the range accuracy, the quality of the satellites’ signals represented by the ratio between the signal and noise power densities known as carrier-to-noise ratio (C/N0). In the angular spectrum, hotter colors depict stronger power impinging from the respective elevation and azimuth angles in the local Cartesian coordinates of the ship.
Following the GUI development from the second measurement campaign, on the third (and last) campaign, carried out again on board of the BSH ship, a graphical user interface was added to the monitoring system prototype as shown in Fig. 6. The user interface was displayed on a dedicated notebook. The GUI panels on the upper part show GNSS signal quality metrics such as the user position information, sky-plot of visible and used GNSS satellites as well as C/N0 bar plot. The lower half of the GUI screen presents several RF-level characteristics of the received antenna signal: angular spectrum allowing for identifying the angle of arrival of an interference signal as well as power spectrum density and spectrogram allowing for monitoring the behavior of an interference signal in time and frequency domains. Also, a commercial L1/L5 receiver, NEO-F10T of u-blox, was integrated in the monitoring system. The objective of that receiver was two-fold: to assess the actual interference effect on a typical commercial receiver, and to compare the interference detection available in the commercial receiver with the one provided by the system prototype. The use of commercial GNSS receivers for the RFI detection purposes is considered to be a practical option, especially in case of large area monitoring (Jada et al., 2022; Dimc et al., 2017).


3 Data analysis
3.1 Detection through signal and statistical processing
Due to the power of GNSS signals sitting below background noise level, the digital samples follow the Gaussian distribution characteristic of white noise samples. Moreover, GNSS signals are modulated with pseudo-random noise (PRN) codes at transmission, which allow them to be recovered even if the signal power is below that of noise. The latter, because of its properties similar to thermal noise, also causes the signal to have Gaussian distribution. For these two reasons, the shape of nominal signals (i.e. in interference-free scenarios) distributions is known to be approximately Gaussian.
Thus, increases in the received power caused by interference signals change the statistical distribution of the digital samples, and such changes can be detected via statistical methods that count the number of samples lying beyond pre-determined thresholds (Konovaltsev et al., 2009; Motella & Lo Presti, 2014). The thresholds are determined in laboratory to take into account the physical characteristics of the antennas and hardware when capturing signals in nominal conditions. A priori this threshold calibration can be made to implement the algorithm to any antenna and front-end designed to operate in GNSS frequencies. As depicted on Fig. 7, if power is increased due to interference too many samples lie beyond the thresholds, triggering the detection.
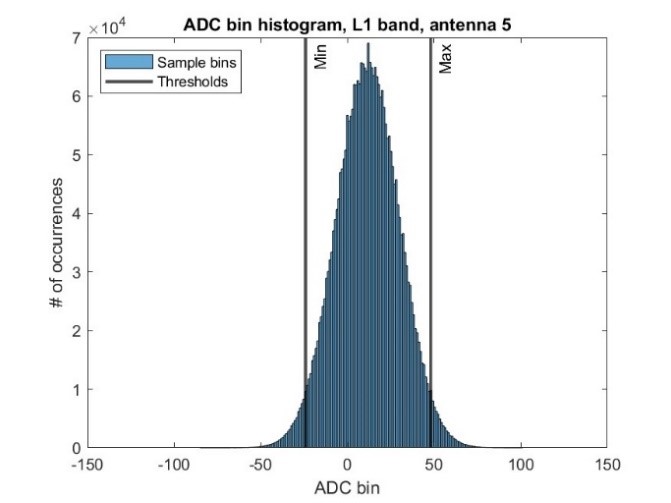

and RFI case from June 26, 2021 at 11:30:03 MET (b).
This type of power-based detection method is more suitable to detect interference signals with elevated power, i.e. usually jamming signals. However, as already shown in Akos (2012), even spoofing signals can be detected using power-based methods. Specifically, the publication monitors the Automatic Gain Control (AGC), which is implemented in the RF front-end and controls the gain of the incoming signal to adjust it to the ADC dynamic range and avoid receiver saturation. This gain serves as a metric for RFI detection. In GALANT, as already stated, there is no AGC but the very wide dynamic range of the ADCs allow for the observation and recording of RFI signals with good definition without saturation.
The signal power variations ΔPin,dB due to interference have been profiled throughout the campaign as the increase of the average input power Pin of the nth signal snapshot with respect to the nominal level – described by Eq. 1 and depicted on Fig. 8. The nominal level is represented by the expectation of the input power in nominal conditions 𝔼(Pin,nom), and it was approximated by the mean of the average snapshot input power not flagged with interference in a selected time-window (e.g. a week of recordings). This metric was computed specifically for the top antenna of the array as it is representative of usual commercial receivers for possessing small low-elevation gains for being oriented upwards. With the power variations of interference events, they were classified in weak, medium and strong.
 |
(1) |
From the measurement campaigns, many different types of interference signals were recorded, and their waveforms could be identified from their time-frequency representation in their spectrograms (Fig. 9).
With these two information, the relevant interference events could be identified as caused by strong power signals with waveforms close to the GNSS center frequency of the respective system (e.g. the continuous-wave RFI close to the 1575.42 MHz carrier of GPS L1 in Fig. 9) or considerably overlapping the spectrum of the GNSS signal (see the wideband RFI in Fig. 9). It steered the data analysis, because these signals are the most efficient to cause degradation or the complete loss of navigation given their high power and their spectral match with the nominal signal.
Moreover, the analysis of the signal type made possible the identification of the source of the interference in some situations, as it was the case with signals emitted by ARNS base stations, which possess highly structured signals whose waveforms are known.


3.2 Detection through spatial processing
Another method used in the developed system prototypes to detect interference was based on spatial processing using the signals coming from the multiple antenna channels of the receiver. Given the geometries and the number of antennas, the system is capable of performing spatial processing for the estimation of the interference signals DoA, and consequently for the protection of the receiver by nulling the receiving power impinging from the estimated direction.
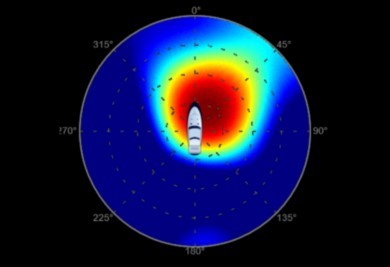
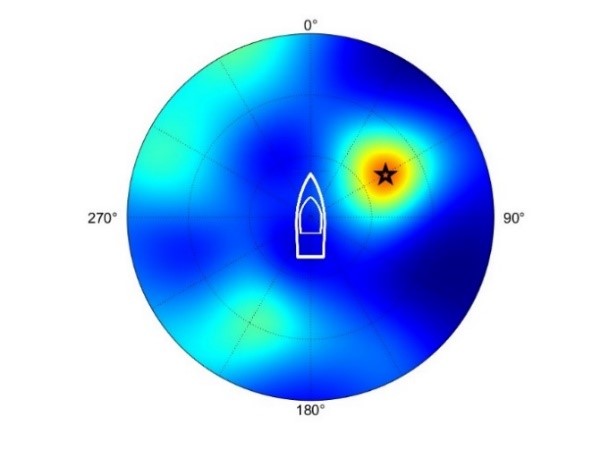
The capacity of interference detection relied primarily on the monitoring of a so-called pre-whitening screen which scans the environment around the receiver and shows the regions with increased power coming from the respective direction, as depicted on Fig. 10. If a specific area of the environment around the receiver has increased power, it means stronger signals are impinging from the respective direction, indicating the presence of interference signals.
This spatial processing and identification of the strong signals DoA was exploited in Pérez-Marcos et al. (2018) to detect also spoofing. There the authors worked with spatial processing to indicate if a large number of satellite signals was being emitted from the same direction, which is usually the case for sophisticated spoofers. Dangerous spoofing attacks often transmit not a few but a large number of fake satellite signals corresponding to different satellites. Thus, whereas authentic satellite signals come from different directions from the sky, signals of a spoofer attack come from the same direction, which can be detected by the technique of Pérez-Marcos et al. (2018).
3.3 Detection through signal quality monitoring
The last class of techniques adopted to detect interference is based on the monitoring of signal quality metrics that can indicate the presence of interference signals in the environment. Usually this approach might be misleading as the reduction of the signal quality might be due to suboptimal environmental conditions (e.g., hard weather conditions, physical coverage caused by tall buildings), or due to the absence of satellites in high-elevation. Because of these factors, the monitoring of the signal quality must be considered as an additional effort to help assessing the impact of interference events, or as supplementary method of interference detection.
One of these metrics is the Position, Velocity and Time (PVT) solution, which was evaluated in Tabatabaei Balaei et al. (2007) to assess the impact of interference, since receivers under interference heavy environments might not be able to accurately compute the PVT solution, or even to compute it at all. Another possibility is to monitor the drift in the PVT solutions: if the position and velocity change rate is suspicious (e.g., the navigation system is displaying a movement the receiver is not doing), or completely wrong.
Another widely used metric for monitoring is the C/N0, which represents the ratio between the power density of the signal of interest and the noise. This is a well-exploited metric to indicate the signal quality, and is often used even to decide if a tracked satellite should be or not considered for the PVT computation. As much as many factors may be sources of impairments that reduce the C/N0, it can still be used to monitor the presence of interference (Groves, 2005). Both of these metrics were adopted and used in the developed system prototypes, and are exemplified in Section 3.2.2.
3.4 Data processing
During the measurement campaigns data was processed automatically to detect interference signals and to display navigation information in real time. After the campaigns, the recorded data was further processed in laboratory to retrieve information on the interference nature: the signal waveform, the strength of the signals, and how it impacted the navigation capabilities of the receiver. Two sets of data were recorded: from the GALANT platform and from the u-blox receiver.
The GALANT raw data is recorded in binary files and is the output of the ADC in IF: the digitized samples of the real-signals of both L1/E1 and L5/E5a channels. It was processed in two steps: in pre and post-correlation domains. Correlation is the operation responsible for recovering the incoming signal from beneath the noise floor and for synchronizing it with the GNSS receiver. Signals modulated with the right satellite PRN code are enhanced while all the other are attenuated. A quick review on this process in the navigation receiver is described in Braasch & van Dierendonck (1999). With the raw data information like the signal waveform, the list of satellites whose signals were received and their respective C/N0 levels can be obtained, however position cannot be calculated.
The u-blox processing was performed by parsing its recorded data, which only possesses information already processed by the receiver, i.e. it does not provide raw data that can produce the same results of the pre-correlation stage of the GALANT raw data. Its use is for monitoring the navigation signal environment. Overall, u-blox is a very complete receiver that can provide many different sorts of information from parsing its data: list of tracked satellites, C/N0 levels, receiver heading orientation, interference status, gain of the AGC, and etc.
3.4.1 Pre-correlation processing
Pre-correlation data is predominantly thermal noise in nominal situations, and signal waveforms above noise level in situations of medium and strong interference. All the rest is below noise level, including GNSS signals. Some of the products of the pre-correlation processing are: the spectrograms (as in Fig. 9), power spectrum densities (PSDs, i.e. the profile of the spectrograms averaged in time), time plots of the digital samples, and signal DoA estimations (allowing for the rough localization of the interference sources). An example in Fig. 11 reproduces an event that raised the input power in more than 16 dB.
3.4.2 Post-correlation processing
As to the post-correlation data processing, satellite acquisition is performed providing valuable information on the navigation conditions under the influence of interference, to assess how it impacts the capabilities of a receiver to produce reliable PVT information. Some products of this processing are: the list of satellites that could be acquired, and the quality of their respective signals. The former can be compared to the actual constellation of visible satellites on the place and time of the interference event to assess how severe the impacts of the interference is. For this end the publicly available GPS and Galileo almanacs can be used (U.S. Department of Homeland Security, no date; European Union Agency of Space Programme, no date).

3.4.3 u-blox data processing
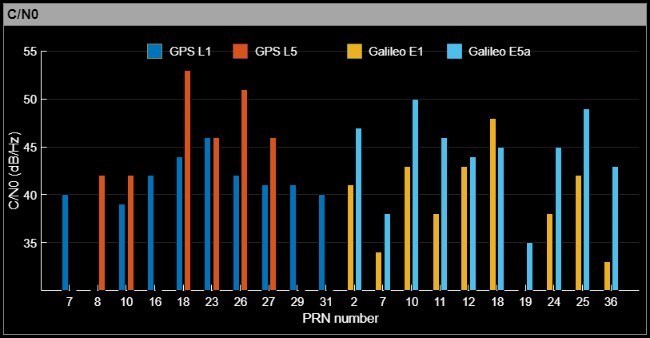
With the data recorded from the u-blox, navigation and satellites information could be retrieved to complement information from the GALANT platform, and to be displayed for real-time monitoring. Among the products of the u-blox data processing there are: the PVT solution, the list of acquired and tracked satellites in a sky-plot, and a bar-plot displaying the quality of the tracked signals with their respective C/N0 levels. On Fig. 12 the information and plots are reproduced as an example from the GUI (described in the next section), and was provided to the user in real-time for monitoring.

3.4.4 Real-time RFI monitoring using the GUI
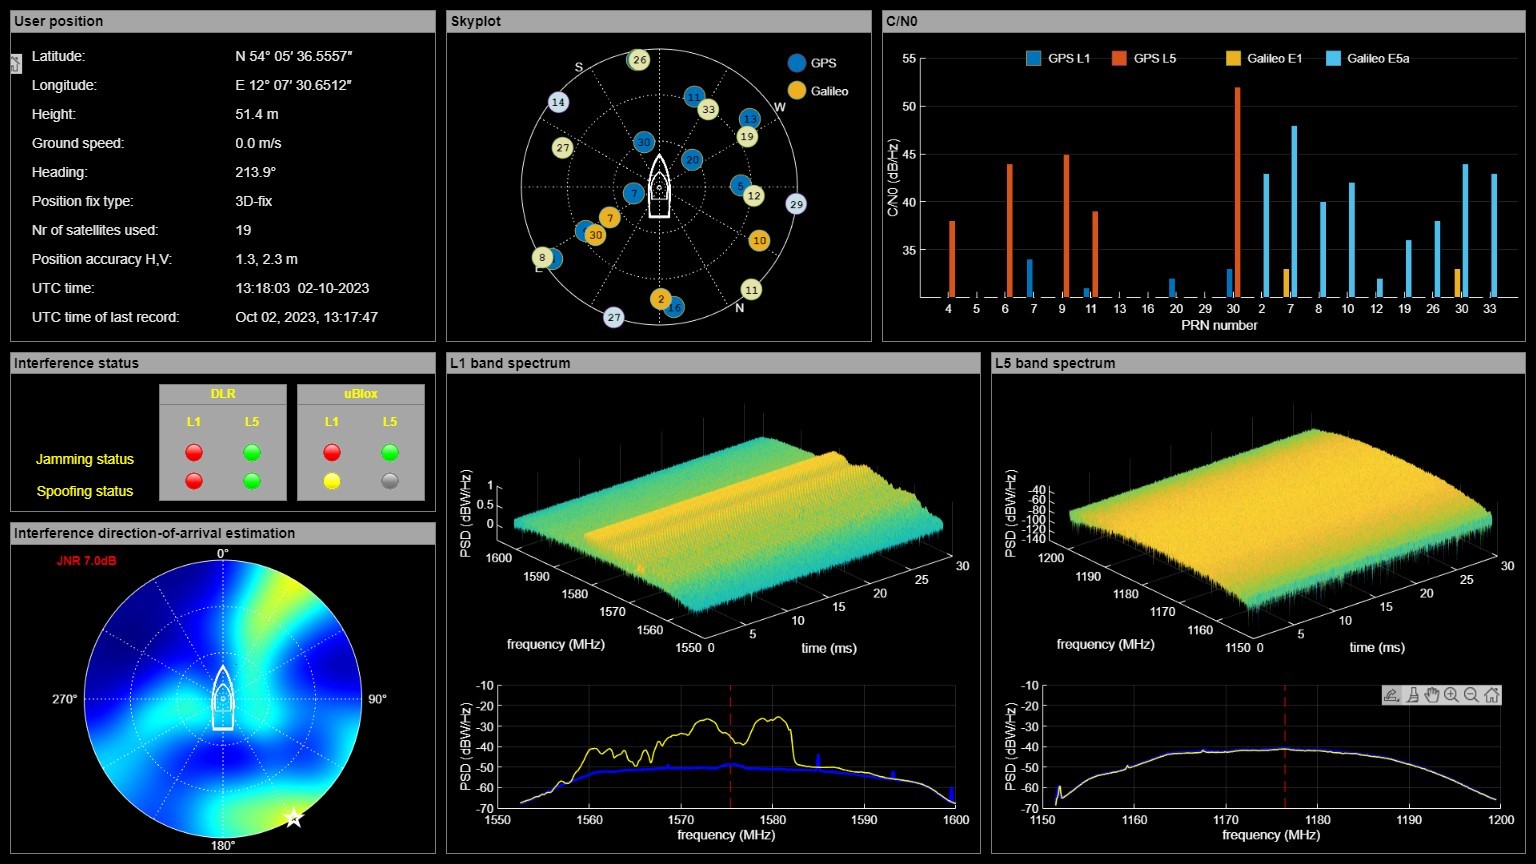
The GUI assembled information from both the GALANT processing chain and the u-blox receiver to display in real-time for the operators. It was capable of recording screenshots whenever interference was detected, being a helpful guidance for the data analysis of the most relevant cases. One screenshot example (Fig. 13) – of a very strong interference event caused by a wideband signal in L1 band – illustrates the visual of the interface during an event so strong that prevented navigation capacity.
The impact on the satellites acquisition and tracking can be perceived on the C/N0 window of the GUI, with only four blue bars (corresponding to GPS signals in L1 band) out of the 11 appear and indicating very weak signal strengths, making it impossible to provide new PVT solutions. C/N0 levels between 40 and 55 dB-Hz are very good, and levels below 40 are prone to produce noisier PVT solutions the closer the C/N0 is to 30 dB-Hz, under which it becomes critical.
The interference type was flagged as jamming and spoofing by DLR’s GALANT platform, and only as jamming by the u-blox receiver. The spoofing indication was probably due to the strong jamming power leaking through the correlators, thus propagating into the post-correlation domain. In this domain, the spatial technique described in 3.2 confuses this additional power as contributions from spoofing signals, causing the indication of spoofer.
The GUI could also deliver real-time DoA estimation of the RFI signal, allowing the interested operator to spot the source or at least the direction where it is coming from.
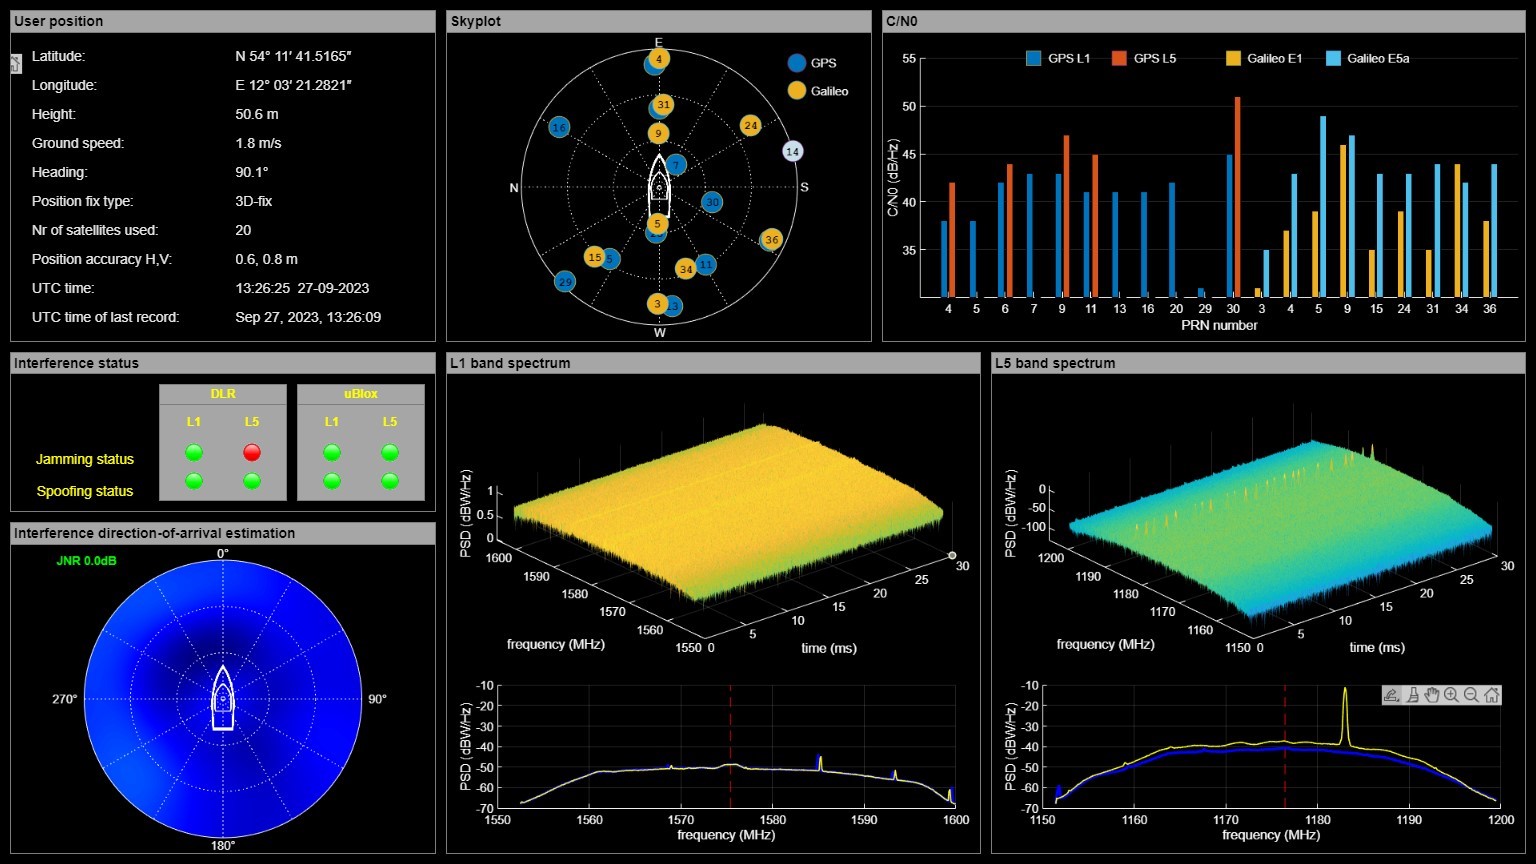
A second example of the GUI screenshot used for post-processing analysis is on Fig. 14, illustrating the detection of a strong L5 interference signal impinging on the receiver. The DoA estimation was not available for L5 band because it would require special calibration of the software for this band. From the spectrogram, the waveform and the center frequency of the signal indicate it to be an ARNS distance measurement equipment (DME) or its military counterpart tactical air-navigation (TACAN) signal (more details on section 4.2). Although often interfering with receivers positioned close to their stations, this type of signal usually does not cause considerable impacts on the navigation capabilities. In case of L5 interference, it is important to notice that some GPS satellites still do not transmit L5 signal (QZSS, 2024). The lack of flagging by the u-blox receiver was due to the higher sensitivity of DLR’s GALANT system compared to the u-blox, allowing only the former to detect it.
4 Radio-frequency interference events
Many relevant interference events have been assessed in the scope of the measurement campaigns post-processing analysis. In the campaigns deploying the GALANT demonstrator there were over 5000 detections in the L1 band as well in L5, but not all caused damaged to the receiver, so for this reason the focus of the analysis was on events that raised the nominal input power over 5 dB. Nonetheless this still represents a large number of events for this work, so only one analysis is reproduced here as an example of the procedure performed in the post-processing stage.
Moreover, in this section the overview of the geographical and time distributions of the interference events is presented. It is possible to identify the hot spots of interference occurrences using these plots (e.g. ports when the ship was moored). Thanks to the thorough analysis it was also possible to correlate the signal type and estimated direction-of-arrival with the probable source of the interference event.
4.1 Very strong interference event in GPS L1
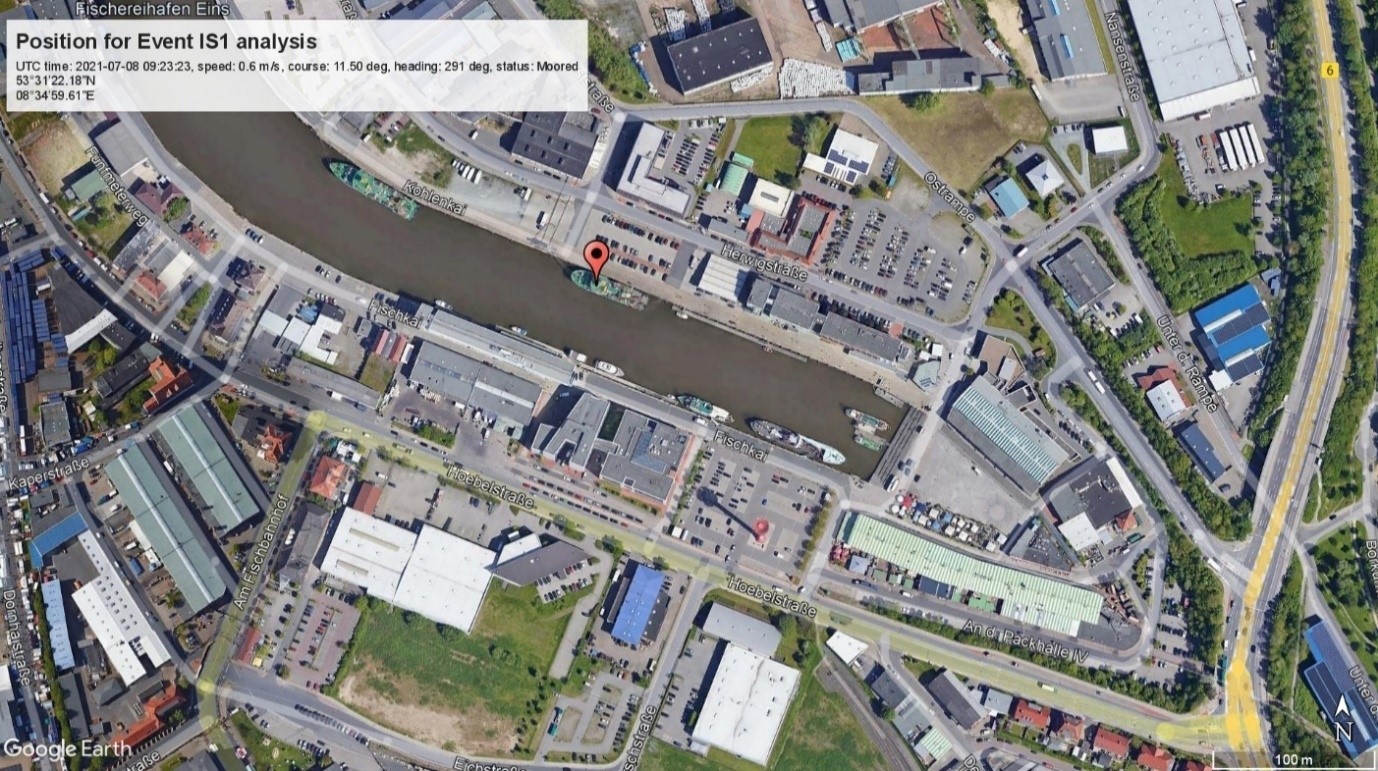
On July 8, 2021 at 08:23:27 UTC, the GALANT platform detected a very strong interference signal that raised the nominal input power on 13.4 dB (see the second point above 5 dB in Fig. 8). According to the automatic identification system (AIS) data from the BSH ship, the latter was moored on the Fischereinhafen Eins port in Bremerhaven (Germany) the entire July 8, as depicted on Fig. 15.
Following the pre-correlation processing described in Section 3.2, the computations of the signal’s spectrogram, PSD, and digital samples evolution in time (Fig. 16) indicate that the interference was caused by a wideband chirping signal, i.e. a signal whose frequency increases in time following some determined law by the signal generator. As to the wideband aspect of the signal, it is so classified due to its large spread around the carrier frequency of the GPS C/A L1 signal, perceivable on the PSD (Fig. 16 bottom left). As it will be better seen later, wideband interference was the most efficient form of jamming in saturating the receivers and making it lose signal quality or even tracking of the satellites.
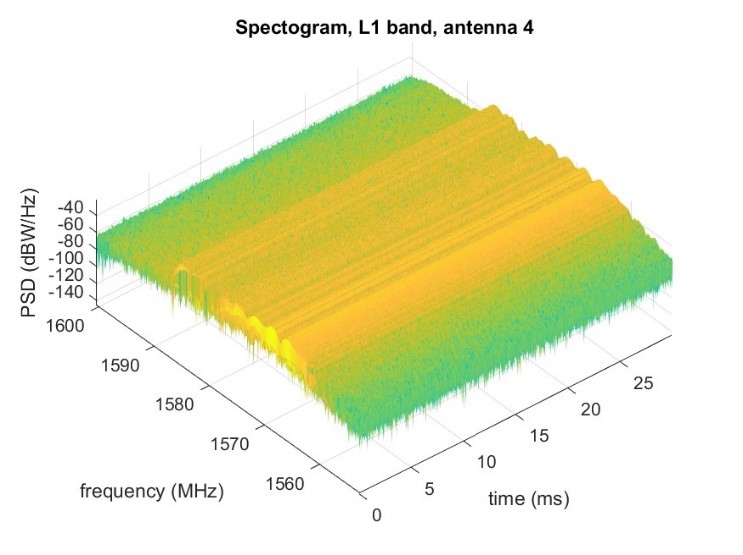
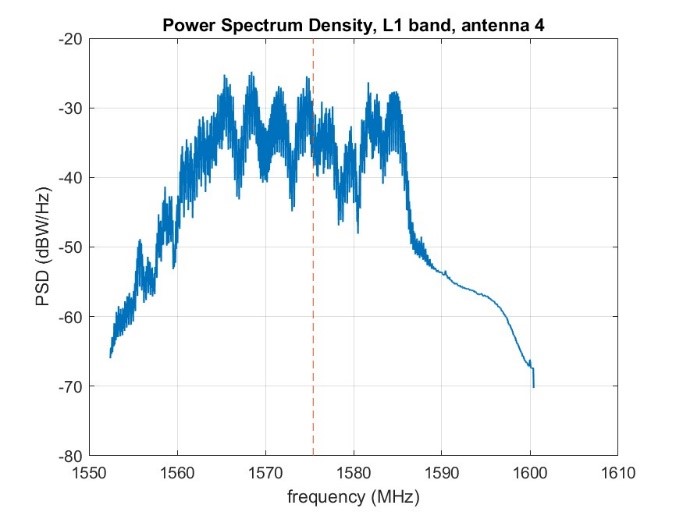
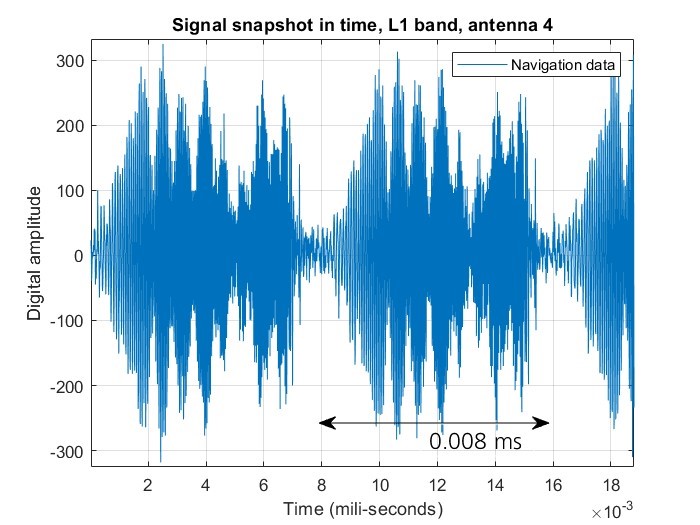
The most affected antenna by the interference signal was antenna element 4, and for this reason the analysis is performed on the signal recorded from this antenna channel. The duration of the even was short lasting approximately for 100 seconds, indicated by snapshots with detected interference (again via the statistical technique described in Section 3.1.1) before and after the snapshot. During the event the most affected antennas were elements 4, 5 and 3, identified by the plot of the instant power increase on Fig. 17.
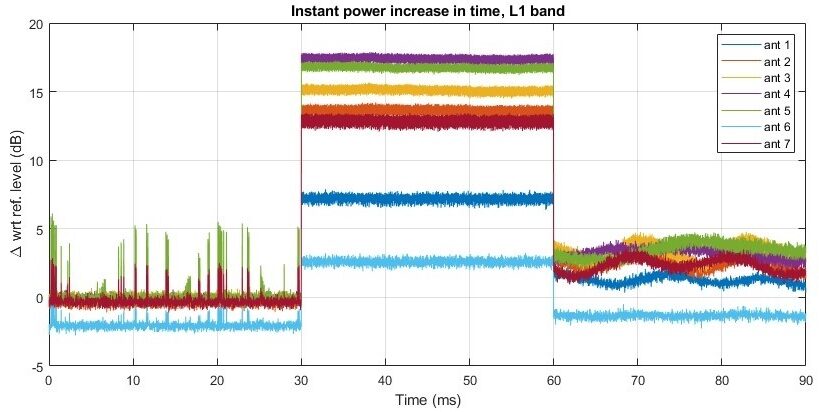
Following the antenna channels power profile, the position of the ship, and the heading angle (the latter two information provided by the AIS data) the DoA of the interference signal can be estimated, and in this way the position of hot spots regarding interference sources could be tracked in multiple days of strong events. Whenever the ship was moored, the DoA would point towards the city, and whenever the ship was on the sea, it would point to the coasts.
Regarding the impacts of the interference event on the receiver, the best way to assess it is by analyzing the satellites acquisition and the respective C/N0 of the signal. For this end, the post-correlation procedures (described in Section 3.2.2) was conducted with DLR software using the recorded data. In the case of this event, no satellite could be acquired, which demonstrates the aforementioned effectiveness of the wideband interference, making the receiver blind to all satellites in the visible constellation.
4.2 DME/TACAN interference in GPS L5
Differently to the case with GPS L1/Galileo E1, the GPS L5/Galileo E5a band is shared with ARNS systems. In the months of the measurement campaigns using the dual-frequency GALANT platform, the receiver recorded many instances of interference caused by the DME/TACAN system (Ostemeier, 2009). Since these are official systems, their structures are well known in the literature (Gao, 2007), and the methods to mitigate them as well.
On Fig. 18 the time-frequency signal waveforms are depicted from an actual case of interference. As it is the case with the effectiveness of wideband interference signals in L1, it is also true that the frequency sparse (and well located) structure of the DME/TACAN signal doesn’t pose a big threat. Still, if not tackled, DME/TACAN interferences can become a nuisance to the GNSS receivers, being responsible for disturbances that can affect navigation capabilities.
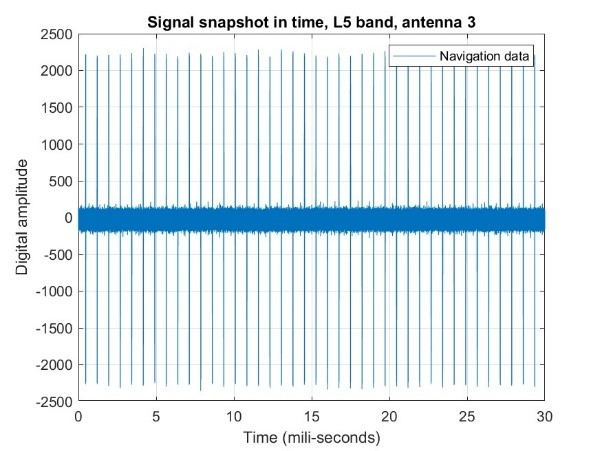
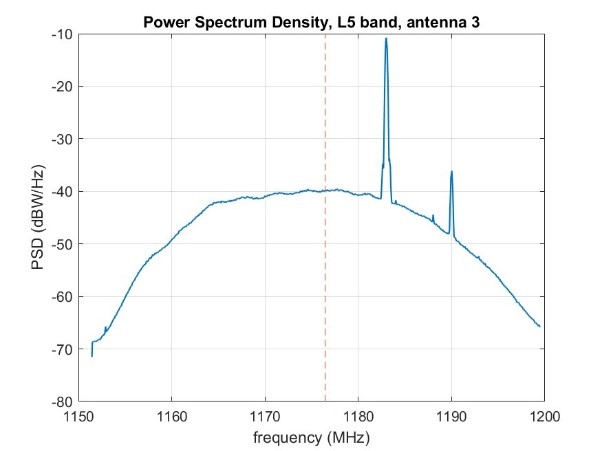
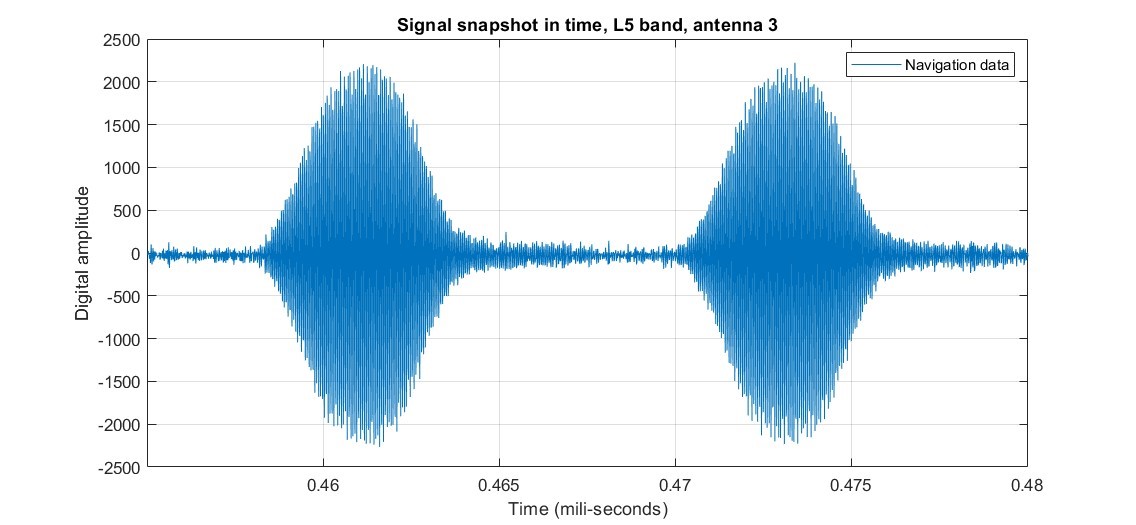
spectrum of TACAN signal (b) and DME mode-X pulse pair in TACAN signal (c).
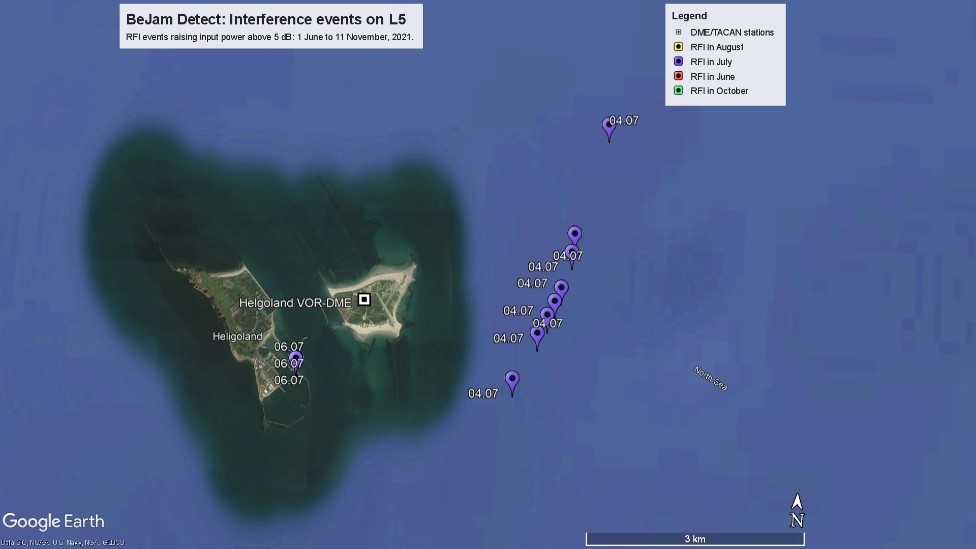
The majority of the strongest interference events in L5 were caused by DME/TACAN signals, and as such, their source could be traced back to the DME/TACAN base stations located around the areas where the BSH ship navigated and the AIS at the respective time of the interference detection, with one example reproduced on Fig. 19 when the ship was constantly under the influence of a VOR (Very High Frequency Omnidirectional Range) -DME station in the Heligoland island. As mentioned before, these are official non-malicious systems whose intended purpose is solely to aid the navigation of airplanes when taking-off, approaching and landing.
4.3 Geographical overview of RFI events
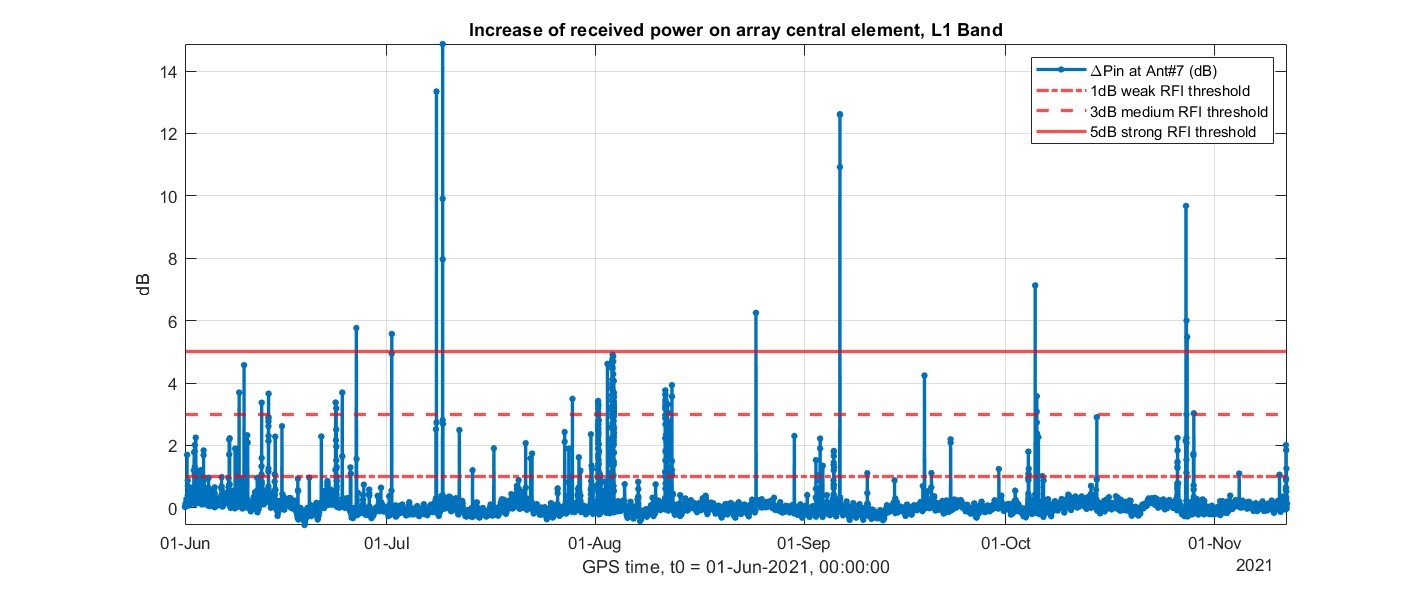
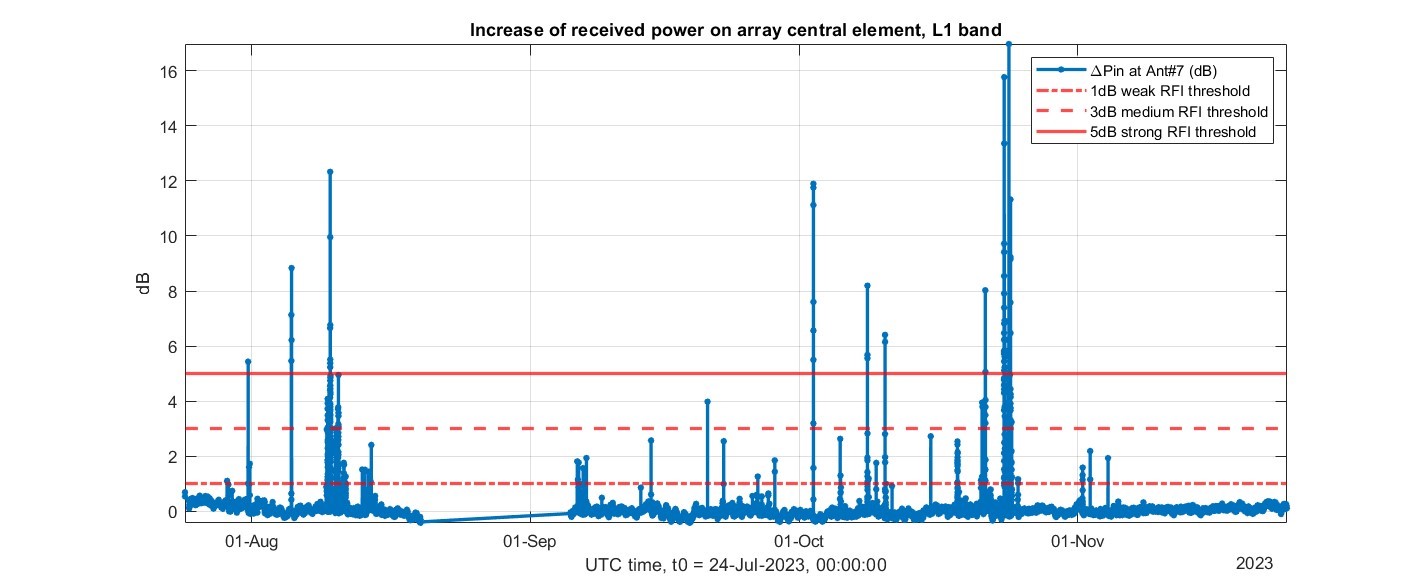
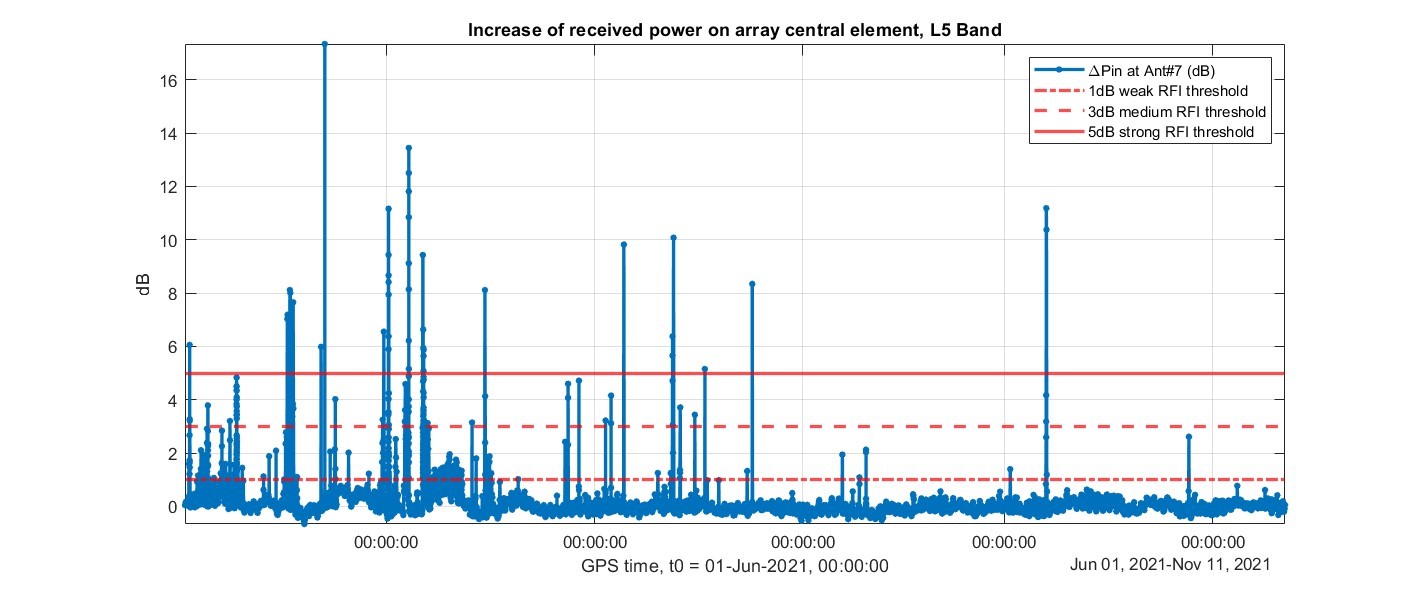
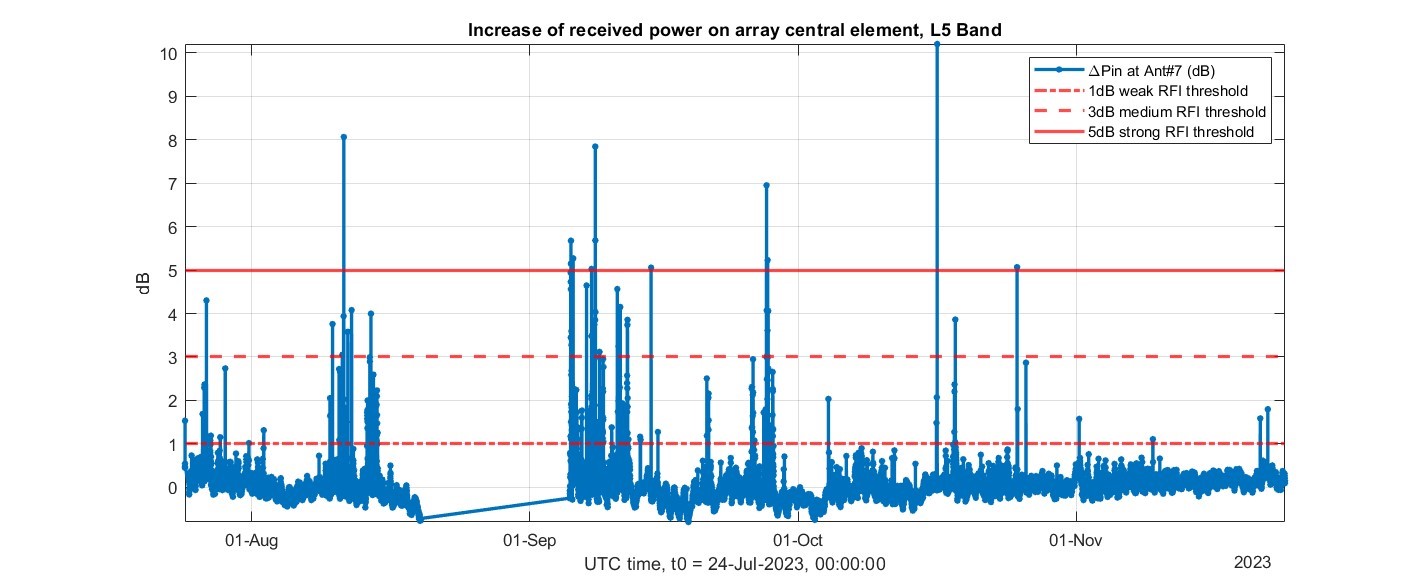
In the pre-correlation processing, the power increase of the top array element with respect to the nominal levels (as described in Section 3.2.1) was profiled throughout the measurement campaigns. They provide the time distribution of the interference events throughout the months of the campaigns, which allows to investigate how active RFI sources in determined times of the year. On Fig. 20 are reproduced the power profiles with time in the GPS L1 band, whereas on Fig. 21 are depicted the profiles in the GPS L5 band. The reason behind the gaps in the 2023 profiles in both L1 and L5 are due to a power shortage that turned off the monitoring system.
It is noticeable the wide power fluctuation of the interference events with time, indicative of the different type and sources of the interference signals. Very strong interference is rarer, but as the example analysis in Section 4.1 demonstrated, the risk is also related to the interference signal spectrum overlapping the navigation signal spectrum. In this way, even weaker interference events can still be dangerous.
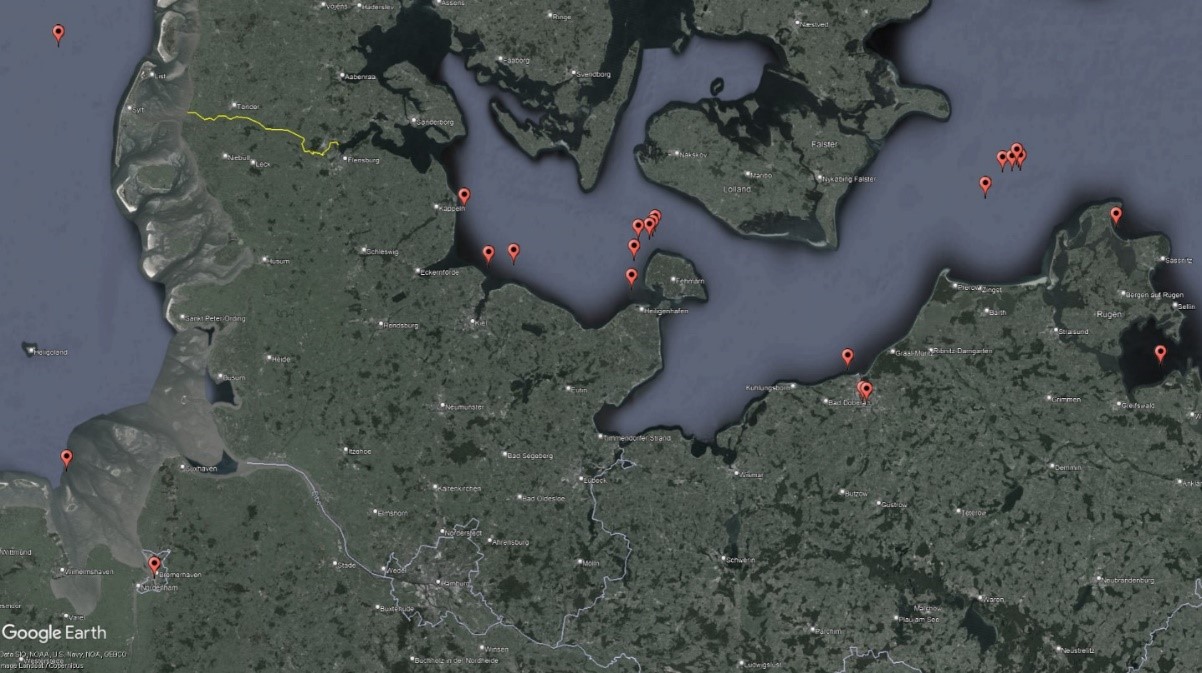
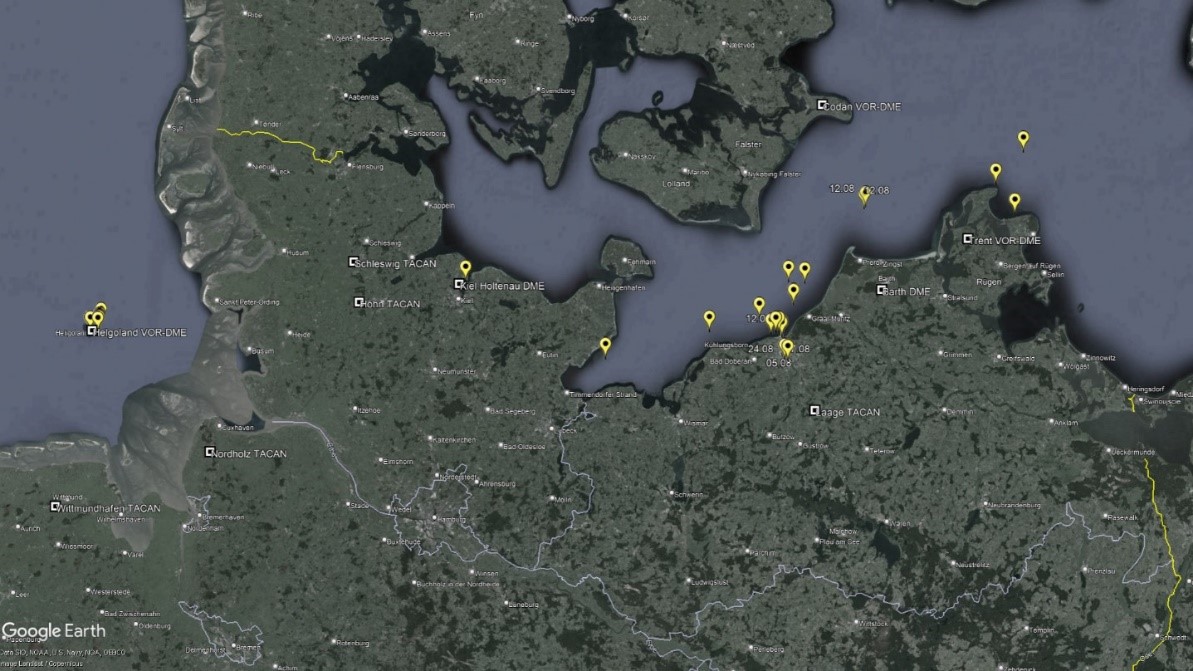
Finally, using the RFI recordings and the AIS data of the ship, it was possible to also identify the geographical distributions of the most relevant RFI events in L1 and in L5 bands during the measurement campaigns, reproduced on Figs. 22 and 23 to provide geographical knowledge on the most affected areas in the Baltic and North Seas. On both maps each point does not necessarily represent a single event, but might refer to a cluster of several events in the same location.
The North Sea was not so much affected during the measurement campaigns as the Baltic Sea, in which the incidence of relevant interference events was most prominent in different areas: harbors, canals, and in waters, especially closer to the coasts. Although many interference cases have been observed far from the coast, the impact of these events on the receiver was not significant. In the special case of L5 there is, in addition to all of these hotspots, the geographical correlation of frequent relevant events and the proximity to DME/TACAN stations.
5 Conclusions
The capacities of the GALANT platforms for monitoring RFI were presented: how they detected signals, recorded them, and displayed the real-time situation for live monitoring of the GNSS frequency bands and the occurrence of interference events. Among over 5000 detections in each band, many relevant events were identified and analyzed, demonstrating capacity to visibly disturb navigation systems, and sometimes even to cause denial-of-service. These concerning events could be traced back to specific areas of frequent occurrence: mostly close to the costs around the paths of the ships, in areas around harbors when the ships were moored, and in the vicinity of base stations of legitime and official systems that can nonetheless interfere with GNSS, such as DME/TACAN. In the open sea, the further the ships were to the surrounding coasts, the smaller was the frequency of RFI events, and also the weaker they were.
The power profile in time was very diverse but still featured considerable occurrences of strong events. Although not the only parameter to determine the capacity to damage receivers, the stronger the interference signal, the stronger is the disturbance. Also diverse were the signal types: continuous-wave, wideband signals similar to personal privacy devices (PPDs), pulsed signals with determined duty-cycle, out-of-band signals mostly caused by defects in non-malicious systems, and others. The majority of the events did not cause big impacts, however there have been some situations of complete loss of navigation capacity, and in many other times navigation was considerably disturbed, which could last uninterruptedly for more than 10 minutes as it happened several times, for more than one hour as in some occasions, or even during most of the day. The most dangerous signals were strong wideband chirps, because they naturally sweep the frequency band around the GNSS signal, making it easier for their spectrum to overlap. The scene is not static, varying in months and years, thus it needs to be monitored in order to track concerning evolutions of the situation, and the developed prototypes were proven to be suitable for this task.
Acknowledgements
The research results reported in the paper have been obtained in the project BeJamDetect funded by the German Federal Maritime and Hydrographic Agency (BSH). The interference measurement campaigns have been carried out by using ships of BSH and German Federal Maritime Police. This support is greatly acknowledged. The authors would also like to express their sincere gratitude to Friederike Fohlmeister of DLR for her valuable contributions enabling to set up the project and shape the structure of the research.
References
Akos, D. M. (2012). Who’s Afraid of the Spoofer? GPS/GNSS Spoofing Detection via Automatic Gain Control (AGC). NAVIGATION: Journal of the Institute of Navigation, 59(4), pp. 281–290.
Antreich, F., Wendler, F., Iliopoulos, A., Appel, M., Sgammini, M., Caizzone, S., Konovaltsev, A., Troetschel, F., Marinho, M. and Cuntz, M. (2015). Robust Multi-Antenna GNSS Receiver for Maritime Applications. DLR Kongress, 2015/9.
Appel, M., Iliopoulos, A., Fohlmeister, F., Pérez Marcos, E., Cuntz, M., Konovaltsev, A. and Meurer, M. (2019). Experimental validation of GNSS repeater detection based on antenna arrays for maritime applications. CEAS Space Journal, 11(1), pp. 7–19. https://doi.org/10.1007/s12567-018-0232-6
Bhatti, J. and Humphreys, T. E. (2017). Hostile Control of Ships via False GPS Signals: Demonstration and Detection. Navigation, Journal of the Institute of Navigation, 64, pp. 51–66.
Braasch, M. S. and Van Dierendonck, A. J. (1999). GPS Receiver Architectures and Measurements. Proceedings of the IEEE, January, pp. 48–64.
C4ADS (2019). Above us only Stars: Exposing GPS Spoofing in Russia and Syria. Technical Report of Center for Advanced Defense Studies. Washington, DC, USA.
Cuntz, M., Denks, H., Konovaltsev, A., Hornbostel, A., Dreher, A. and Meurer, M. (2008). GALANT-Architecture Design and First Results of A Novel Galileo Navigation Receiver Demonstrator With Array Antennas. Proceedings of the 21st International Technical Meeting of the Satellite Division of The Institute of Navigation (ION GNSS 2008), pp. 1470–1477.
Dimc, F., Bažec, M., Borio, D., Gioia, C., Baldini, G. and Basso, M. (2017). An Experimental Evaluation of Low-Cost GNSS Jamming Sensors. Navigation: Journal of The Institute of Navigation, 64(1), pp. 93–109.
Dovis, F. (2015). GNSS interference threats and countermeasures. Artech House.
Duchet, D. and Berz, G. (2018). GNSS RFI Mitigation: International Efforts to Protect Aviation. EUROCONTROL. Miami, In Presentation at the 58th Civil GPS Service Interface Committee Meeting.
Dumville, M. (2018). Initial Findings from the STRIKE3 GNSS Interference Monitoring Network. https://www.gps.gov/governance/advisory/meetings/2018-05/dumville.pdf (accessed 10 July 2024).
European Union Agency of Space Programme (n.d). European GNSS Service Centre. https://www.gsc-europa.eu/gsc-products/almanac (accessed 03 July 2024).
Gao, G. X. (2007). DME/TACAN Interference and its Mitigation in L5/E5 Bands. Proceedings of the 20th International Technical Meeting of the Satellite Division of the Institute of Navigation (ION GNSS 2007), pp. 1191–1200.
Gerrard, N., Rødningsby, A., Morrison, A., Sokolova, N. and Rost, C. (2021). GNSS RFI monitoring and classification on Norwegian highways–an authority perspective. Proceedings of the 34th International Technical Meeting of the Satellite Division of The Institute of Navigation (ION GNSS+ 2021), pp. 864–878.
Grant, A., Williams, P., Ward, N. and Basker, S. (2009). GPS Jamming and the Impact on Maritime Navigation. The Journal of Navigation, April, p. 15.
Groves, P. D. (2005). GPS Signal-to-Noise Measurement in Weak Signal and High-Interference Environments. Navigation, 52(2), pp. 83–94.
Günther, C. (2014). A survey on spoofing and counter-measures. Navigation: Journal of the Institute of Navigation, 3(61), pp. 159–177.
Heckler, M. V., Cuntz, M., Konovaltsev, A., Greda, L. A., Dreher, A. and Meurer, M. (2011). Development of robust safety-of-life navigation receivers. IEEE Transactions on Microwave Theory and Techniques, 59(4), pp. 998–1005.
IMO (2018). E-Navigation Strategy Implementation Plan – Update 1, MSC. 1/Circ. 1595, 25 May 2018. London, UK.
Jada, S., Bowman, J., Psiaki, M., Fan, C. and Joerger, M. (2022). Time-Frequency Analysis of GNSS Jamming Events Detected on US Highways. Proceedings of the 35th International Technical Meeting of the Satellite Division of The Institute of Navigation (ION GNSS+ 2022), pp. 933–946.
Konovaltsev, A., Caizzone, S., Yinusa, K., Sgammini, M., Marcos, E. P., Appel, M., Cuntz, M., Elmarissi, W. and Meurer, M. (2017). Interference detection and characterization with an array based GNSS receiver using conformal antennas in maritime environments. Proceedings of the 30th International Technical Meeting of The Satellite Division of the Institute of Navigation (ION GNSS+ 2017), pp. 2795–2811).
Konovaltsev, A., Kaelberer, U., Sgammini, M. and Meurer, M. (2009). GBAS RF interference detection threshold determination at Palermo airport. Atti dell’Istituto Italiano di Navigazione, December, pp. 45–55.
Liu Z., Lo S., Walter T. and Blanch J. (2023). GNSS Interference: Getting to the Source. Inside GNSS Media & Research LLC. https://insidegnss.com/gnss-interference-getting-to-the-source/ (accessed 11 September 2024).
Medina, D., Lass, C., Marcos, E. P., Ziebold, R., Closas, P. and García, J. (2019). On GNSS jamming threat from the maritime navigation perspective. 2019 22th International Conference on Information Fusion (FUSION), pp. 1–7. https://doi.org/10.23919/FUSION43075.2019.9011348
Morales-Ferre, R., Richter, P., Falletti, E., De La Fuente, A. and Lohan, E. S. (2019). A survey on coping with intentional interference in satellite navigation for manned and unmanned aircraft. IEEE Communications Surveys & Tutorials, 22(1), pp. 249–291.
Motella, B. and Lo Presti, L. (2014). Methods of goodness of fit for GNSS interference detection. IEEE Transactions on Aerospace and Electronic Systems, 3(50), pp. 1690–1700.
National Telecommunications and Information Administration (2016). United States Frequency Allocation Chart. https://ntia.gov/page/united-states-frequency-allocation-chart (accessed 13 April 2023).
Ostemeier, J. (2009). Test of DME/TACAN Transponders: Application Note, s.l.: Rohde and Schwarz.
Pérez-Marcos, E., Konovaltsev, A., Caizzone, S., Cuntz, M., Yinusa, K., Elmarissi, W. and Meurer, M. (2018). Interference and spoofing detection for GNSS maritime applications using direction of arrival and conformal antenna array. Proceedings of the 31st International Technical Meeting of The Satellite Division of the Institute of Navigation (ION GNSS+ 2018), pp. 2907–2922).
QZSS (2024). List of Positioning Satellites. https://qzss.go.jp/en/technical/satellites/index.html#GPS (accessed 6 September 2024).
Raghuvanshi, A., Bisnath, S. and Bond, J. (2024). Analyzing GNSS RFI Events in Canada. Inside GNSS, January 2024, pp. 34–41.
SkAI-Data-Services (2023). Live GPS Spoofing Tracker Map. https://spoofing.skai-data-services.com/ (accessed 10 July 2024).
Sokolova, N., Morrison, A. and Diez, A. (2022). Characterization of the GNSS RFI Threat to DFMC GBAS Signal Bands. Sensors, 22, p. 17.
Tabatabaei Balaei, A., Motella, B., Dempster, A. G. and Rizos, C. (2007). Mutual effects of satellite signal quality and satellite geometry on positioning quality. s.l., s.n.
Thombre, S., Bhuiyan, M. Z. H., Eliardsson, P. and Gabrielsson, B. (2017). GNSS Threat Monitoring and Reporting: Past, Present, and a Proposed Future. The Journal of Navigation, 71, p. 17.
U.S. Department of Homeland Security (n.d). Navigation Center. https://www.navcen.uscg.gov/gps-nanus-almanacs-opsadvisories-sof (accessed 03 July 2024).
Wiseman, J. (2022). GPSJAM, Daily maps of GPS interference. https://gpsjam.org/ (accessed 10 July 2024).
Authors’ biographies

Thiago Azevedo de Vasconcelos obtained his bachelor’s and master’s degrees in Telecommunications Engineering in 2018 and 2020, respectively, from the Brazilian Federal University of Ceará, where he developed research in physically consistent array processing for mobile communication systems. In February 2022 he joined the Institute of Communications and Navigation of the German Aerospace Center (DLR), where he is working with signal processing algorithms of GNSS receivers. His current research interests are in GNSS interference detection and mitigation.

Lothar Kurz studied Electrical Engineering and obtained his Diploma Degree in 2007 from RWTH Aachen University. Since then he was working as a scientist for the Chair of Electrical Engineering and Computer Systems (EECS) at RWTH Aachen University. In 2017 he joined the Institute of Communication and Navigation at the German Aerospace Center (DLR). His research interests are in GNSS signal processing and embedded receivers.

Andriy Konovaltsev received his engineer diploma and the Ph.D. degree in electrical engineering from Kharkov State Technical University of Radio Electronics, Ukraine in 1993 and 1996, respectively. He joined the Navigation Department of the Institute of Communications and Navigation of the German Aerospace Center (DLR) in 2001 where he is now a senior researcher and leads a team working on the signal processing techniques of GNSS receivers. His main research interest is in application of adaptive antenna arrays for improving performance of satellite navigation systems in challenging signal environments.

Tobias Ehlers studied Electrical Engineering at the University of Applied Sciences in Lübeck, Germany, graduated as Dipl.-Ing. in 2002. In 2003 he joined the Federal Maritime and Hydrographic Agency of Germany (BSH) and worked in the MARNET division as engineer for the development and maintenance of un-manned scientific measurement buoys in the Baltic and North Sea. Later on, he joined the Shipping Department and became a senior engineer in the BSH laboratory for positioning systems. His activities comprise type approval testing, standardization in IMO, IEC and CEN as well as research & development for the enhancement of navigation systems..

Michael Meurer received the diploma in electrical engineering and the Ph.D. degree from the University of Kaiserslautern, Germany. After graduation, he joined the Research Group for Radio Communications at the Technical University of Kaiserslautern, Germany, as a senior key researcher, where he was involved in various international and national projects in the field of communications and navigation both as project coordinator and as technical contributor. From 2003 till 2013, Dr. Meurer was active as a senior lecturer and Associate Professor (PD) at the same university. Since 2006 Dr. Meurer is with the German Aerospace Centre (DLR), Institute of Communications and Navigation, where he is the director of the Department of Navigation and of the center of excellence for satellite navigation. In addition, since 2013 he is a professor of electrical engineering and director of the Chair of Navigation at the RWTH Aachen University. His current research interests include GNSS signals, GNSS receivers, interference and spoofing mitigation and navigation for safety-critical applications.