

Abstract
1 Introduction
The International Hydrographic Organization (IHO) has developed the S-100 Universal Hydrographic Data Model to modernize and enhance the exchange and use of hydrographic data. The S-100 standard uses ISO 8211 (file interchange format), HDF5 and Geography Markup Language (GML) encoding formats and is a framework for the development of dependent product specifications. S-101 is the new product specification for Electronic Navigational Charts (ENCs), which will replace S-57, the standard data format currently used for digital hydrographic data. S-101 offers many improvements; for example, it is fully machine-readable, it supports data that are more complex, it makes updating ENC data easier, and provides dynamic under-keel clearance (Mellor, 2023). S-102 is for bathymetric surfaces and S-122 encodes marine protected areas as some further examples of product specifications. Hydrographic offices and industry are currently working towards the transition to S-100, a huge shift for hydrographic data, particularly for Electronic Chart Display and Information Systems (ECDIS). In 2026, S-100 data are available for ECDIS and new ECDIS systems are required to be compatible with S-100 by 2029 (Navtor AS, 2022). The advantages of the S-100 model are that it complies with ISO (International Organization for Standardization) standards, is machine readable, and will provide global consistency (IHO, 2022).
Although the S-100 model makes many advancements, there is still the problem that ECDIS needs to support multiple projections for the display of ENCs. According to the Performance Standards for Electronic Chart Display and Information Systems (ECDIS) published by the International Maritime Organization (IMO), ECDIS requires that positional data be referenced to the WGS 84 or PE-90 geodetic datum (IMO, 2022). However, the Performance Standards do not specify any projections and many ECDIS manufacturers use one projection for lower latitudes and one for Polar Regions where distortions become severe. Another challenge relating to ENCs that is present in S-57 and S-101 is that no uniform gridding system has been implemented. ENCs are divided into cells (files) so that the ECDIS system is able to load and unload cells as necessary while navigating and make updating easier (Palikaris & Mavraeidopoulos, 2020). Many hydrographic offices still base ENC cells on paper chart boundaries, or have their own gridding systems for ENCs, which consist of square cells based on latitude and longitude. In both cases, gridding systems do not match at borders between countries, and Polar Regions present exceptional challenges. IHO working groups, among others, have discussed the idea of implementing a uniform system on multiple occasions in the past.
A global spatial indexing system for S-101 data was proposed in a discussion paper from the 18th IHO Transfer Standard Maintenance and Application Development Working Group (TSMAD) meeting in 2009. The paper proposed a C-squares indexing system using numbered squares measured by latitude and longitude. Advantages of implementing a global spatial indexing system are listed in the paper, including, having a common system and standardized structure not tied to any national scheme. Advantages of the C-squares indexing system are that it can be extended indefinitely to any resolution, and is efficient for data storage and searching (Pharaoh, 2009). A second paper from the 12th Worldwide ENC Database Working Group Meeting (WENDWG12) in February 2022 reports on the progress of the ENC Scheming Guidelines Drafting Group. The drafting group was established at WENDWG11 to do a feasibility and impact study on new grid-based schemes for ENCs. The following important factors to consider when developing a gridding scheme were determined: interoperability, overlap, number of ENC cells, flexibility of the arrangement, and maintenance (JHOD, 2022). At the 12th Arctic Regional Hydrographic Commission Meeting (ARHC12) in September 2022, IIC Technologies presented results from the Arctic Grid Project. The project proposed three candidates for a grid scheme for the Arctic region, one of which was a DGGS (Pritchard, 2022).
Discrete Global Grid Systems (DGGS) are a type of spatial reference system in which the globe is divided into nested layers of polygon shaped cells. DGGS offers the same advantages as C-squares (and a uniform system) and does not depend on latitude and longitude, which introduces distortions, particularly in the Polar Regions. The use of DGGS for S-100 will be investigated and discussed in this article. The concept of DGGS has been around for a long time, but the Open Geospatial Consortium (OGC) recently published it as an international standard in 2017. In 2021, the OGC conducted a pilot project, with the goal of enhancing marine spatial data infrastructure, which focused on the IHO S-122 standard for marine protected areas. As part of this project, a data server that ingests S-122 data and uses DGGS was developed (Japan Hydrographic and Oceanographic Department, 2022). Open source DGGS implementation tools and software exist and the BSH’s endeavor to produce a test DGGS dataset is presented.
2 Discrete Global Grid Systems
A Geographic Information System (GIS) is a computer system for storing, analyzing, and displaying spatial data. Multiple data layers can be imported, and overlaying these layers helps understand patterns and relationships in the data (National Geographic, 2024). There are two common formats of GIS data, vector (points, lines and polygons) and raster (grids of rectangular cells). Before analysis can be performed on data layers, they need to be converted to a common format. Maps created from GIS require a projection to transform coordinates on Earth’s curved surface to a flat area. Map projections always a have a distortion in either shape or size, or both. The authors of the article ‘Geospatial Operations of Discrete Global Grid Systems – a Comparison with Traditional GIS’ suggest three issues with traditional GIS (Li & Stefanakis, 2020). First, when performing an overlay analysis in GIS, the different spatial data layers are stored in separate files and therefore are not vertically integrated and associated with a location. Second, in GIS software it is necessary to use a projection to visualize the Earth’s surface on a flat screen. This causes distortions that the viewer needs to interpret. Third, GIS analysis is typically performed at a single resolution level and it is not efficient to scale the data or store many layers of the data at different scales. The use of Discrete Global Grid Systems can address these three issues.
As defined by the OGC, “a Discrete Global Grid System is a spatial reference system that uses a hierarchical tessellation of cells to partition and address the globe” (OGC, 2023). A DGGS contains a “spatio-temporal referencing by zonal identifiers and functions for quantization, zonal query, and interoperability” (Gibb, 2021). The OGC Abstract Specification Topic on DGGS (Gibb, 2021) describes the terms used to define a DGGS. Tessellation refers to the partitioning of the globe into equal-area polygons, so that the globe is completely covered by the polygons and there is no overlap of the polygons. The polygons are referred to as cells, when discussing the geometry, or zones as the containers for storing data. One tessellation of cells is referred to as a discrete global grid. A Discrete Global Grid System contains many levels of discrete global grids with different cell sizes. The process of subdividing cells to form a tessellation of smaller cells is called cell refinement. The refinement ratio, or aperture, is the ratio of the number of cells in one tessellation to the number of cells in the immediate next tessellation level with the next largest cell size (parent cell to children cells). It is not necessary for children cells to be uniquely covered by a single parent cell (Alderson et al., 2020). Hierarchical refers to the organization or numerical order of the refinement levels of discrete global grids based on their decreasing cell size. Fig. 1 shows two examples of DGGS.

To construct the initial tessellation, a regular polyhedron is scaled so that its vertices touch an ellipsoidal (or spherical) earth model, and the vertices are joined with arcs on the ellipsoid. The tessellations shown in Fig. 1 were constructed from the regular polyhedron icosahedron, and the icosahedron is visible under the tessellation on the left. The tessellation on the left was constructed exactly as described above. The tessellation on the right was constructed from a truncated icosahedron, meaning that hexagons fill the triangular faces and pentagons cover the flattened vertices. Different orientations of the icosahedron are possible. Common approaches are to align vertices with the poles, symmetrical placement about the equator, or orient the icosahedron so that no vertex touches land (SOU, 2024).
The zones are identified with a unique spatio-temporal reference called a zonal identifier. The zonal identifier is an index, a label or code that indicates a position or time period or both. The indexing of DGGS is very efficient and makes for rapid calculations on data in the grid. Quantization is the process of how data get into the grid. Quantization functions assign data to zones. Different strategies exist for quantization, and it is possible to integrate vector and raster data for example. A zonal query function uses zonal identifiers to specify geometry and retrieve data from a zone. Spatial Relation Operations are used for cell navigation. Examples of relation operations are finding a cell’s parent cell or finding all cells from a smaller tessellation that are covered by a certain cell (Li & Stefanakis, 2020). Interoperability functions are used to transfer data from a DGGS externally. “Information recorded about phenomena at a location can be easily referenced to the explicit area of the associated cell, integrated with other cell values, and provides statistically valid summaries based on any chosen selection of cells. With equal area partitioning, spatial analysis can be replicated consistently anywhere on the Earth independent of resolution or scale (Gibb, 2021).”
Conventional global coordinate reference systems (such as latitude/longitude) currently used in GIS software, work well for navigation, which is what they were originally designed for. But, because one degree of longitude, does not represent the same distance everywhere on the globe, uncertainties and distortions are present when producing analyses or visualizations. Many of these uncertainties and distortions can be eliminated with DGGS, which uses equal area cells that represent the earth in a uniform way. DGGS are designed for information, to support data storage, processing, analysis, transmission, and visualization. With DGGS, layers of spatial data can be integrated by location, meaning vector and raster data can both be integrated in the DGGS grid and analyzed together without converting formats. Additionally, scalability is built into the DGGS system, meaning data can be easily viewed and analyzed at multiple resolutions (Li & Stefanakis, 2020).
3 State of the art
The OGC is an international organization of geospatial experts from various fields that work together to innovate and develop open standards for geospatial data. OGC’s mission is to make location information FAIR – Findable, Accessible, Interoperable, and Reusable (OGC, 2023). OGC developed an international standard for DGGS consisting of structural and functional requirements, published in 2017 (OGC, 2017). The standard was later published as an ISO standard, ISO 19170, in 2021 (ISO, 2021; Alderson et al., 2020). Additionally, OGC develops Application Programming Interface (API) standards designed to provide and access geospatial data on the web, which have been widely implemented. A draft OGC API for accessing data organised according to Discrete Global Grid Systems is currently under development (OGC, 2023).
Although limited, open-source software solutions exist for DGGS implementation, and researchers and companies have begun using DGGS for GIS analysis. The authors of ‘Geospatial Operations of Discrete Global Grid Systems – a Comparison with Traditional GIS’ (Li & Stefanakis, 2020) made an in-depth comparison of available DGGS implementation software. They discuss the DGGS operations currently required by the OGC’s Discrete Global Grid Systems Abstract Specification and extended operations that are currently supported by traditional GIS and are foreseen to be developed for DGGS in the future. The basic functions are: quantization operations, spatial relation operations, and interoperability operations. The extended operations discussed in the article are: database techniques, data pre-processing and manipulation, spatial analysis and data interpretation, data computation, and data visualization. Only some basic functions have been implemented in the DGGS software available today. Four examples of DGGS implementation software that are available open-source are presented below. They are: HEALPix, geogrid, DGGRID, and H3. Then, two examples of analysis performed with open-source DGGS are described.
HEALPix is a DGGS implementation that was developed to support the analysis of very large multi-frequency satellite derived datasets at a high resolution (HEALPix Team, 2019). Three properties of HEALPix allow the execution of Fourier analysis with spherical harmonics on the sphere, and not be too slow. These properties are: a hierarchical structure, equal area cells, and an iso-latitude distribution of the cells, meaning the cell centres are located on rings of constant latitude. (Górski et al., 2022). The grid is based on an octahedron with its points at the north and south poles. Diamonds cover the four vertices at the equator and the eight faces. To construct each finer resolution grid, each face is split into four diamonds. HEALPix is available in the following program languages: C, C++, Fortran90, IDL, Java and Python; and offers many features, including: generation and query of the DGGS, manipulation of satellite datasets, spherical harmonics transformations, and visualization (HEALPix Team, 2019).
The DGGS implementation geogrid was developed at Heidelberg University and allows the generation and handling of the Icosahedral Snyder Equal Area Aperture 3 Hexagon (ISEA3H) Discrete Global Grid System (Mocnik, 2021). ISEA3H is a projection that maps the icosahedron onto the sphere. Aperture 3 is the refinement ratio, or in other words, the number of children cells per parent cell. Hexagon is the cell shape (Sahr et al., 2013). geogrid is programmed in Java and includes the following functions: translation of coordinates to grid cells, indexing, cell geometry calculations and visualization.
DGGRID is another example of an open-source DGGS implementation. DGGRID allows the generation and manipulation of icosahedral discrete global grids (Sahr, 2024). It is possible to specify the following parameters to create a customized DGGS: the orientation of the base icosahedron, the projection used to transfer the base icosahedron edges onto the sphere, the cell shape (hexagon, triangle, or diamond), the aperture, the resolution, and the earth radius (Sahr, 2023). Kevin Sahr wrote DGGRID in C++, and based on this library; Richard Barnes developed an R package, dggridR, with much of the same functionality (Barnes & Sahr, 2017). Barnes intends dggridR to be used for spatial statistics, as it allows binning in evenly sized cells instead of using a rectangular grid based on latitude and longitude, which introduces distortions.
H3, Uber’s hexagonal hierarchical spatial index, is a DGGS implementation developed by the ride-sharing and food delivery company for their specific purposes, and made available open-source (Brodsky, 2018). The H3 grid, shown in Fig. 2, was constructed from a truncated icosahedron, where pentagons cover the twelve vertices, and ten (partial) hexagons cover each of the twenty faces. The base level grid (resolution 0) has 110 hexagonal cells and 12 pentagon cells. The area of the hexagon cells within one resolution differ based on their distance to the pentagon cells. The ratio between the minimum and maximum area of cells within one resolution is nearly 2 (Uber, 2024) and the area of the pentagons is close to the area of the smallest hexagons. There are sixteen resolution levels, the largest have an average area of 4 million square kilometers and the smallest 0.9 square meters. The grid is positioned on the globe so that the pentagons are centered over water, to avoid pentagons in Uber’s use of analysing drivers and riders across a city and be able to cluster cells to represent neighbourhoods (Brodsky, 2018). H3 was written in C and bindings are available for Java and Python. The basic functions available are indexing, transforming latitude and longitude coordinates to cell addresses, locating neighbouring cells, and representing movement between cells.

The author of ‘Discrete Global Grid Systems as scalable geospatial frameworks for characterizing coastal environments’ did an analysis of coastal temperature data, aggregating and interpolating the data in a hexagonal DGGS using both the H3 Python library and the dggridR R package (Bousquin, 2021). The paper identified advantages of using a hexagonal grid compared to a square grid. First, with a hexagonal grid, the centroids of each cell are equidistant to the centroids of all neighbouring cells, which is an advantage for path analysis. Second, because a hexagon more closely resembles a circle, when point datasets are aggregated there is less bias from edge effects. One disadvantage of hexagonal DGGS is that child cells are not uniquely covered by one parent cell and the amount of overlap depends on the aperture (Bousquin, 2021). Bousquin identified an advantage of H3; neighbours of a cell can be determined directly from the cell index and do not need to be stored in a separate table. The authors of ‘Integrating the Who, What, and Where of U.S. Retail Center Geographies’ used H3 for an analysis of retail centres in the United States (Ballantyne, Singleton, Dolega and Macdonald, 2022). Three datasets, more than three million retails places points and their building footprints, and retail land-use polygons from OpenStreetMap, were aggregated to an H3 grid at resolution 11. Major retail centres, defined as having more than fifty retail places within neighbouring cells were extracted. An R package, h3jsr, for spatial operations on H3 DGGS was used for the analysis on characteristics of retail centres. This research is an example where DGGS was successfully used in place of traditional GIS methods.
4 Federated Marine Spatial Data Infrastructure Pilot Phase II
The Federated Marine Spatial Data Infrastructure (FMSDI) Pilot Phase II is an OGC Innovation Program initiative with the objective of enhancing Marine Spatial Data Infrastructures (MSDI), to better understand MSDI maturity, and to demonstrate the power of FAIR data in the context of the marine environment (Taleisnik & Idol, 2022). The goal of the initiative was to transform and interoperate with S-100 data, using S-122 as the example. First, Marine Protected Area (MPA) data were transformed into S-122 and served through OGC APIs, then the IHO and OGC standards and how the standards influence the interoperability and usage of MPA data were investigated, and finally, a roadmap for MSDI development was created. The initiative is described in an OGC Engineering Report.
The Marine Protected Area Product Specification IHO Publication S-122 (IHO, 2019) was produced by the IHO Nautical Information Provision Working Group (NIPWG) to encode the extent and relevant information of MPAs for use in ECDIS. The United Nations Convention on the Law of the Sea (UNCLOS) identifies categories of Marine Protected Areas and places a general obligation on states to implement measures to protect the marine environment. A Marine Protected Area is an area of the ocean, including the water, flora, fauna and features, reserved to protect the enclosed environment. MPAs can be located in territorial waters, the exclusive economic zone, or even international waters. The S-122 Product Specification is a feature-based vector product based on the S-100 General Feature Model (Taleisnik & Idol, 2022). Participants of the initiative (IIC Technologies, Pelagis, Helyx Secure Information Systems Ltd., The University of Calgary, and Compusult) demonstrated seven server and client components. The servers ingested MPA data (and in some cases, other data) in the Baltic and North Seas from various sources, and transformed it to S-122. The clients served the data through OGC APIs, and displayed outputs to end users.
IIC Technologies demonstrated one Baltic/North Sea Server. Pelagis and Helyx Secure Information Systems Ltd. each demonstrated clients designed to ingest data from the server (from various sources). IIC Technologies and the University of Calgary demonstrated two Data Fusion Servers that ingest various datasets. Data Fused Clients were demonstrated by Compusult and Pelagis. The server demonstrated by IIC Technologies was designed to ingest MPA data from various sources, transform it to S-122, and offer it through an OGC API. The MPA data were provided in shapefile and Web Feature Service (WFS) format and were first reduced to PostGIS database tables, then the fields were mapped individually to the S-122 fields and a custom tool used for the transformation. Many MPA have borders along the shoreline, and shorelines often have a high point density. Therefore, downloading from the server and viewing so many vertices was challenging. Using a DGGS would improve performance because MPAs could be efficiently partitioned to the grid. The MPA polygons would need to be partitioned according to the grid system, downloaded, and pieced together again. Some grid cells would have partial coverage so a data coverage concept would be necessary. The University of Calgary’s Fusion Server published data processed into an Icosahedral Snyder Equal Area Aperture 3 Hexagonal (ISEA3H) DGGS. The server ingests coverage data and vector data from different sources, and these data are mapped together into a hierarchy of hexagonal cells. A GeoJSON encoding was used for the data and they were delivered using an Environmental Data Retrieval (EDR) API accessed via Web Coverage Services (WCS). The use of DGGS is still in the experimental stage and what data structure to use to deliver the data is unknown, but an extension of WCS could be an option. Clients requesting location data from the server need knowledge of the DGGS geometry. Additionally, the data structure needs to support the functionality to search the data, which so far has not been implemented, but could possibly be done with Common Query Language (CQL).
The Engineering Report makes suggestions to add a number of new attributes to the S-122 model and discusses potential solutions to the challenges encountered with DGGS. A major difficulty with DGGS is that clients accessing data stored in DGGS need to know how to decode cell location information, meaning that they need to be able to translate the DGGS geometry to coordinates. Additional developments that would be beneficial include, support for temporal extents, and the possibility to query by tessellation level. The servers and clients developed for the Pilot project used a GeoJSON encoding instead of the GML that is used in the S-122 standard. The reason stated in the report for using GeoJSON is because of the interoperability of the format and wide adoption and support in mapping software (Taleisnik & Idol, 2022). Further, the report discusses challenges between the S-122 standard and the GeoJSON encoding. The report recommends the use of ISO 19152 for more complex restrictions and suggests adding new attributes to the S-122 model.
Phase III of the pilot builds on the work accomplished during phase II. The goal of phase III was to enhance MSDI and advance the implementation of open data standards through use cases on the integration of marine and terrestrial data in the Arctic. One of the participants, the University of Calgary, contributed a Discrete Global Grid System server and another participant, Ecere Corporation, implemented a DGGS client interacting with this server. An ISEA3H DGGS was used to integrate elevation, land cover, population, ship lanes, MPA and additional data to model and visualize three sub-scenarios – coastal erosion, flooding, and navigational hazards. Results, challenges encountered during the development and lessons learned are detailed in the OGC Engineering Report on phase III (Thomas & Saeedi, 2023).
5 Investigation
This section presents the investigation into DGGS done by the BSH (German Federal Maritime and Hydrographic Agency). It describes the production of an S-122 dataset and shows the conversion of the S-122 Marine Protected Areas to a DGGS. Additionally, it discusses a comparison of DGGS grid cells and finally it provides a summary of the investigation.
5.1 S-122 dataset production
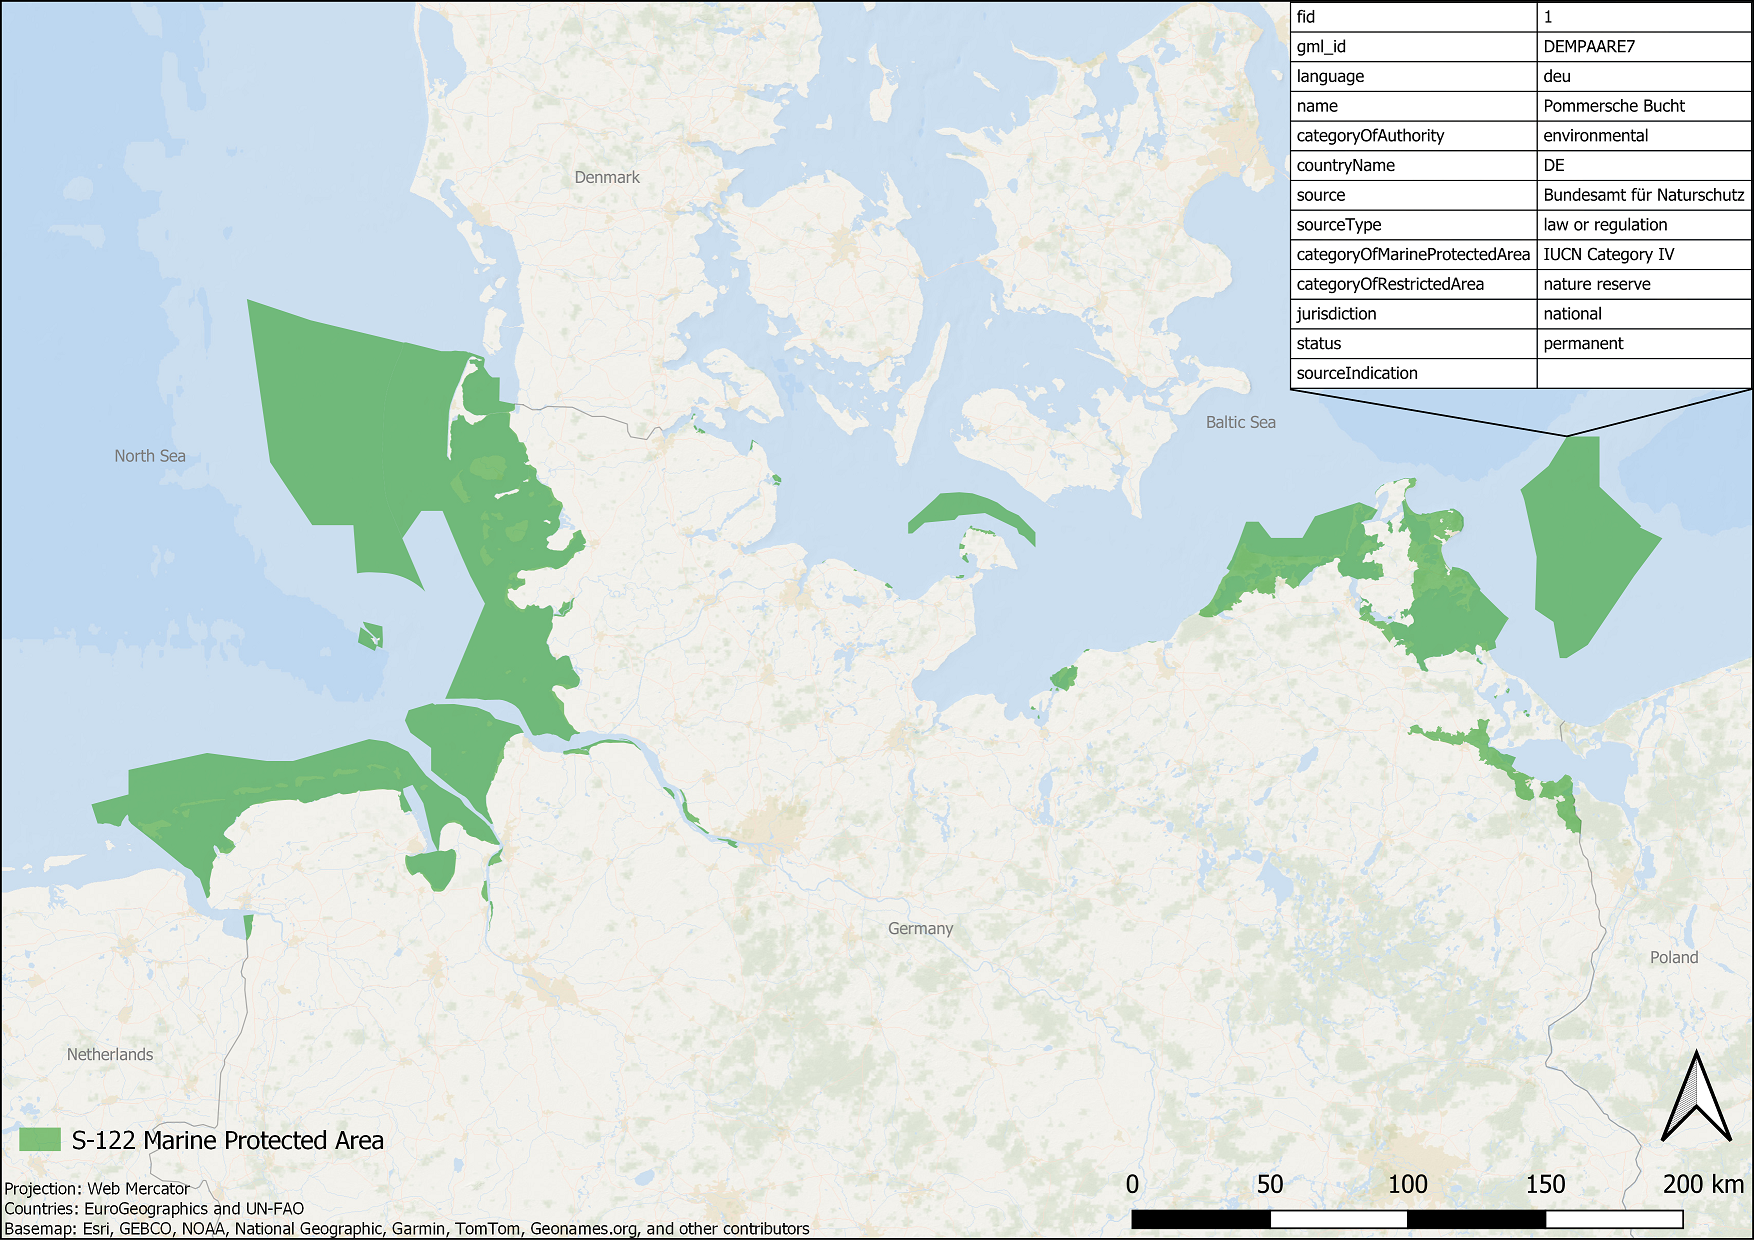
The BSH has produced a test S-122 dataset of Marine Protected Areas (MPA) within the German Exclusive Economic Zone (EEZ). The S-122 data were produced from the existing S-57 feature RESARE (Restricted Area) data in BSH’s primary production tool CARIS Hydrographic Production Database (HPD), and Marine Protected Area data from the International Union for Conservation of Nature (IUCN) downloaded from Protected Planet. The data were imported to QGIS in shapefile format. Errors in the IUCN data were first cleaned up, and then both datasets were imported to an SQLite database and a table was created to represent S-122 attributes. Additional tables were created and filled for RestrictedArea, DataCoverage, Authority, ContactDetails, Applicability, and Regulations. A Python script was used to generate the S-122 GML from the SQLite database. Finally, the output GML was validated against the S-122 schema in XMLSpy. Fig. 3 shows the Marine Protected Areas encoded in the S-122 test dataset. The data encoded for the area Pommersche Bucht is displayed in the table in the top right corner of the map.
5.2 Converting S-122 data to DGGS
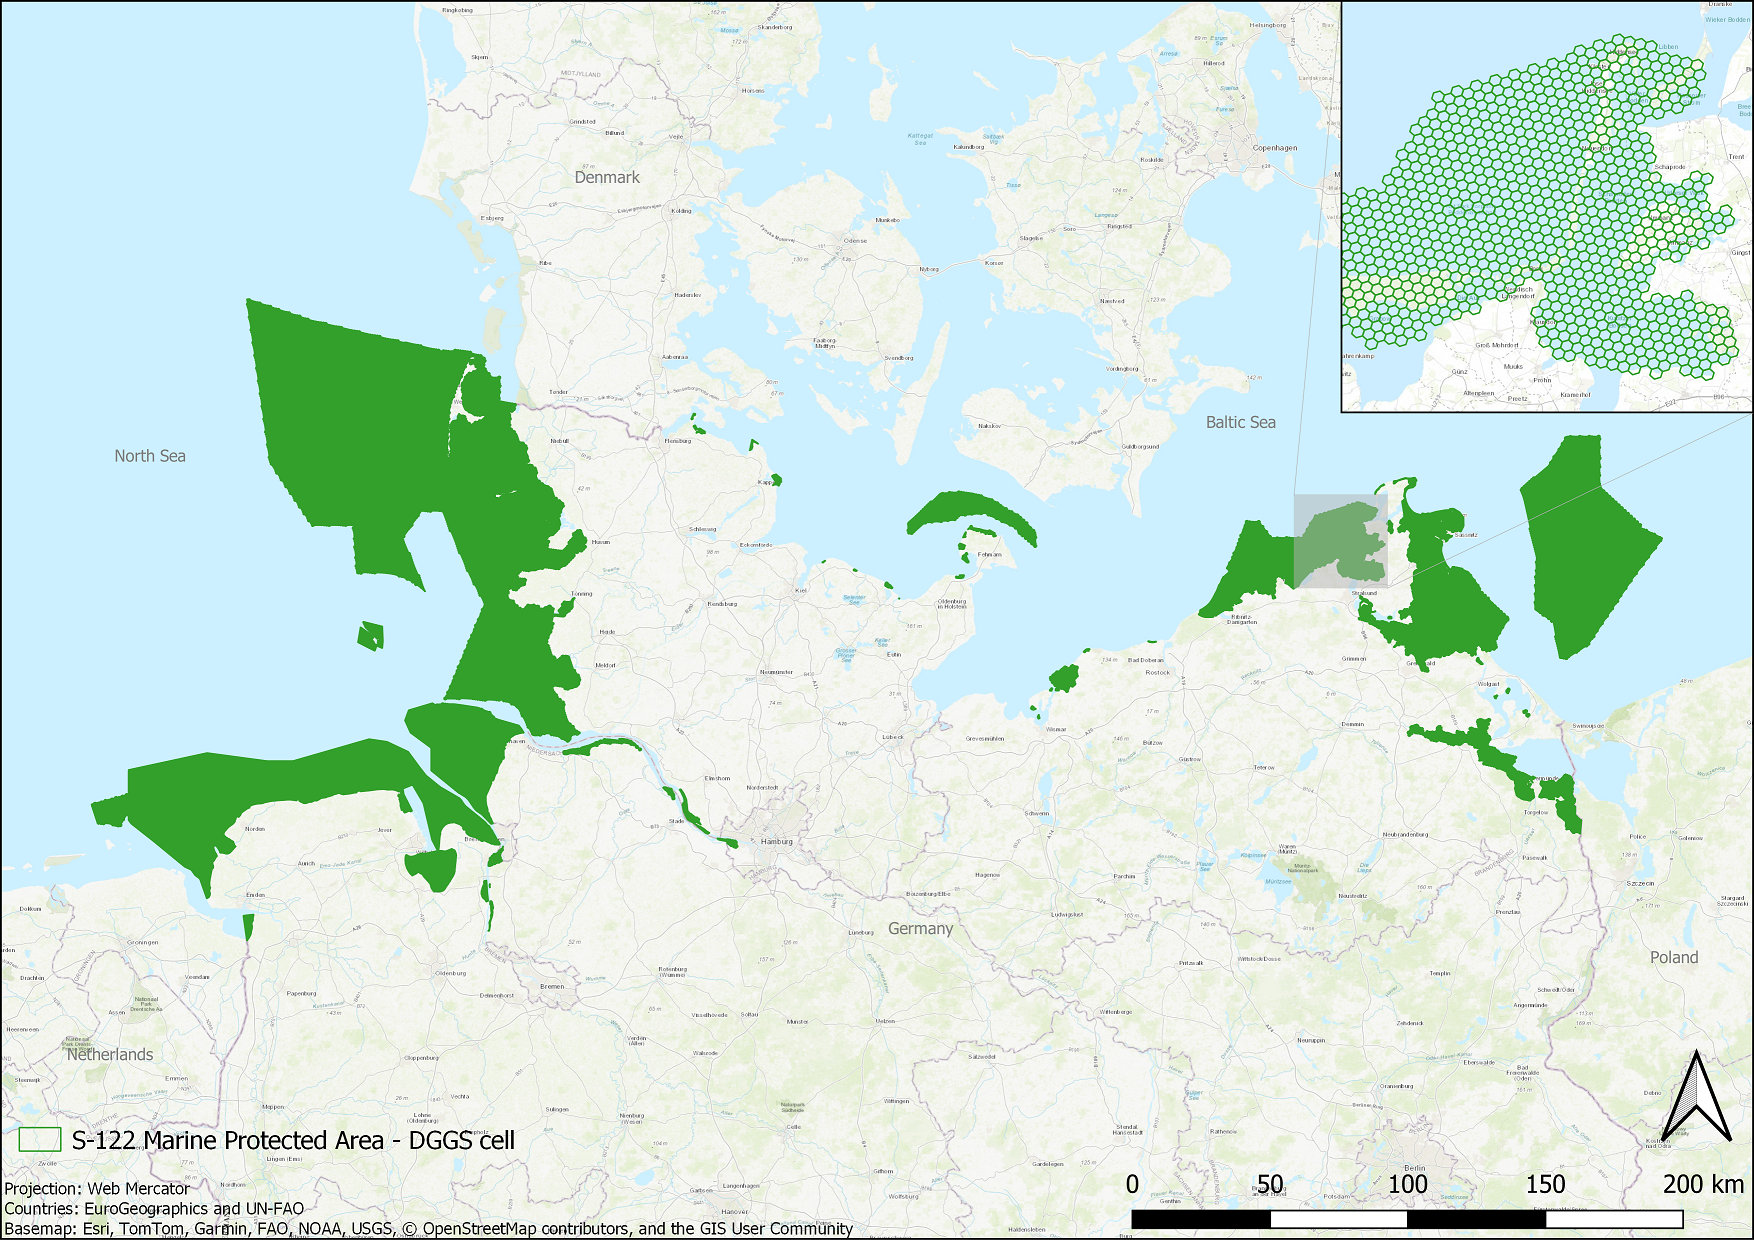
To test the feasibility of using DGGS for S-100 data, the Marine Protected Area data were organized according to a DGGS. Uber’s DGGS implementation H3 Python binding was used for the investigation because Python is accessible and interoperable with BSH processes and therefore using H3 was quick and efficient for producing some test data. H3 uses hexagonal cells with aperture 7 and all basic DGGS operations are implemented. However, H3 is optimized for land data; but the purpose here was to test how DGGS data work, not to present a permanent solution of a DGGS grid for hydrographic data. The MPA polygons were transformed to groups of hexagonal cells using the polygon_to_cells function. Cell resolution 8 was used which has an average cell area of 0.7 km2 (Uber, 2024). Because no visualization operation has so far been built into the DGGS functionality, the hexagonal cells must be converted to traditional GIS polygons and exported to a common GIS file format in order to produce a map of the data. This process is very slow because of the large number of small hexagonal polygons now making up the original areas. Therefore, a smaller DGGS cell size was not feasible for the scale of the whole German EEZ. A smaller cell size is, however, not necessary at this scale. When comparing Fig. 3 above of the MPA GML polygons and Fig. 4 below showing the MPA data arranged to a DGGS, at this scale it is not possible to see the edges. In the zoom window in the top right of the map below it is possible to see that the MPA areas are made up of many small hexagons and the boundary has changed slightly to match the hexagon pattern.
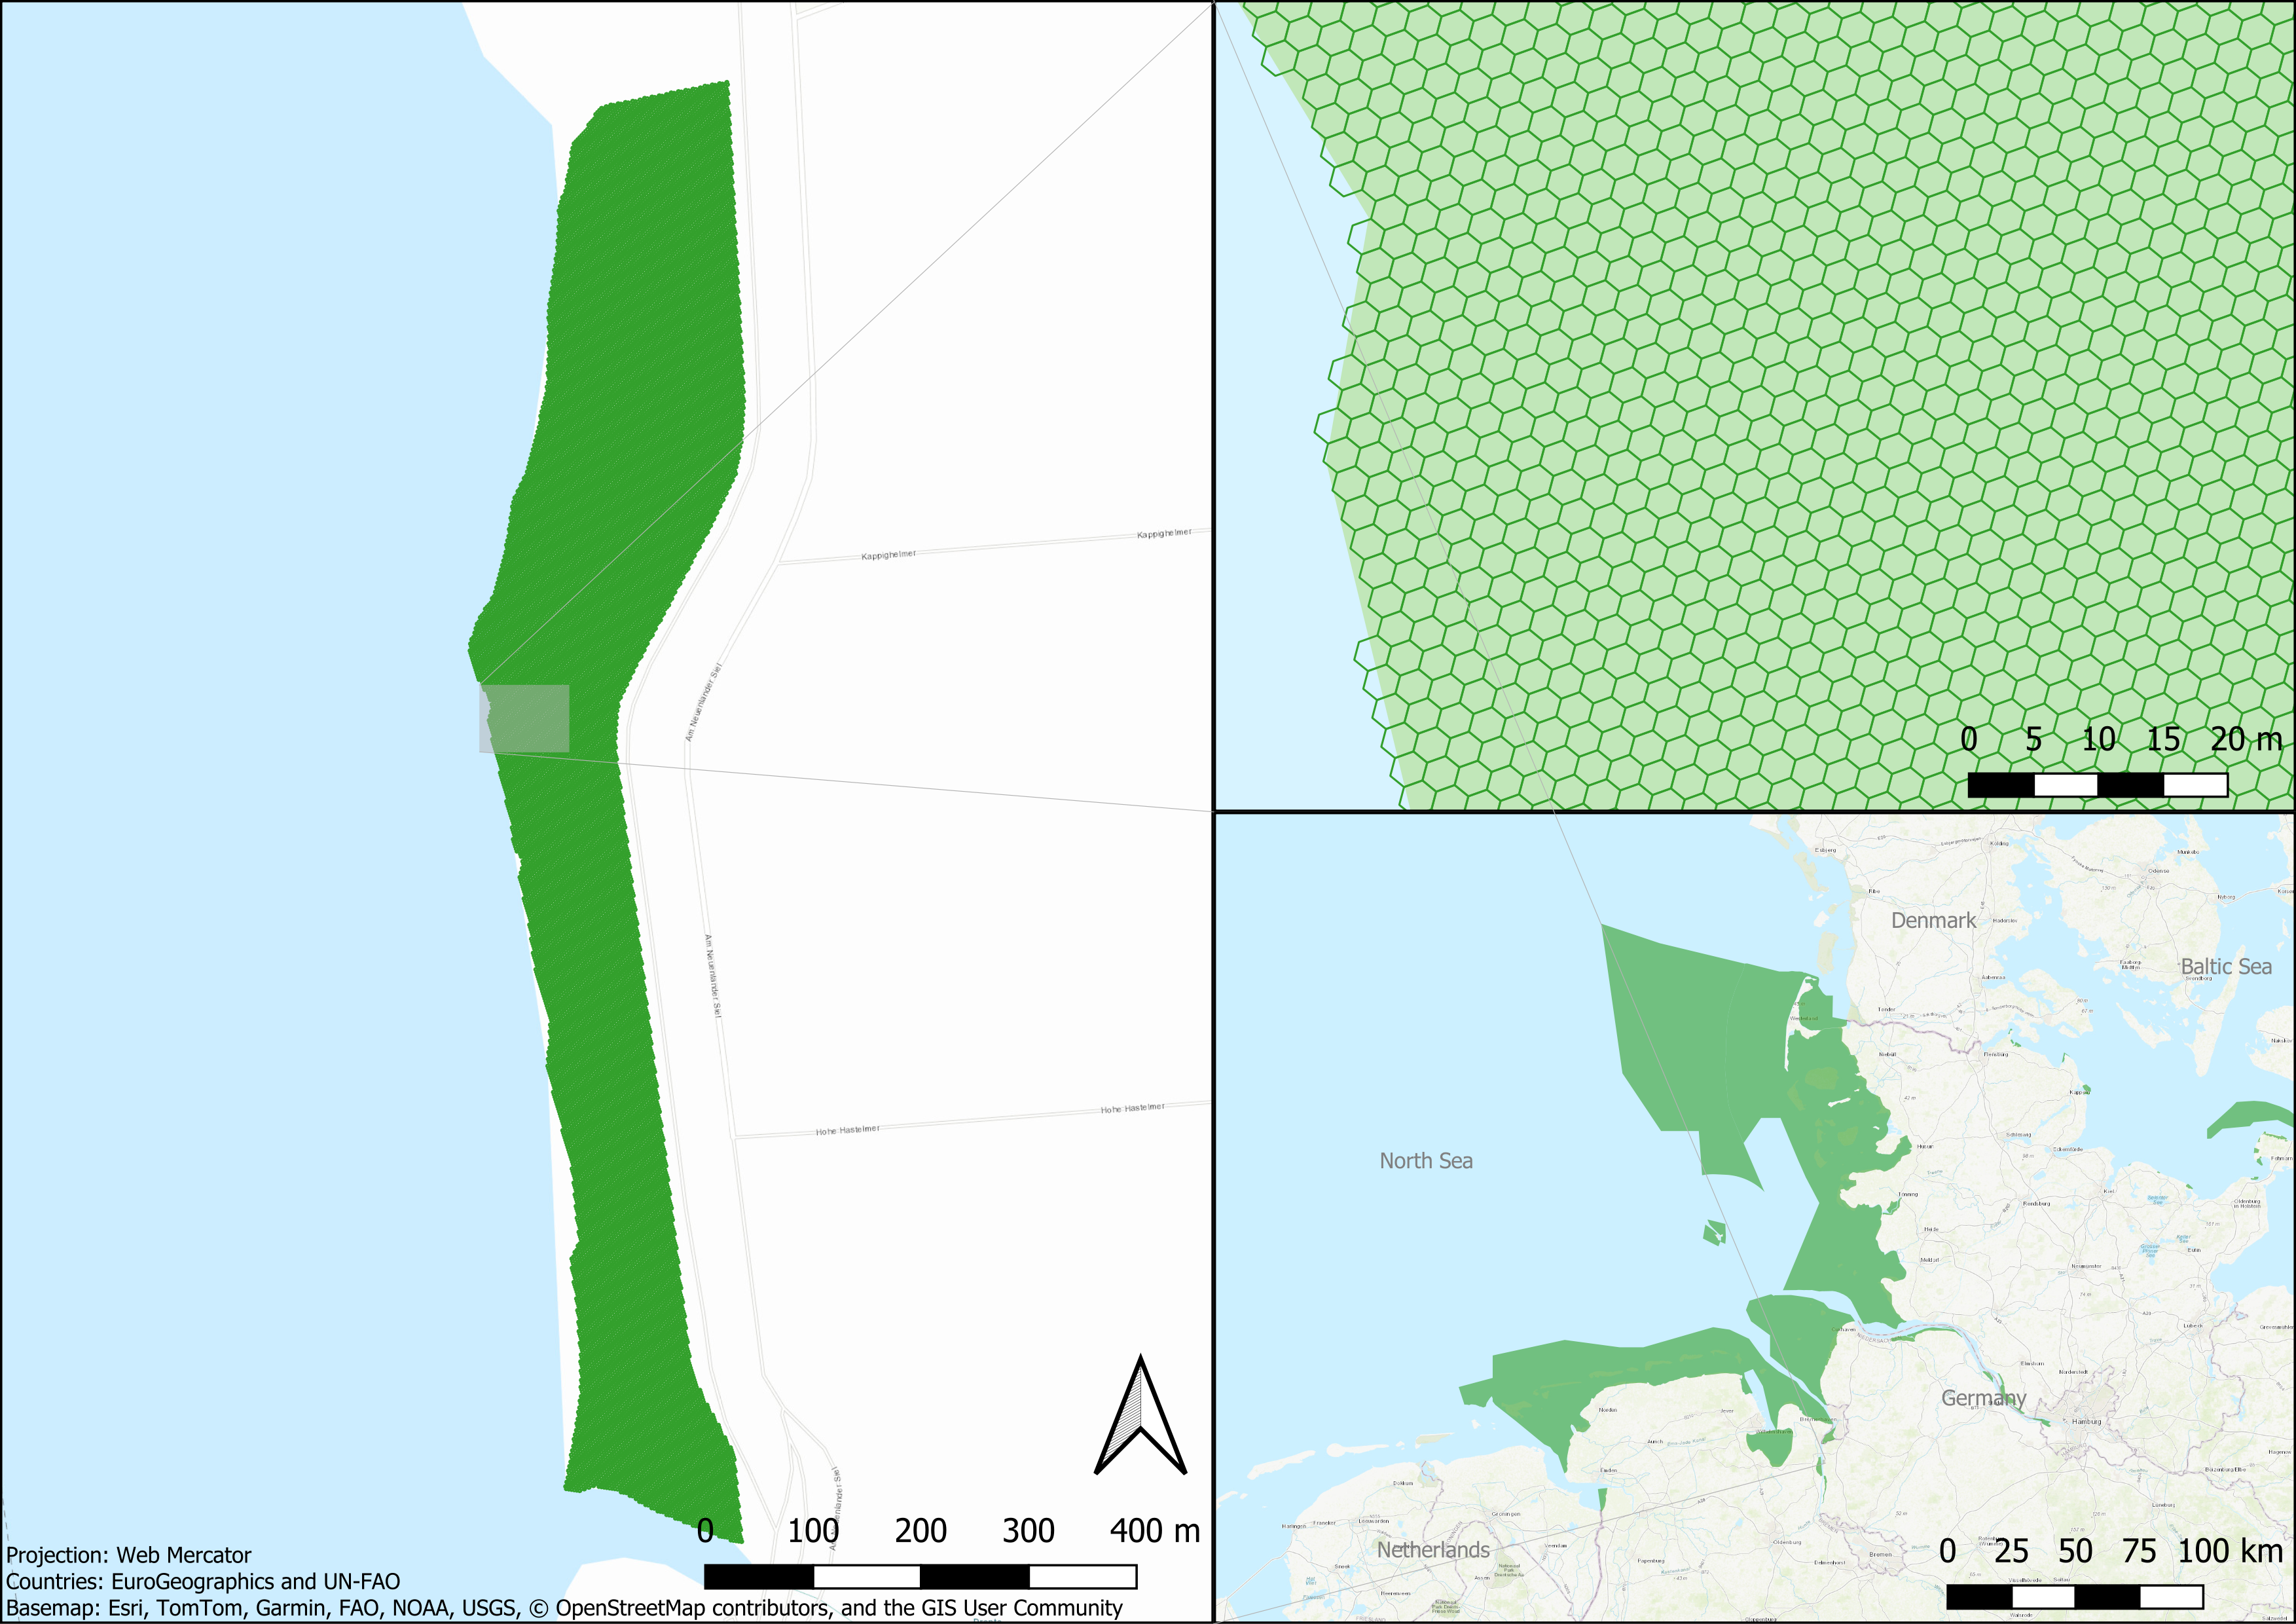
The highest resolution possible with H3 is resolution 15, which has an average cell size of 0.9 m2. The second highest resolution possible, resolution 14, has an average cell area of 6.3 m2 (Uber, 2024). The smallest MPA in the S-122 test dataset, Neuenlander Außendeich, was converted to DGGS at resolution 14. The area is approximately 150 m by 1,000 m. It is shown in Fig. 5 below on the left. In the overview map on the bottom right, the area is nearly not even visible on the River Weser south of Bremerhaven. On the top right is a zoom of a small area where the individual hexagons are visible and the polygon area from the S-122 GML dataset is displayed underneath so that the differing edge border is visible. At resolution 14, the maximum difference of the edge location between the original polygon and the DGGS is approximately 1.5 m. The original polygon covers an area of 173,996 m2 and the DGGS area covers 174,010 m2. This is a difference of 14 m2 or 0.008 % of the original polygon area. It would need to be considered whether this change of the MPA boundary is acceptable at a certain scale, whether the legally defined limits of the MPA should not be modified at all, or whether an extension of the MPA to match the hexagonal grid, while ensuring the entire MPA is contained, would be acceptable.
5.3 Modelling DGGS grid cells
DGGS can be a system for organizing data layers, but also has the benefit that because DGGS consists of (almost) equal area cells around the globe, including in the Polar Regions, it could be used for an Electronic Navigational Chart (ENC) gridding system and the same system could be used everywhere. Fig. 6 shows the three largest cell sizes of the H3 DGGS (resolution 0, 1 and 2 with corresponding approximate average cell areas 4 million km2, 610,000 km2 and 87,000 km2; Uber, 2024). There are sixteen resolutions in H3 and the smallest has an average cell area of 0.9 km2. Therefore, the scalability of the cell sizes would be beneficial for different ENC cell sizes for different scales. Again, H3 is just used here as an example, but any DGGS would offer the same scalability option and could be optimized for the specific purpose of ENC cells. On the left is an orthographic projection that shows how the hexagons look on the globe and the (almost) equal area of the cells is visible. On the right, a Mercator projection is used, which is a typical projection used for navigation. Here the distortions are present and become extreme near the poles. As a comparison, a 10° latitude by 10° longitude grid is shown below in Fig. 7. In the orthographic projection on the left, it is clear that as the lines of longitude converge at the poles, the cells become narrower towards the poles, however, in the Mercator projection, these cells appear much larger. When cells sizes are not equal, the distortions from the Mercator projection are much harder to interpret.


5.4 Summary
The BSH successfully transformed an S-122 test dataset to DGGS. Although, because visualization is not implemented in H3, the hexagons need to be exported to traditional GIS format and viewed in GIS software or a web map, but this is very slow for many small hexagons because traditional GIS software has no knowledge of DGGS yet. Exporting polygons as dissolved areas of hexagons would be more efficient. It is difficult to show the advantages of DGGS as a data format because the tools for implementing and working with DGGS are not yet advanced enough, however, it is relatively easy to convert polygons to DGGS. The advantage of using equal area cells for ENCs and hence avoiding distortions can clearly be seen when comparing hexagonal DGGS cells to cells based on latitude and longitude. Equal area cells also have the advantage that especially when the data inside are arranged according to DGGS, the size of ENC files including all data should be similar when the cell sizes are equal. A uniform system for ENC cells is perhaps currently the strongest advantage of using DGGS.
6 Outlook and conclusion
Discrete Global Grid Systems are a spatial reference system in which the globe is partitioned into equal area polygons, and the polygons form cells arranged into hierarchical grids. The cells can be referenced via zonal identifiers, and spatial operations based on the cells are possible. The OGC published an international standard describing DGGS and basic operations in 2017. Open-source software is available for the implementation of DGGS, and analysis is possible with the basic operations implemented so far. Advantages for using DGGS for S-122 data were identified through the Federated Marine Spatial Data Infrastructure (FMSDI) Pilot Project Phase II, for example, that DGGS would eliminate the challenges with high point densities. BSH has successfully produced an S-122 dataset according to the current standard and organized the dataset according to DGGS. Discrete Global Grid Systems offer advantages over traditional GIS methods and coordinate systems because DGGS is designed for information, multiple data types can be integrated, and it is efficient to scale.
There are still many challenges to overcome before DGGS can be widely implemented for hydrographic data. First, a further investigation would be necessary into the operability of DGGS with different file formats such as hdf5, raster, vector, point clouds, and even digital twin data. The interoperability between files in different formats and whether the effects are related to the gridding system or file formats would need to be identified. One example of such a test would be to combine raster bathymetry data and ENC vector data to DGGS cells. A second investigation into the operability of DGGS for ENCs would be necessary. ENCs are used for navigation and therefore require a reference system conversion between the ship’s Global Navigation Satellite System (GNSS) signal and the chart horizontal reference system. How this works when the chart is referenced to a DGGS would need to be determined. Thirdly, the scalability of DGGS would need to be investigated. The kRing function implemented in H3 allows for the compacting of hexagons making it possible to represent an area in higher detail with fewer hexagons (Brodsky, 2018). An example is shown in Fig. 8. Additionally, the level of detail necessary would need to be determined and the idea of coverage coming from OGC’s pilot project investigated. Finally, the benefits of using DGGS for other S-100 products need to be investigated, possibly including the use of routeing and/or clustering operations already implemented in available DGGS software.
Although there are still challenges to be worked out relating to the operations and data structure to be used, it is possible to implement S-122 data according to a DGGS. Using Discrete Global Grid Systems, instead of traditional coordinate systems, to organize data, offers many advantages. For example, datasets with global coverage can be represented in a uniform way and many distortions that would be present with traditional coordinate systems can be eliminated. Hydrographic offices around the world are currently working towards the transition to S-100 hydrographic data. One major component of S-100 is the new S-101 standard for ENCs. ECDIS systems currently require at least two projections, one for displaying charts in the Polar Regions, and one for navigation in lower latitudes. S-100 does not specify a standard to address this issue. Another thing not addressed with S-100 is a uniform gridding system for ENC cells. Currently, countries have their own systems, largely based on latitude and longitude. Benefits of using DGGS for S-100 have been identified. First, a DGGS grid would provide one global uniform system for displaying charts in ECDIS, with seamless coverage and no distortions in the Polar Regions. Second, DGGS can be a gridding system for ENC cells that is consistent across all nations and matches at borders and the possibility of implementing a common scaling. This has been discussed many times in the past. Third, DGGS can handle large amounts of data and can combine different types of data, for example bathymetry data (raster) for ENCs (vector). Advantages of using DGGS for a server to store, transmit, and visualize Marine Protected Area data and combine datasets were shown from OGC’s pilot project.
Software for the implementation of DGGS is not yet advanced enough and at this point cannot compare to traditional GIS software in functionality and operability. However, DGGS will be used in the future for many applications as the tools become available and advantages are realized. DGGS has the possibility to be better than traditional GIS and even replace it in the future. Therefore, it would be beneficial for S-100 to support DGGS in the future. This would be a long-term goal, but the development of the next edition of the S-100 framework to enable the possibility of supporting DGGS should be thought about now. Questions to be answered are: is the S-100 GML encoding interoperable enough and how advanced do standards need to be before it is feasible to add DGGS support. A single, customized DGGS for hydrographic data would need to be developed. The cell shape, aperture, and orientation would need to be optimized. Ideally, in the future, systems used for the production of navigational charts will support automatic integration of DGGS. Discrete Global Grid Systems are a solution designed for data storage, analysis, and visualization and have the potential to improve interoperability, FAIRness and advancement of Marine Spatial Data Infrastructure (MSDI) implementation.

Acknowledgements
The authors would like to thank Daniel Zühr, Andreas Sommer, and Elena Gnehm for their involvement in the production of BSH’s initial S-122 GML test dataset.
References
Alderson, T., Purss, M., Du, X., Mahdavi-Amiri, A. and Samavati, F. (2020). Digital Earth Platforms. In H. Guo, M. Goodchild and A. Annoni, Manual of Digital Earth (pp. 25–54). Singapore: Springer. https://doi.org/10.1007/978-981-32-9915-3_2
Ballantyne, P., Singleton, A., Dolega, L. and Macdonald, J. (2022). Integrating the Who, What, and Where of U.S. Retail Center Geographies. Annals of the American Association of Geographers, 113:2, pp. 488–510, https://doi.org/10.1080/24694452.2022.2098087
Barnes, R. and Sahr, K. (2017). Discrete Global Grids for R: Spatial Analysis Done Right. https://github.com/r-barnes/dggridR (accessed 1 March 2024).
Bousquin, J. (2021). Discrete Global Grid Systems as scalable geospatial frameworks for characterizing coastal environments. Environmental Modelling & Software, 146, https://doi.org/10.1016/j.envsoft.2021.105210
Brodsky, I. (2018). H3: Uber’s Hexagonal Hierarchical Spatial Index. https://www.uber.com/en-DE/blog/h3/ (accessed 1 March 2024).
Gibb, R. (2021). Topic 21 – Discrete Global Grid Systems – Part 1 Core Reference System and Operations and Equal Area Earth Reference System. OGC Document: 20-040R3, Open Geospatial Consortium. https://docs.ogc.org/as/20-040r3/20-040r3.pdf (accessed 1 March 2024).
Górski, K., Wandelt, B., Hivon, E., Hanson, F. and Banday, A. (2022). The HEALPix Primer. https://healpix.sourceforge.io/html/intro.htm (accessed 1 March 2024).
HEALPix Team (2019). HEALPix – Data Analysis, Simulations and Visualization on the Sphere. https://healpix.sourceforge.io/index.php (accessed 1 March 2024).
IHO (2019). Marine Protected Area Product Specification. IHO Publication S-122, International Hydrographic Organization, Monaco. https://iho.int/en/nipwg-product-specifications (accessed 1 March 2024).
IHO (2022). Universal Hydrographic Data Model. International Hydrographic Organization, Monaco. https://iho.int/uploads/user/pubs/standards/s-100/S-100_5.0.0_Final_Clean_Web.pdf (accessed 1 March 2024).
IMO (2022). Performance Standards for Electronic Chart Display and Information Systems (ECDIS). International Maritime Organization, Monaco. https://wwwcdn.imo.org/lo-calresources/en/KnowledgeCentre/IndexofIMOResolutions/MSCResolutions/MSC.530(106).pdf (accessed 1 March 2024).
ISO (2021). ISO 19170-1:2021 – Geographic information – Discrete Global Grid Systems Specifications. International Organization for Standardization, ISO/TC 211, 35.240.70, 106pp. https://www.iso.org/standard/32588.html (accessed 1 March 2024).
JHOD (2022). Interim Report on the development of S-101 ENC Scheming Guidelines. Japan Hydrographic and Oceanographic Department. https://iho.int/uploads/user/Inter-Regional%20Coordination/WEND-WG/WENDWG12/WENDWG12_2022_04.2A_EN_Scheming_ver4.pdf (accessed 1 March 2024).
Li, M. and Stefanakis, E. (2020). Geospatial Operations of Discrete Global Grid Systems – a Comparison with Traditional GIS. Journal of Geovisualization and Spatial Analysis, 4(26). https://doi.org/10.1007/s41651-020-00066-3
Mellor, T. (2023). S-57 to S-101: Explaining the IHO standards for ECDIS. UK Hydrographic Office, Admirality Maritime Data Solutions. https://www.admiralty.co.uk/news/s-57-s-101-explaining-iho-standards-ecdis (accessed 1 March 2024).
Mocnik, F.-B. (2021). Library for Discrete Global Grid Systems. https://github.com/giscience/geogrid (accessed 1 March 2024).
National Geographic (2024). GIS (Geographic Information System). National Geographic Society. https://education.nationalgeographic.org/resource/geographic-information-system-gis/ (accessed 1 March 2024).
Navtor AS (2022). The 101 on S-100: what YOU need to know about maritime’s big data transformation. NAVTOR AS, Egersund, Norway. https://www.navtor.com/post/the-101-on-s-100-what-you-need-to-know-about-maritime-s-big-data-transformation (accessed 1 March 2024).
OGC (2017). Topic 21: Discrete Global Grid Systems Abstract Specification. OGC 15-104r5, Open Geospatial Consortium, USA. https://portal.ogc.org/files/15-104r5 (accessed 1 March 2024).
OGC (2023). About. Open Geospatial Consortium, USA. https://www.ogc.org/about-ogc/ (accessed 1 March 2024).
OGC (2023). OGC API – Discrete Global Grid Systems. Open Geospatial Consortium, USA. https://ogcapi.ogc.org/dggs/overview.html (accessed 1 March 2024).
Palikaris, A. and Mavraeidopoulos, A. (2020). Electronic Navigational Charts: International Standards and Map Projections. GNSS and Geomatics Application for Navigation and Marine Engineering, 8:248. https://doi.org/10.3390/jmse8040248
Pharaoh, T. (2009). S-101 Coverage Referencing System – Discussion Paper. 18th TSMAD Meeting, 4th to 8th May 2009, Ottawa, Canada. https://legacy.iho.int/mtg_docs/com_wg/TSMAD/TSMAD18/TSMAD18-16.3F_IndexSystem.pdf (accessed 1 March 2024).
Pritchard, J. (2022). The Arctic Grid Project. IIC Technologies. https://iho.int/uploads/user/Inter-Regional%20Coordination/RHC/ARHC/ARHC12/ARHC12_2022_C2A_EN_Arctic%20Grid%20Project%20report.pdf (accessed 22 March 2024).
Sahr, K. (2023). DGGRID version 8.0b User Documentation for Discrete Global Grid Generation Software. Southern Oregon University Department of Computer Science, Southern Terra Cognita Laboratory. https://discreteglobal.wpengine.com/wp-content/uploads/2024/01/dggridManualV80b.pdf (accessed 1 March 2024).
Sahr, K. (2024, January 10). DGGRID – A command-line application that generates and manipulates icosahedral discrete global grids. https://github.com/sahrk/DGGRID (accessed 1 March 2024).
Sahr, K., White, D. and Kimerling, A. (2013, March 14). Geodesic Discrete Global Grid Systems. Cartography and Geographic Information Science, 30:2, pp. 121–134. https://doi.org/10.1559/152304003100011090
SOU (2024). DGG Orientation. Southern Oregon University Department of Computer Science, Southern Terra Cognita Laboratory. https://discreteglobal.wpengine.com/dgg-orientation/ (accessed 1 March 2024).
Taleisnik, S. and Idol, T. (2022). Towards a Federated Marine SDI: IHO and OGC Standards Applied to Marine Protected Area Data Engineering Report. OGC Document: 22-013R3, Open Geospatial Consortium. https://docs.ogc.org/per/22-013r3.pdf (accessed 1 March 2024).
Thomas, R. and Saeedi, S. (2023). Towards a Federated Marine SDI: Connecting Land and Sea to Protect the Arctic Environment Engineering Report. OGC Document: 23-010, Open Geospatial Consortium. https://docs.ogc.org/per/23-010.html (accessed 25 March 2024).
Uber (2024). Tables of Cell Statistics Across Resolutions. H3 – Hexagonal hierarchical geospatial indexing system, Uber Technologies Inc. https://h3geo.org/docs/core-library/restable (accessed 1 March 2024).
Authors’ biographies

Kimberly Mason is a Geoinformatics Specialist in the Nautical Editorial Office at BSH, the German Federal Maritime and Hydrographic Agency. Her responsibilities involve generating S-100 data and automating the pro- duction of maps and nautical publications. She has previous work experience as a GIS Analyst and Database Analyst. She graduated from the University of Waterloo in Canada in 2019 with a Bachelor of Mathematics in Statistics, Computer Science and GIS. She completed a Master of Science in Geodesy and Geoinformatics with a specialization in Hydrography in 2022 at HafenCity University in Hamburg, Germany.

Jens Schröder-Fürstenberg is a Master Mariner who studied Navigation at the University of Rostock. He sailed on bulk carrier and container feeder vessels and worked in ship operation and handling for many years. He is working with the German Maritime and Hydrographic Agency (BSH) since 1999 and he is the Head of the Nautical Information Service Division. Jens was Chairman of the IHO Nautical Information Provision Working Group for about 10 years and he is now the Chairman of the IHO Wordwide ENC Database Working Group. From 2003 to 2022, he worked as ECDIS basics instructor at the Maritime Education and Training Centre Warnemünde of University of Applied Sciences Wismar.