


How Augmented Reality Can Leverage Water Depth Management in the Port of Hamburg
Abstract
For the process of hydrographic surveying, the skipper of the survey vessel needs a variety of real-time navigational and hydrographic information to navigate the vessel safely and precisely. The survey data is typically displayed on several monitors on board. As part of a research project, we are exploring the potential of augmented reality – a technology that can extend reality by overlaying it with computer-generated visualizations – to assist the skipper in hydrographic surveys. We report an overview of the technology itself, our proof of concept and several challenges we focus on to create a usable and valuable prototype system.
1. Introduction
Seaports play a crucial role in the global logistics infrastructure. The Port of Hamburg is the third largest container port in Europe and ranks 20th worldwide in terms of containers handled, some of which are ultra-large container ships that place special demands on the port infrastructure (Port of Hamburg, 2022). One major task of the waterway infrastructure department of the Hamburg Port Authority (HPA) is the maintenance of the water depths in the port. Continuously, dredgers have to maintain the required depths in the fairway of the river Elbe, but also in many harbor basins to provide sufficient under-keel clearance for vessel traffic.
Because of sedimentation and erosion effects in the tide-influenced port area, the seabed topography changes continuously, which is monitored by the four survey vessels equipped with sensors, like multibeam echo sounders. They perform year-round hydrographic measurements to determine the area-based water depths in the whole port.
The results of these surveys are used to plan and to control the dredging activities in the port, and to receive information about sedimentation and erosion processes (Thies, 2011). Investments in advanced information technology are opportune to support hydrographic surveying as a critical service. Currently, there are efforts to digitize ports’ processes and create so-called smart ports (Heilig and Voß, 2017; Yau et al., 2020).
As an innovative technology, augmented reality (AR) offers enormous potential to support skippers with hydrographic surveying (Bräker et al., 2021; Osterbrink et al., 2021). The possibility of overlaying reality with virtual elements or information using AR and displaying these directly in the skipper’s field of view, can provide both physical and mental workload reduction for skippers. As part of a research project, we investigate the extent to which AR can be used advantageously and how an AR application must be designed and developed to offer optimal support.
In the following, we present the use case and the foundations of AR. We then describe the prototype development using one implemented feature as an example and discuss the challenges we are currently facing. We conclude the note by pointing out future directions and summarizing the results.
2. Operational processes
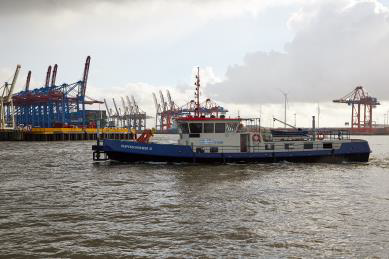
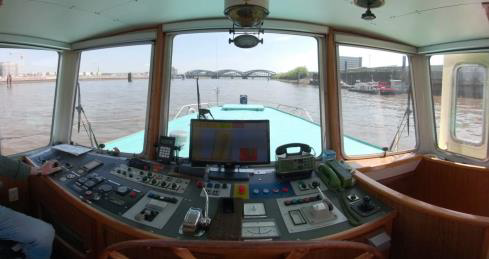
The entire port area is divided into different surveying areas based on the survey interval. For instance, a division per harbor basins is made, allowing vessel personnel to measure several of these areas per day as surveying assignments. The survey vessel (Figure 1) is operated by an experienced skipper, who is responsible for the vessel’s safe navigation, and a hydrographer, responsible for the complete and correct collection and quality assurance of the hydrographic survey data. Communication and interaction between the two actors involved are essential to complete the surveying assignments safely and with the respective quality.
The skipper’s task is to navigate the vessel within the survey area so that the surrounding traffic is not affected negatively by the survey operations. This includes VHF communication with passing vessels and the vessel traffic center. The skipper must maintain a 360-degree situational awareness by observing the navigation, AIS, and RADAR systems. Furthermore, the skipper must cope with challenging environmental conditions, like wind drift, changing current speeds and directions, wave heights, and sometimes reduced visibility. Depending on the environment and traffic, this task is safety-critical and therefore requires constant concentration.
The necessary information, such as the area to be surveyed and the depth data measured in real-time, are visualized on a digital map on a monitor placed in the vessel’s windshield (Figure 1). The so-called helmsman display already integrates the vessel’s current position with ENC and AIS targets, observed water depth, vessel speed information, and the coverage of the surveyed area. In addition, the hydrographer can add a bearing line to the digital map for the skipper, representing the optimal route and considering distances to shore and potential dangers. Also, strictly following the bearing line ensures that the hydrographic data quality is as good as possible. The permanent skipper’s change of view between the monitor and the outside world is physically and mentally demanding (Bräker et al., 2021; Osterbrink et al., 2021).
3. Augmented Reality
Augmented reality technology aims to facilitate the combination of real and virtual content by merging digital visualizations into the users’ perception of the real world (Milgram and Kishino, 1994). AR can be realized using various devices, e.g., smartphones or tablets (mobile AR), where the device’s camera image is overlaid with digital content.
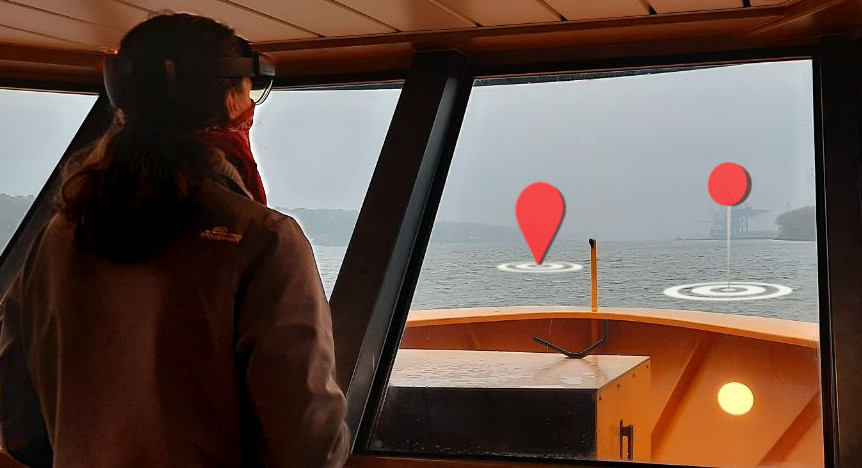
In our case, especially head-mounted displays (HMDs), as worn in Figure 2, are interesting (Bräker et al., 2021). In contrast to mobile AR, an HMD does not have to be held in hand and is, therefore, particularly advantageous for use cases that require physical work. HMDs enable stereoscopic vision – by displaying a separate image to each eye, the brain combines the information into a three-dimensional image, similar to naturally viewing the real world. AR HMDs have built-in cameras and motion sensors, allowing the device to locate itself in space, making holograms appear spatially correct – if the user moves, the visualization is adjusted so that the holograms remain stable in their position in space.
So far, researchers and developers have investigated the use of AR in many different areas, for example, in industrial contexts (De Pace et al., 2018). Also, for navigation, several research projects indicate a promising potential of using AR to visualize routes and hints directly into the user’s field of view. Nowadays, AR also starts to become available in our everyday lives. For example, in 2019, the Google Maps feature Live View was launched (Inman, 2019). This feature uses AR to facilitate outdoor navigation for smartphone users by blending arrows and directions with the phone’s camera image.
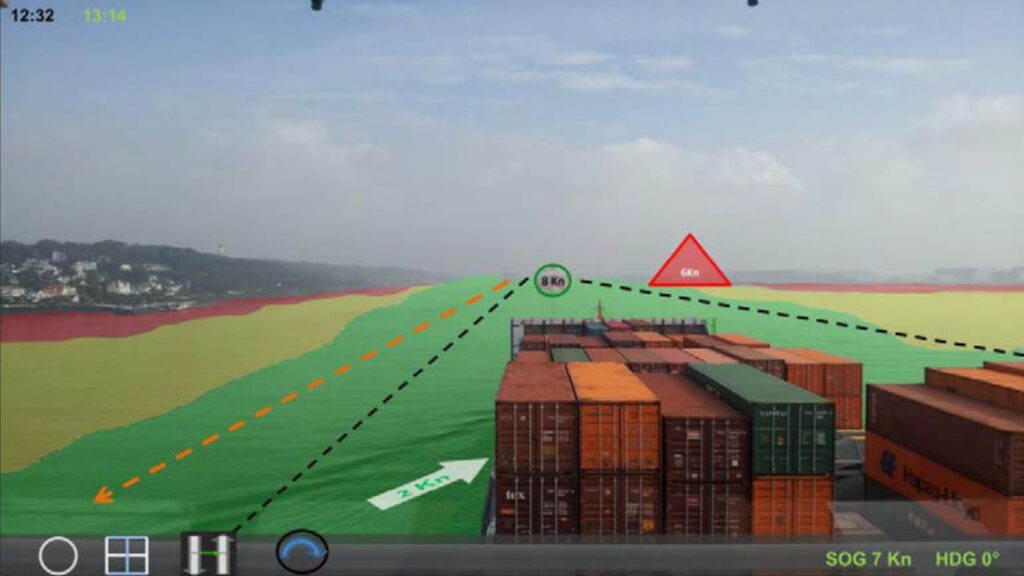
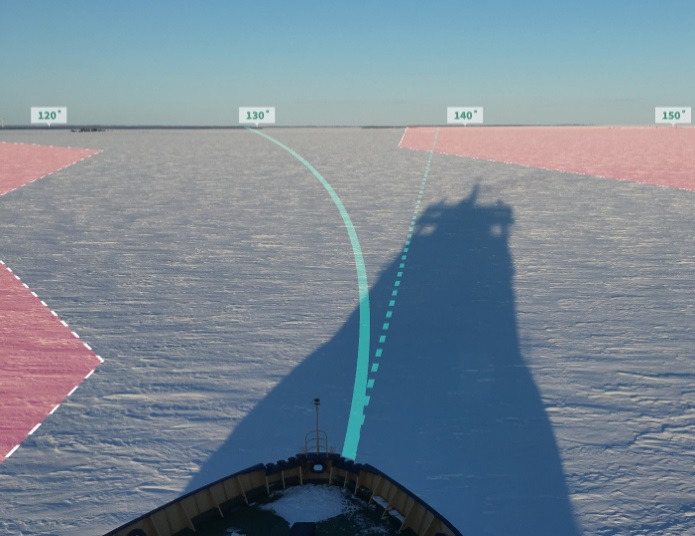
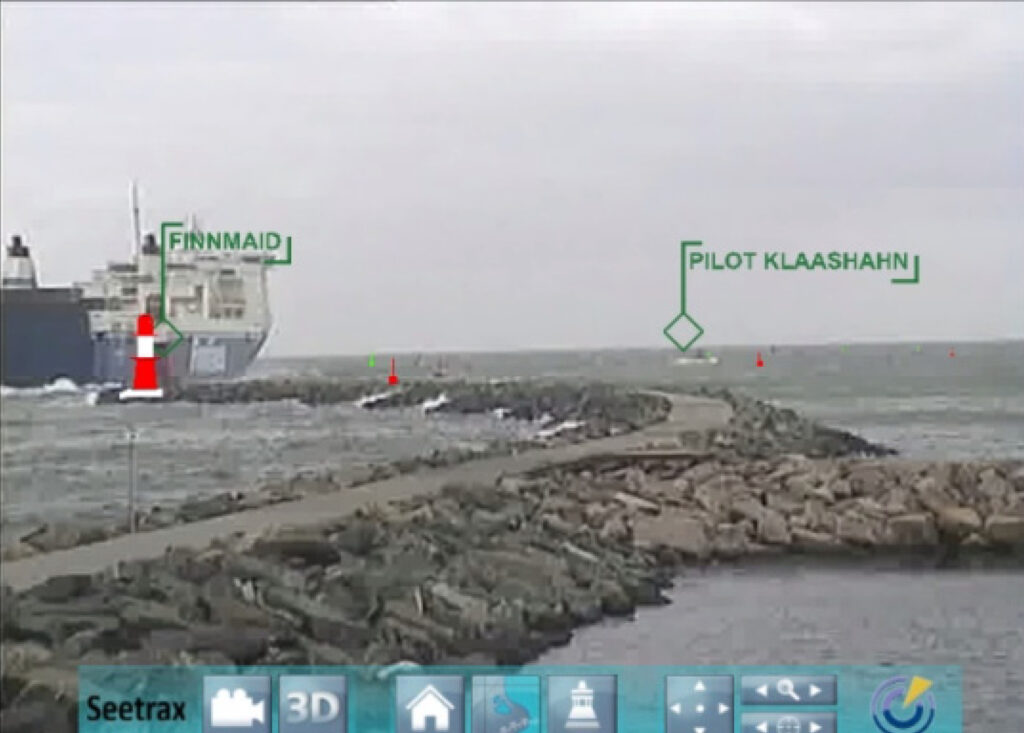
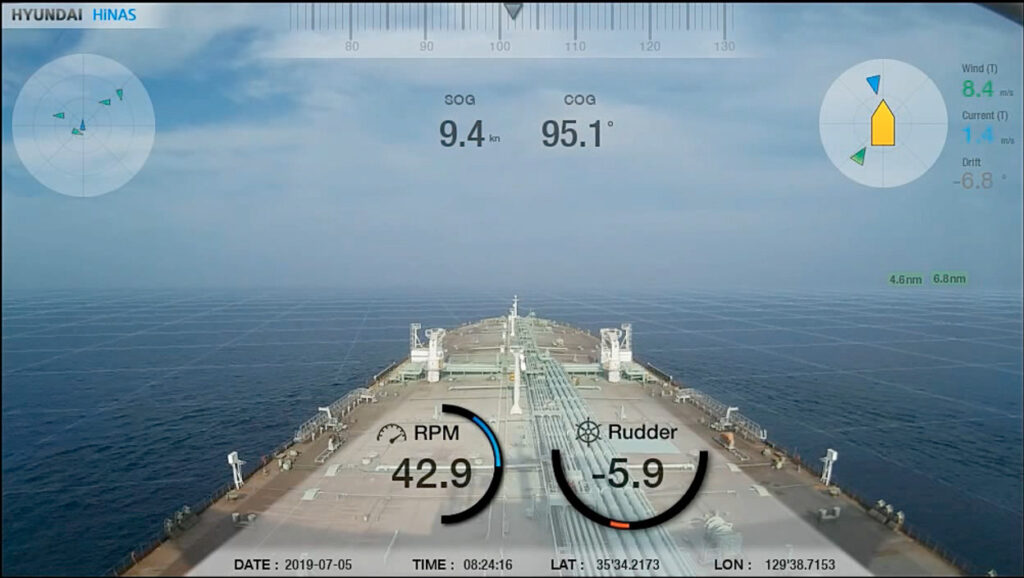
In the context of maritime navigation, a body of research regarding the use of AR exists as well (Laera et al., 2021). Researchers investigate the use of AR to increase safety and reduce workload by visualizing data, traditionally displayed on monitors and nautical instruments, directly in the skipper’s field of view. For instance, AR could overlay the real-world water surface with information. This way, bathymetric data and no-go-zones could be visualized with colored areas (Figures 3a and 3b), and navigational data like heading and course could be represented with lines on the water surface (Figure 3b). Furthermore, AR enables the visual attachment of data to objects, for example, to display information about ships near their real-world positions (Figure 3c). AR can also be used to show data about the state of the own ship, like speed, in the skipper’s field of view (Figure 3d).
4. Assisting Hydrographic Surveys
In our project, we explore the usage of AR in the specific context of hydrographic surveys. We aim to understand requirements and potentials, investigate challenges, and finally build a working prototype that extends the real-world view with digital overlays. As a first step, we focus on supporting the skippers since we see the most potential for AR there. In contrast to hydrographic surveyors, who concentrate more on the monitor, skippers must additionally be aware of their real-world surroundings. In the following, we will give an overview of the research we have already conducted, insights we have gathered so far, and challenges we have encountered.
4.1 Proof of Concept
To get an overview of how AR can support hydrographic surveys, we observed different skippers with heterogeneous experiences at work carrying out eleven different hydrographic surveying assignments over several days. Using the Think Aloud method, we requested the skippers to verbalize their thoughts and explain their actions to derive initial requirements. In agreement, we attached cameras – one to their foreheads recording their field of view and a second in the windshield to observe their facial expressions and gestures (Osterbrink et al., 2021).
For developing a prototypical AR application to assist hydrographic surveys, we started by focusing on the visualization of the most essential and safety-critical information – the display of the bearing line. As described before, this line is currently displayed on a monitor and is especially important as the skippers must steer the ship precisely while safely through the defined area. We are using the HMD Microsoft HoloLens 2, as our prior work indicates that HMDs are a promising solution for our case (Bräker et al., 2021).
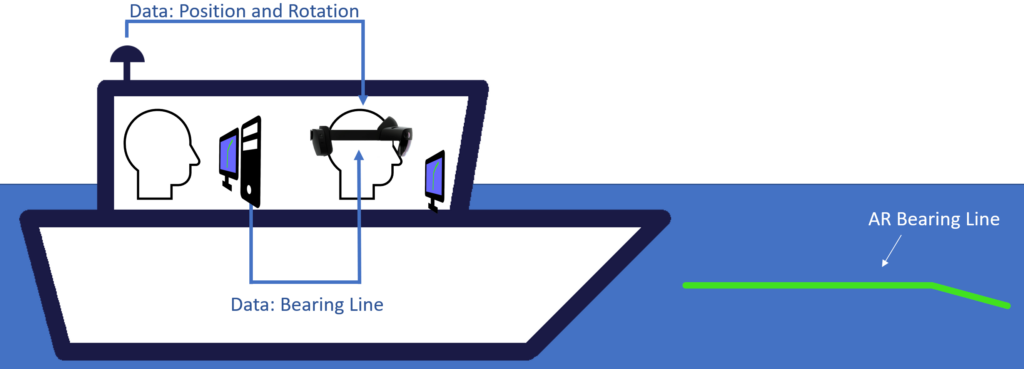
Figure 4 illustrates the setting of our prototype on the vessel. As described before, the hydrographer digitizes a bearing line, which is sent to a board computer. Additionally, the ship’s current position, attitude and heading are sent to the board computer. Both data streams are transmitted to the skipper’s HMD, where the bearing line on the water surface is displayed in real-time. While using the AR system, the skipper sees the real world unobstructed, steers the ship as usual, and can freely choose whether to use AR.
4.2 Challenges
We are facing multiple challenges during the design and development of the proposed AR system. Even though some research regarding the AR visualization of maritime data has been done, many research questions about developing a suitable system remain open. As necessary in other contexts, multiple factors like perceptual mechanisms of the human visual system, technical limitations of the HMD, and context-specific requirements have to be considered.
In a location-critical system like this one, it is crucial that visualized navigational aids are perceived by the user at the intended position. However, since the technology of AR is relatively new, it is, for instance, not yet fully understood how humans perceive the distance and scale of virtual objects displayed in AR. We conducted a study to investigate depth perception in AR and the influence of visual attributes like shape and color (Hertel and Steinicke, 2021).
While conventional displays usually use 2D representations to deliver information, e.g., a map in top-down view to visualize routes or flat icons to represent elements in nautical charts, in AR, all information is shown in 3D. On the one hand, objects can be rendered three-dimensionally, i.e., by using geometric models instead of icons. On the other hand, objects can be placed everywhere in a 3D environment, e.g., lying on the water surface, hovering in front of the ship, or anchored to other vessels. However, these possibilities create various design challenges since converting any 2D information into 3D space is not trivial. Also, the usefulness of a visualization always depends on the context of the process and the environment. For example, since skippers are familiar with the representation of nautical charts as 2D maps, it is questionable if it makes sense to transfer this visualization into 3D space.
Especially since the process is safety-critical, AR usage requires a careful choice of which information is displayed, how and when. The challenge, thereby, is to avoid visual clutter (Azuma et al., 2001) – i.e., the cognitive overload of information – so that AR elements do not disturb or distract the skippers from their tasks or hide important parts of the environment. Furthermore, it is crucial that AR content only extends the reality without hiding important parts of it, for instance if the whole water surface were overlaid.
Technical limitations for HMDs include weather conditions, like direct sunlight, which makes the holograms less visible to the user. Nevertheless, tracking challenges on board the vessel arise because AR HMDs are usually used in static environments (Bräker et al., 2021; Osterbrink et al., 2021).
5. Future Directions and Recommendations
By visualizing the bearing line and providing the technical specifications for a spatially correct overlay, we paved the way to integrate additional features and visualizations into our prototype. In doing so, relevant information such as AIS data, features from ENCs, water levels, currents, wind speeds and directions, etc., could be added to the prototype. Iteratively, we plan to evaluate our prototype – under laboratory conditions and in the field with the skippers. In doing so, we make sure that the prototype gradually matures so that an operational-ready implementation and a pilot project can be the next steps.
If the evaluation results indicate that an HMD might not be the perfect hardware option, other display technologies, such as transparent windshield displays, are a viable alternative. These displays resemble car head-up displays and can overlay everything outside the vessel with virtual elements.
Besides observing visualizations, users can also actively interact with AR systems. Thus, the current prototype could be extended to let users customize their view, switch on and off data layers or save the position of discovered obstacles. As a preliminary work, we already aimed to classify AR interactions (Bräker et al., 2022; Hertel et al., 2021). The following steps would be investigating use cases and appropriate interaction techniques accordingly. Another interesting aspect to investigate is the collaboration between the skipper and the hydrographer, e.g., by providing them with synchronized visualizations.
6. Conclusion
During hydrographic surveys, skippers use various nautical and hydrographic data sources. Our project aims to explore augmented reality to support skippers by directly overlaying real-time data, such as currents, water depths, and obstacles, in their field of view. This eliminates the need to constantly switch views between the monitor and the outside world, which has been perceived as mentally and physically exhausting (Osterbrink et al., 2021).
We started with showing the bearing line – i.e., the line to follow during surveys – directly onto the water surface. As proof of concept, we showed that this is possible with current HMDs. However, several challenges are shaping our ongoing research. These are, on the one hand, technological challenges (i.e., hardware, visualization, and interaction) and, on the other hand, socio-technical challenges we still need to explore. We look forward to piloting the prototype in practice to gain further insights for research and practice.
7. Acknowledgments
We sincerely thank the skippers for their enthusiastic participation and patience during data collection. This research was partly sponsored by the German Federal Ministry for Education and Research and in the project WizARd under the references 02K18D181 and 02K18D183. Further information can be found at https://www.wizard.tu-dortmund.de/.
8. References
Azuma, R., Baillot, Y., Behringer, R., Feiner, S., Julier, S., MacIntyre, B. (2001). Recent advances in augmented reality. IEEE Computer Graphics and Applications.
Bräker, J., Hertel, J., Osterbrink, A., Briede, M., Baldauf, U., Wiesche, M., Steinicke, F., Semmann, M. (2021). Augmenting Safety-Critical Processes – Requirements and Technologies for Soil Sounding in the Port of Hamburg, in: 27th ITS World Congress. Hamburg, Germany.
Bräker, J., Hertel, J., Semmann, M. (2022). Conceptualizing Interactions of Augmented Reality Solutions, in: Proceedings of the 55th Hawaii International Conference on System Sciences (HICSS).
De Pace, F., Manuri, F., Sanna, A. (2018). Augmented reality in industry 4.0. Am. J. Comput. Sci. Inf. Technol 6, 17.
Frydenberg, S., Nordby, K., Eikenes, J.O. (2018). Exploring designs of augmented reality systems for ship bridges in arctic waters. Human Factors 26, 27.
Heilig, L., Voß, S. (2017). Information systems in seaports: a categorization and overview. Inf Technol Manag 18, 179–201.
Hertel, J., Karaosmanoglu, S., Schmidt, S., Bräker, J., Semmann, M., Steinicke, F. (2021). A Taxonomy of Interaction Techniques for Immersive Augmented Reality based on an Iterative Literature Review, in: Proceedings of the IEEE International Symposium on Mixed and Augmen-ted Reality (ISMAR). pp. 431–440.
Hertel, J., Steinicke, F. (2021). Augmented Reality for Maritime Navigation Assistance – Egocentric Depth Perception in Large Distance Outdoor Environments, in: 2021 IEEE Virtual Reality and 3D User Interfaces (VR). Presented at the 2021 IEEE Virtual Reality and 3D User Interfaces (VR), pp. 122–130.
Inman, R. (2019). Take off to your next destination with Google Maps [WWW Document]. URL https://blog.google/products/maps/take-your-next-destination-google-maps/ (accessed 7.27.22).
Jeon, M., Park, J., Woo, J. (2019). Development of HHI’s advanced navigation assistance system for safe voyage. IFAC-PapersOnLine 52, 111–113.
Laera, F., Fiorentino, M., Evangelista, A., Boccaccio, A., Manghisi, V.M., Gabbard, J., Gattullo, M., Uva, A.E., Foglia, M.M. (2021). Augmented reality for maritime navigation data visualisation: A systematic review, issues and perspectives. The Journal of Navigation 1–18.
Milgram, P., Kishino, F. (1994). A taxonomy of mixed reality visual displays. IEICE Transactions on Information and Systems 77, 1321–1329.
Ostendorp, M.-C., Lenk, J.C., Lüdtke, A. (2015). Smart glasses to support maritime pilots in harbor maneuvers. Procedia Manufacturing 3, 2840–2847.
Osterbrink, A., Bräker, J., Semmann, M., Wiesche, M. (2021). Requirements for Augmented Reality Solutions for Safety-Critical Services – The Case of Water Depth Management in a Maritime Logistics Hub, in: 16th International Conference on Wirtschaftsinformatik.
Port of Hamburg (2022). Statistics – Cargo Handling [WWW Document]. The official website of the Port of Hamburg. URL http://www.hafen-hamburg.de/en/statistics/ (accessed 8.4.22).
Thies, T. (2011). A Vessel-Based Mobile Mapping System – From Sensor Integration to Multipurpose Products (Master Thesis). HafenCity University, Hamburg.
von Lukas, U., Vahl, M., Mesing, B. (2014). Maritime Applications of Augmented Reality – Experiences and Challenges, in: Shumaker, R., Lackey, S. (Eds.), Virtual, Augmented and Mixed Reality. Applications of Virtual and Augmented Reality. Springer International Publishing, Cham, pp. 465–475.
Yau, K.-L.A., Peng, S., Qadir, J., Low, Y.-C., Ling, M.H. (2020). Towards Smart Port Infrastructures: Enhancing Port Activities Using Information and Communications Technology. IEEE Access 8, 83387–83404.