


Abstract
Validation study, Upscaling SDB, SDB potential
1. INTRODUCTION
A high-resolution bathymetric survey is a critical prerequisite to modern coastal zone planning and engineering projects. In the shallow nearshore area, bathymetric information are often adopted from coarse or outdated soundings on published charts, due to high costs, risks and pose logistical challenges of traditional survey techniques. Ship-based acoustic measurements that utilize single- or multi-beam systems require both, equipment and staff on the vessel and the access to the nearshore is limited by the vessel’s draft and areas deemed safe to navigate. An alternative to these shallow water survey methods is Satellite-Derived Bathymetry (SDB) which provides rapid, cost effective and high-quality bathymetric surveys for worldwide applications. This technology has evolved considerably since the 1970s with the public availability of the first optical satellite images. Today it is frequently used to support hydrographers and other stakeholders in their work.
In early 2021, an online questionnaire performed as part of the European Commission’s ‘4S’ innovation project on the usage of shallow water survey techniques, showed that 28% of the 213 stakeholders identified the ability to map inaccessible locations as the main reason to use SDB technology. Other notable statistics from the survey include: access to historic and recent information (22%), better/more accurate data than currently accessible/available (18%), reduced logistic effort (18%) and less dependencies on weather (4S, 2021). This demand has impact on the SDB method which can be applied as it requires to be independent on local survey data to map in-accessible regions and to allow for mapping historic morphology.
There are three main SDB concepts: (a) the ‘photogrammetric approach’ in which matching points are identified in two or more satellite images of varying recording geometry. The elevations (depths) are then triangulated from the orbit patterns correlated with the matching points (Chénier et al., 2018). It is depending on the availability of commercial clear water stereo VHR imagery, very smooth water surface and a heterogeneous seafloor. (b) The ‘ratio approach’ applies the ratio of the green and blue light with an empirical relationship to match pixel colour with known survey data (International Hydrographic Organization, 2018). This method requires existing high-quality survey data as a prerequisite. Machine Learning procedures such as a random forest regressor or SVM, can be applied to train multispectral satellite images with known depth (Niederjasper et al., 2020). However, the transferability of such models to other satellite images is limited. (c) The ‘physics-based’ SDB quantifies depth by inversion of the radiative transfer model that describes the modulation of the sunlight as it passes through the atmosphere, water surface, water column and is reflected from the seafloor back to the satellite sensor. The benefit of this approach is that quantification of water depth does not require on-site survey data, is sensor-agnostic, and can provide a range of ancillary outputs such as seafloor reflectance and model-based confidence envelopes on a per-pixel basis. This method is more computationally intensive but due to its benefits, it has found uptake in the Seabed2030 project and is integrated into nautical charts in the Pacific and Caribbean.
All described SDB methods are passive measurements and are limited to depth zone where the sunlight is reflected by the seafloor. The depth of approx. 1 time Secchi Disc Depth at time of satellite image recording is often used as maximum mapping depth (e.g. Hartmann et al., 2017). They depend on the users’ skills on satellite image- and bathymetric data interpretation and require data manipulation which is a potential source of uncertainties. It also limits the ability to upscale SDB concepts to a pan-national or global scale. These gaps were identified in the recent Horizon2020 innovation project ‘4S’, a consortium of eight industry and academia partners, Fugro, QPS, Hellenic Centre for Marine Research, Länsstyrelsen Västerbotten, CNR ISMAR, Instituto Hidrográfico, Smith & Warner International and led by EOMAP. Within the project, SDB-Online was developed, a fully physics-based SDB solution, installed in the cloud with parallel processing capabilities.
2. MATERIALS AND METHODS
2.1 Sites and bathymetric survey data
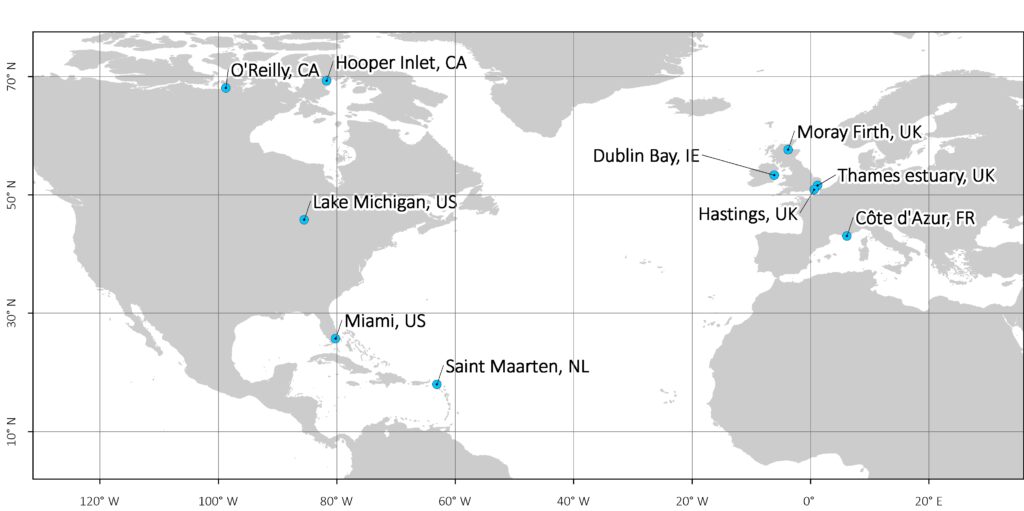
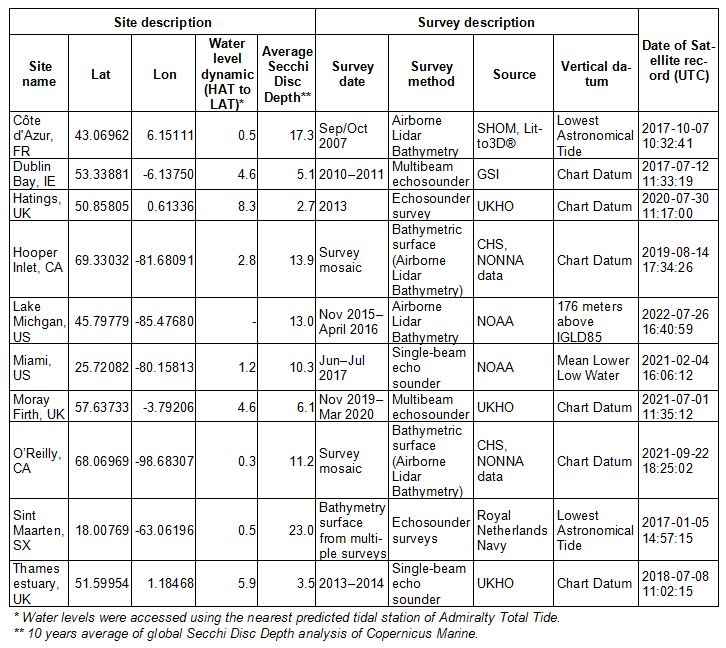
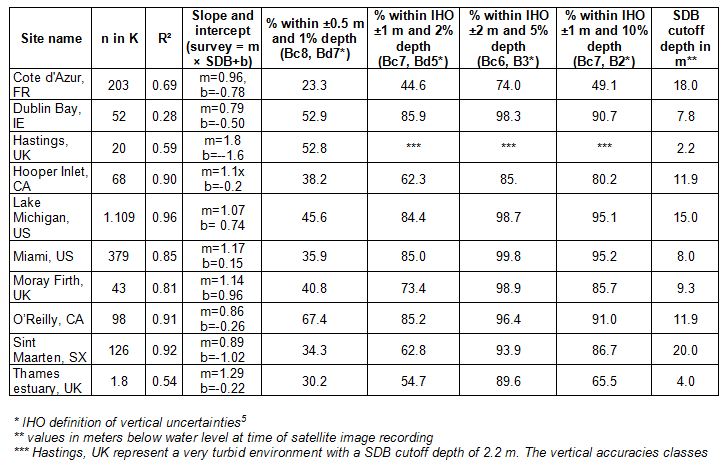
The validation of SDB-Online’s SDB results was conducted for ten focus areas. These sites were selected to represent different environmental and geographic conditions and are located in areas with freely accessible bathymetric survey data. The following sites were selected: Côte d’Azur, FR, Dublin Bay, IE, Hooper Inlet, CA, Lake Michigan, US, Miami, US, Moray Firth, UK, O’Reilly, CA, Sint Maarten, NL, Thames estuary, UK and Hastings, UK (Figure 1).
The bathymetric survey data which have been used for the validation of SDB results are described in the Table 1. The sites represent different tidal regimes from very high water level variations (Hastings, UK) to very little (O’Reilly, CA and Lake Michigan), different water level conditions from turbid waters (Thames estuary, UK) to clear waters (Sint Maarten, SX) and different latitudes from the equator (Sint Maarten, SX) to the polar region (Hooper Inlet, CA).
The survey data were reprojected from the original coordinate system to the UTM/WGS84 coordinate system and resampled to a 10m spatial resolution grid using the Nearest Neighbour resampling method to match the spatial resolution of the SDB data.
2.2 Satellite data
The study is based on European Space Agency’s Sentinel-2 satellite data, while the methodology applied and described below is sensor-generic and often applied also to very-high resolution sensors such as Worldview-2/-3. The recording sensor aboard the Sentinel-2 satellites, the Multi-Spectral Imager (MSI) features four separate spectral bands in the visible and near-infrared region with a spatial resolution of 10 m and a further nine bands in the visible to short wave infrared bands in 20 m to 60 m resolution. The constellation of two Sentinel-2 satellites so far (2A and 2B) record the earth in a frequency of 3–5 days depending on latitude, with the data being freely available to the general public 1. SDB-Online is linked to these data archives and thus can directly access one or multiple of those datasets.
The selection of satellite data for the analysis is a crucial prerequisite for the SDB process. Environmental impacts such as cloud cover, haze, sunglint, wave activity and turbidity can negatively impact the SDB derivation. This needs to be considered in the satellite scene selection. Accordingly, for each site satellite imagery with the lowest possible environmental impacts was selected. The dates of the satellite data which have been used for the SDB analysis are listed in Table 1.
2.3 SDB-Online
The processing of the bathymetric surface in the webapp SDB-Online is based on an algorithm package developed by EOMAP, which quantifies bathymetry by the inversion of the radiative transfer equation, often referred to as “physics-based” method. It is a standardized data analysis independent of additional survey data. However, it also offers the possibility to assimilate survey data (or Satellite-Lidar Bathymetry (SLB) data, not part of this paper) for quality-control and automatic fine tuning of the model. The core element of this algorithm package is the Modular Inversion and Processing System (MIP) for shallow-water and SDB applications (Heege et al., 2003; Heege et al., 2004). The MIP development started in 1996 by a team of physicists, mathematicians and IT experts at the German Aerospace Center (DLR) within various research programs. It has continued to evolve since 2006 as proprietary EOMAP technology. Within the MIP, the radiative transfer model of the coupled atmosphere-water systems is based on the Finite Element-Method (FEM) reference model of Dr. Kiselev, EOMAP. This method was refined and further developed over the last 30 years (Kisselev and Bulgarelli, 2004; Kisselev et al., 1995), featuring the state-of-the-art algorithms as listed below. In order to support efficient production workflows and automated processing, MIP modules and EOMAP pre-/post processors are orchestrated within the Earth Observation Workflow System (EWS). Furthermore, MIP algorithms form the basis of the physics-based, stand-alone desktop SDB software ‘WATCOR-X’, which is licensed to Hydrographic Offices worldwide (e.g. Royal Australian Navy or Pushidrosal at the SDB Day 20212. In the past years the ‘full’ physical implementation of the atmosphere, the water column and the seafloor system was completed and enabled mapping bathymetry independent of any ground truth data availability, while reducing analysts’ effort for fine-tuning parameters. As part of EOMAP’s Research & Development program, this system is continuously updated and improved.
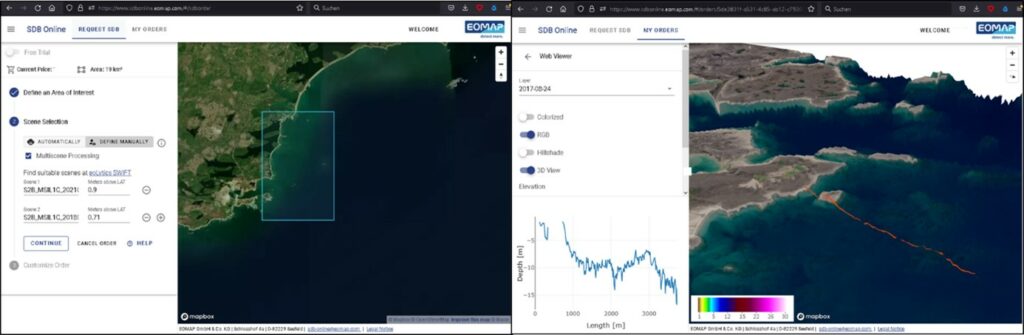
Within the current Horizon2020 innovation program 4S, this solution was installed on the AWS cloud. A web user interface and an API interface allow to activate the cloud-backend and SDB data are produced on demand (Figure 2, access to SDB-Online at sdb-online.eomap.com).
SDB-Online is directly coupled with the satellite data archives of ESA’s Sentinel-2 multispectral satellites, so that an upload or data transfer to the system is not required. The workflow of SDB-Online is explained in the following and illustrated in Figure 3:
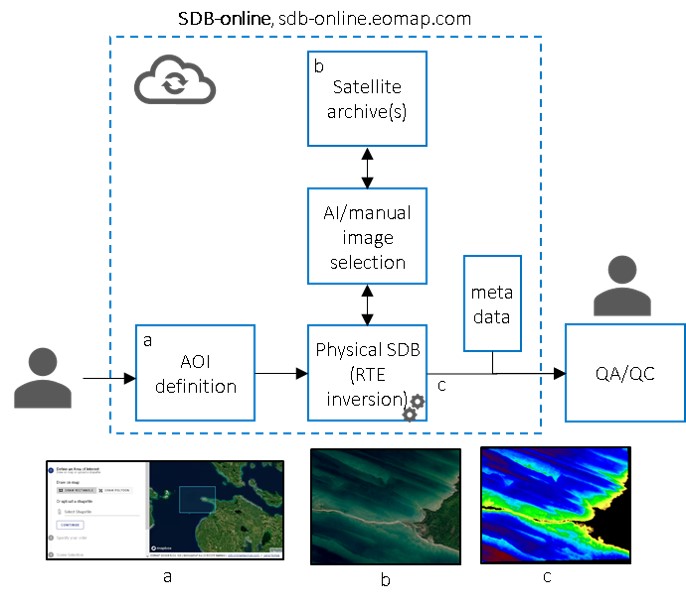
1) Initialisation: User defines an area of interest via the online webapp and identifies a specific satellite record which meets the requirements for SDB. A separate webapp (eolytics SWIFT3) supports the user with the identification of the most meaningful satellite image records.
2) Core data analytics: The full SDB workflow contains a number of processes and corrections applied to the multispectral satellite imagery, including the inversion of the radiative transfer equation:
- Import of selected satellite data and access of all relevant metadata
- Identification of all water areas within the area of interest
- Correction of satellite data for effects of adjacency of the nearby land (Kiselev et al., 2015)
- Correction for atmospheric and sea surface impacts using a coupled retrieval of in-water optical properties (IOP’s) and atmosphere (Heege et al., 2014)
- Minimization of effects of sunglint on the water surface
- Retrieval of spatially resolved information on water depth and seafloor albedo
- Correction for water level heights using Aviso water level model3 ; SDB-Online has integrated a global water level model, correcting SDB data to Lowest Astronomical Tide (LAT) as default.
- Creation of standardized geodata formats for SDB, ISO conform metadata and a real colour image of the satellite record(s).
3) QA and download: The SDB results can be accessed via the webapp. Functions such as a 3D view, transects and overlays of real colour imagery or colour palette enable an initial check of the SDB. All data can be downloaded and are fully compatible to any GIS system, hydrographic software or geo-libraries. The mandatory check which follows the data analytics is the definition of the cutoff depth. This is the depth boundary between the areas where light is reflected by the seafloor and areas where the light is reflected by the water column. Any area deeper than the cutoff depth needs to be masked from the SDB data by the user. The cutoff depth can be heterogeneous across an area of interest, varies with the season and depends onwater clarity and seabed colour.
The described process was performed for all 10 study sites. All data analytics were processed without any kind of local data or information. All results represent the direct outcome of the physics-based SDB calculation of SDB-Online. The additional survey data have only been used for validation purposes.
3. RESULTS
SDB-Online created bathymetric surfaces in 10m spatial resolution for all of the ten sites and independent on local survey or ground truth data.
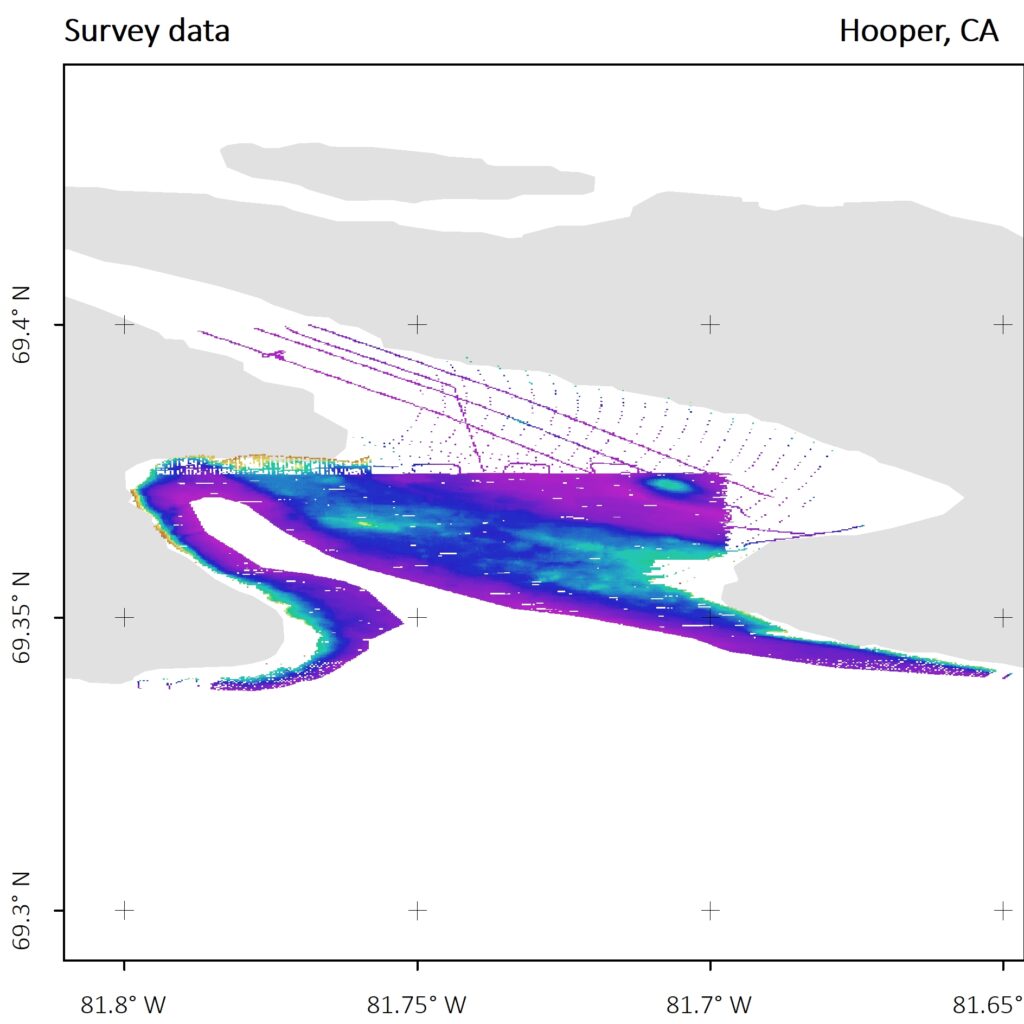
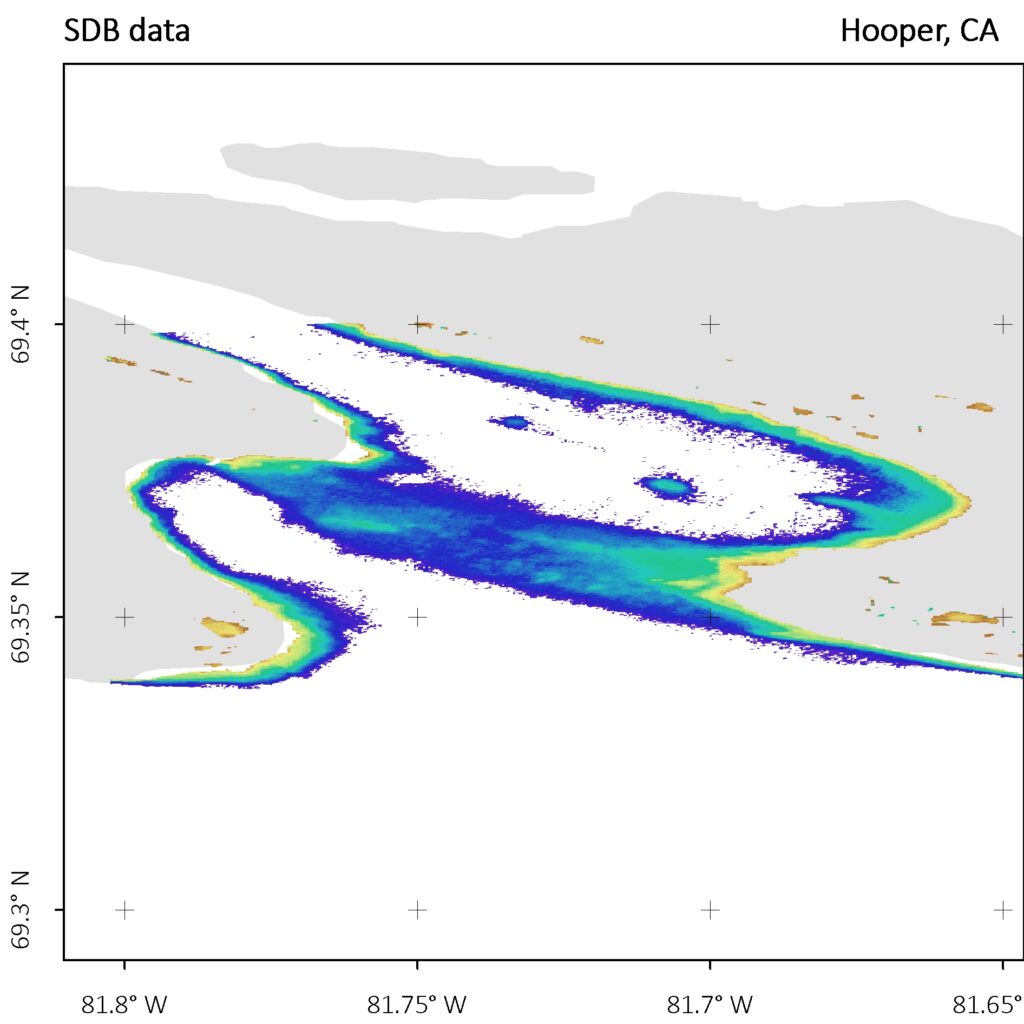
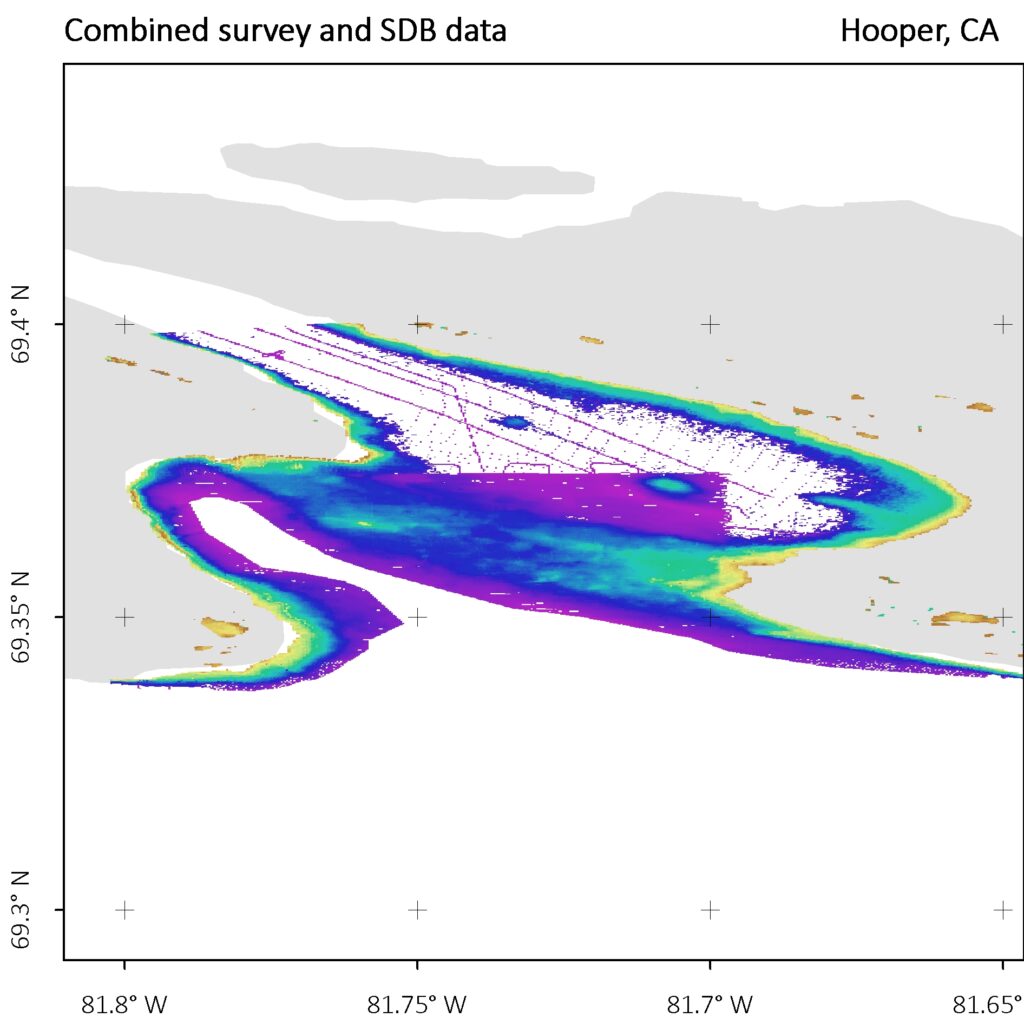
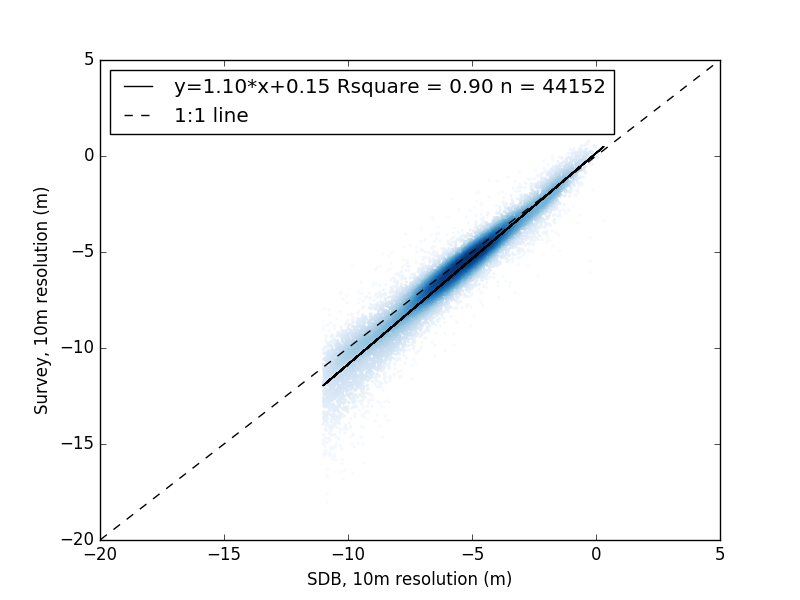
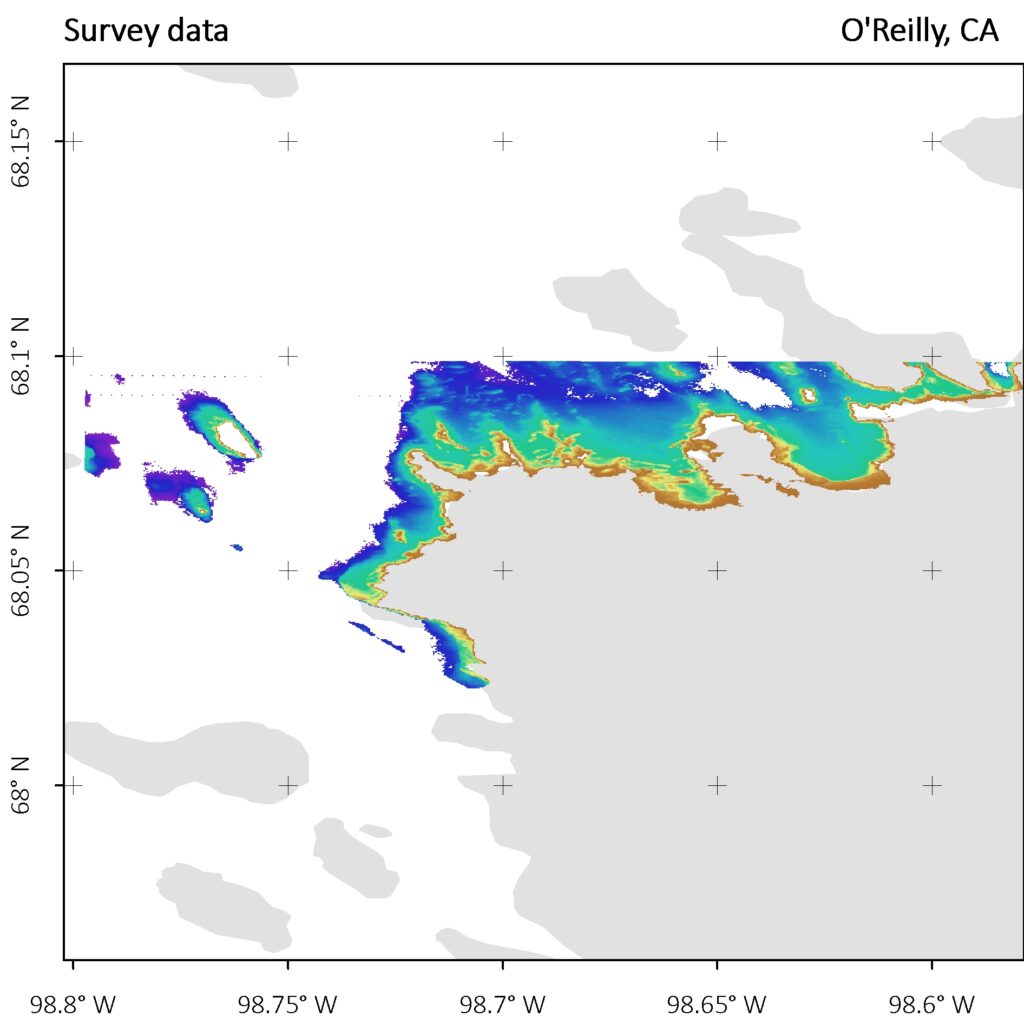
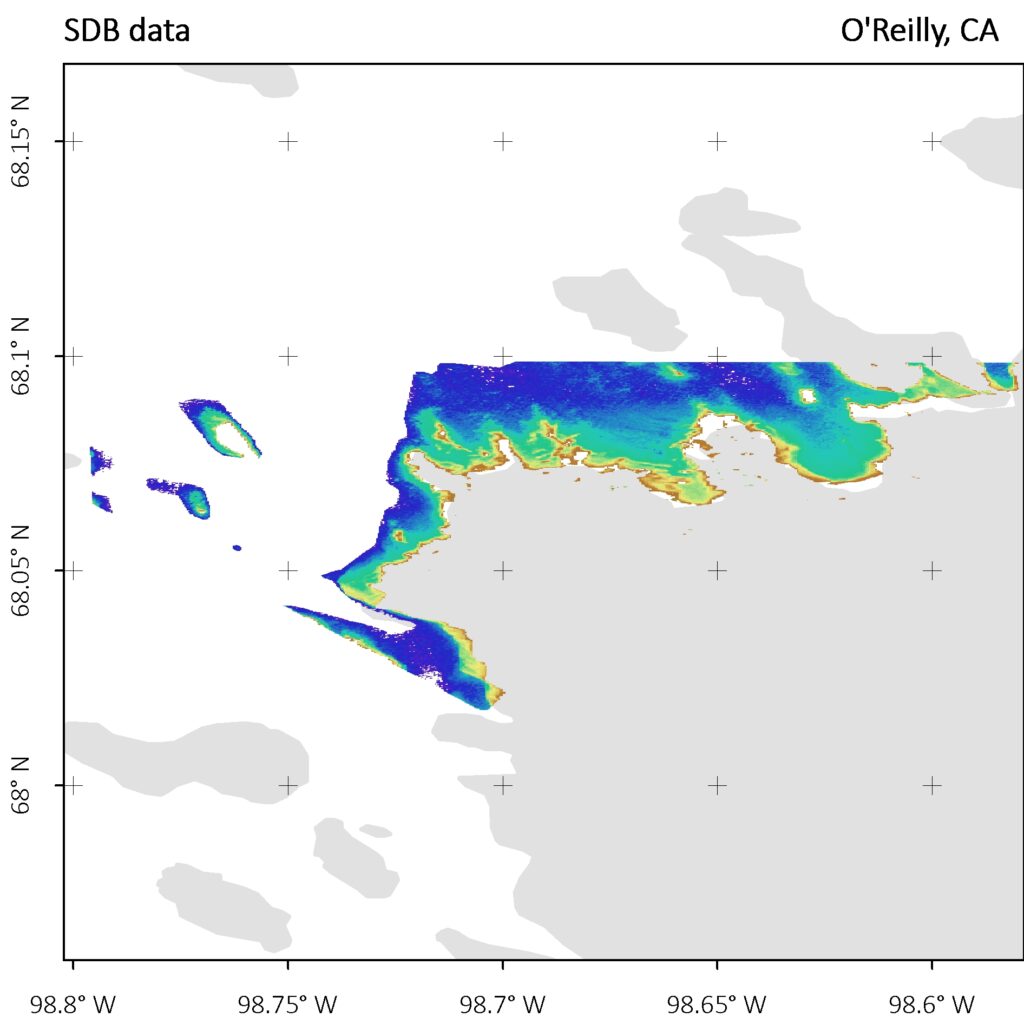
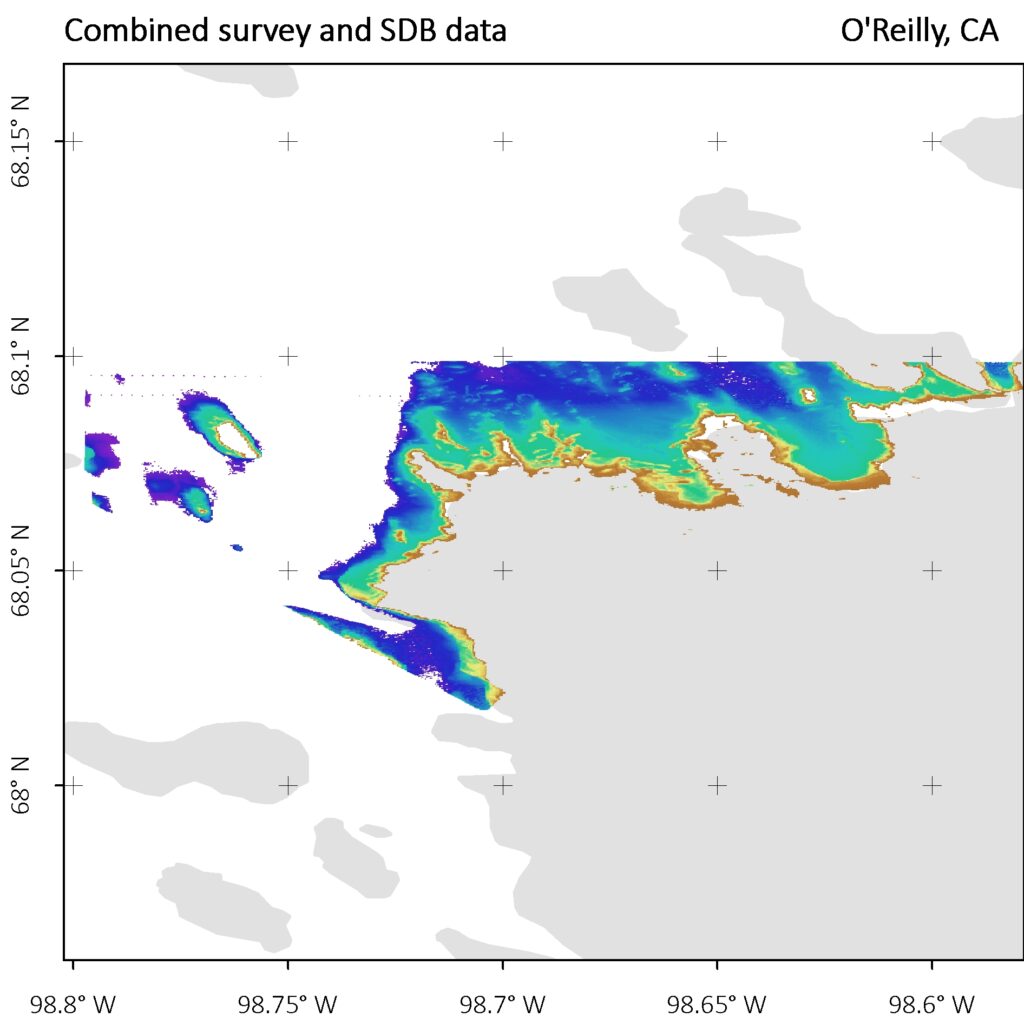
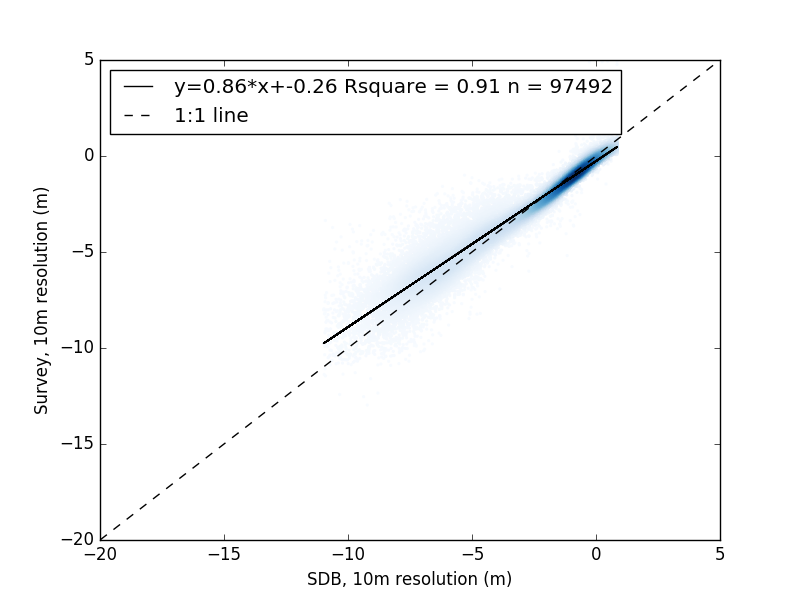
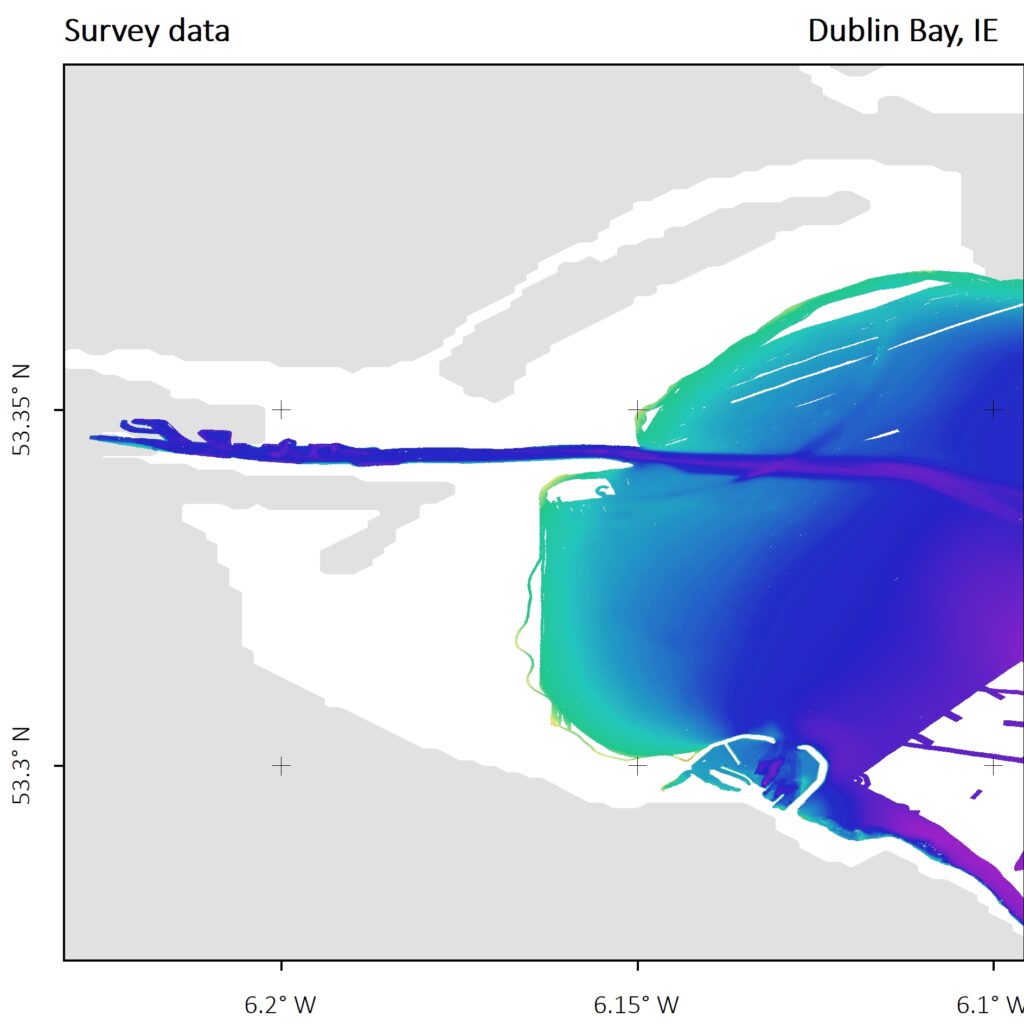
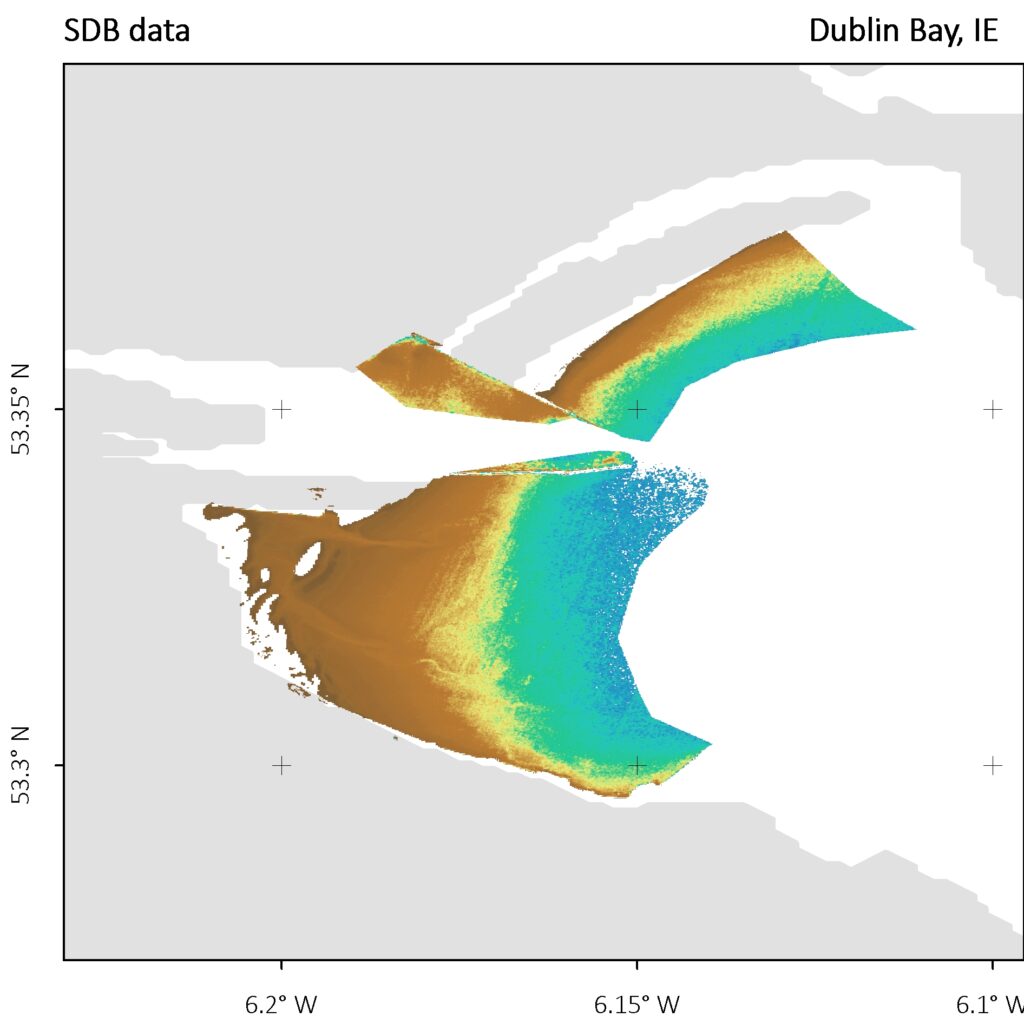
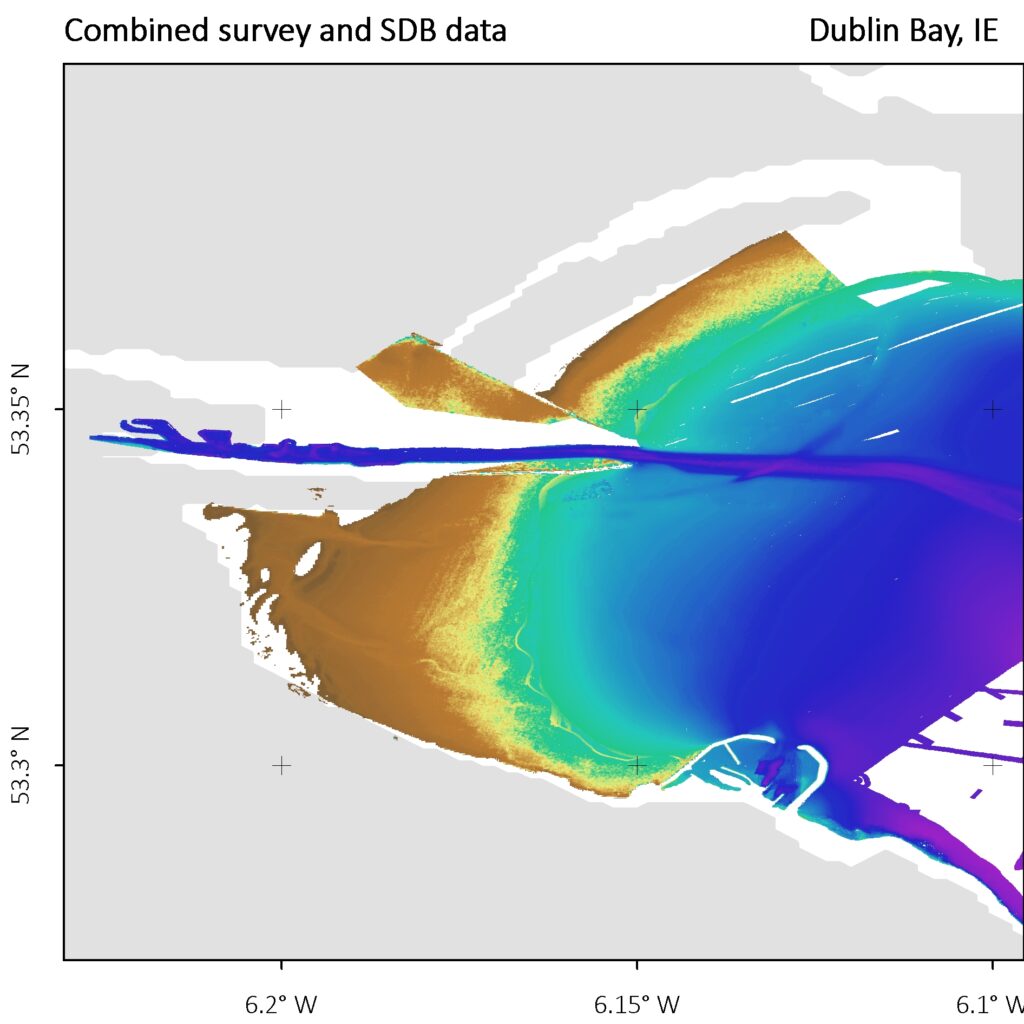
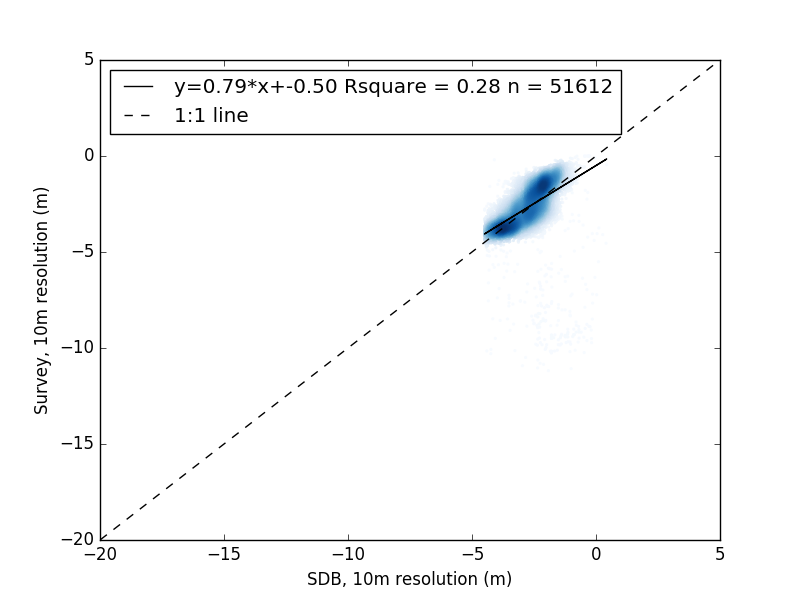
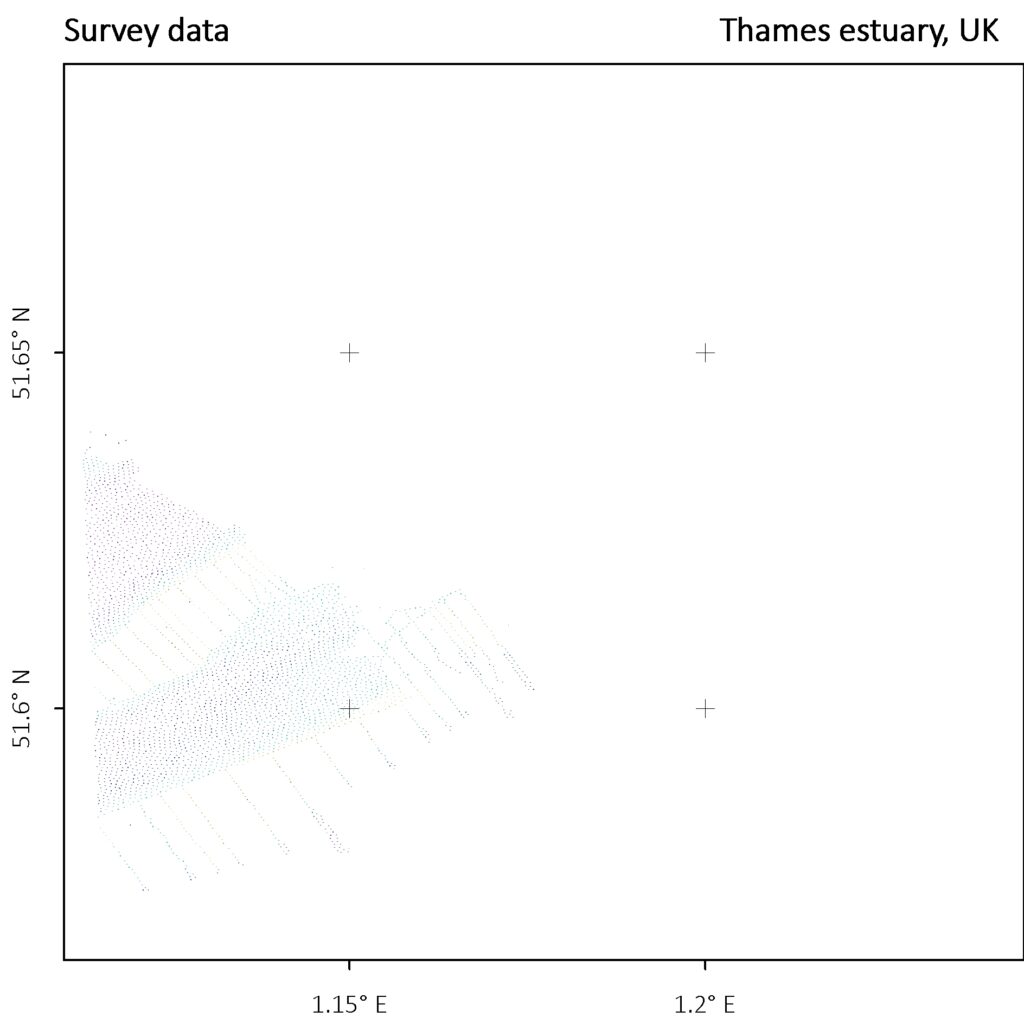
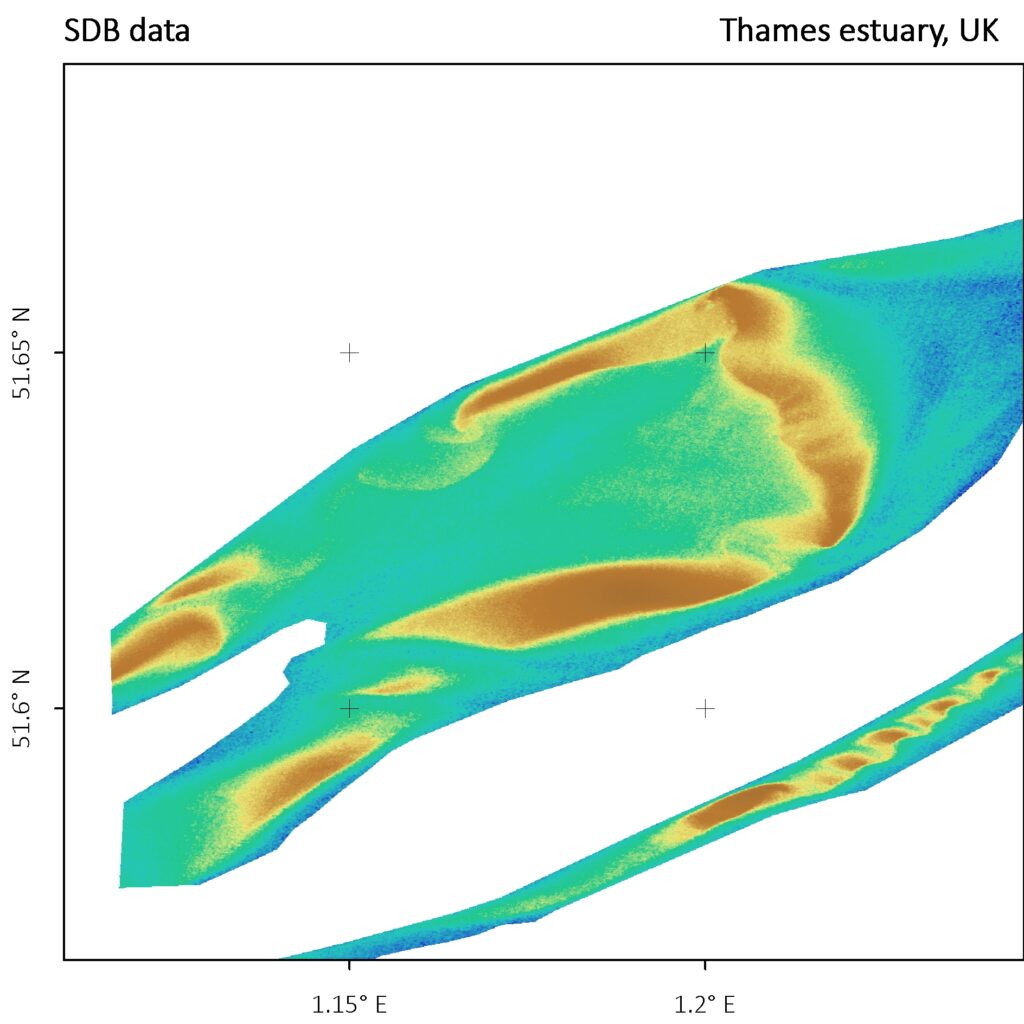
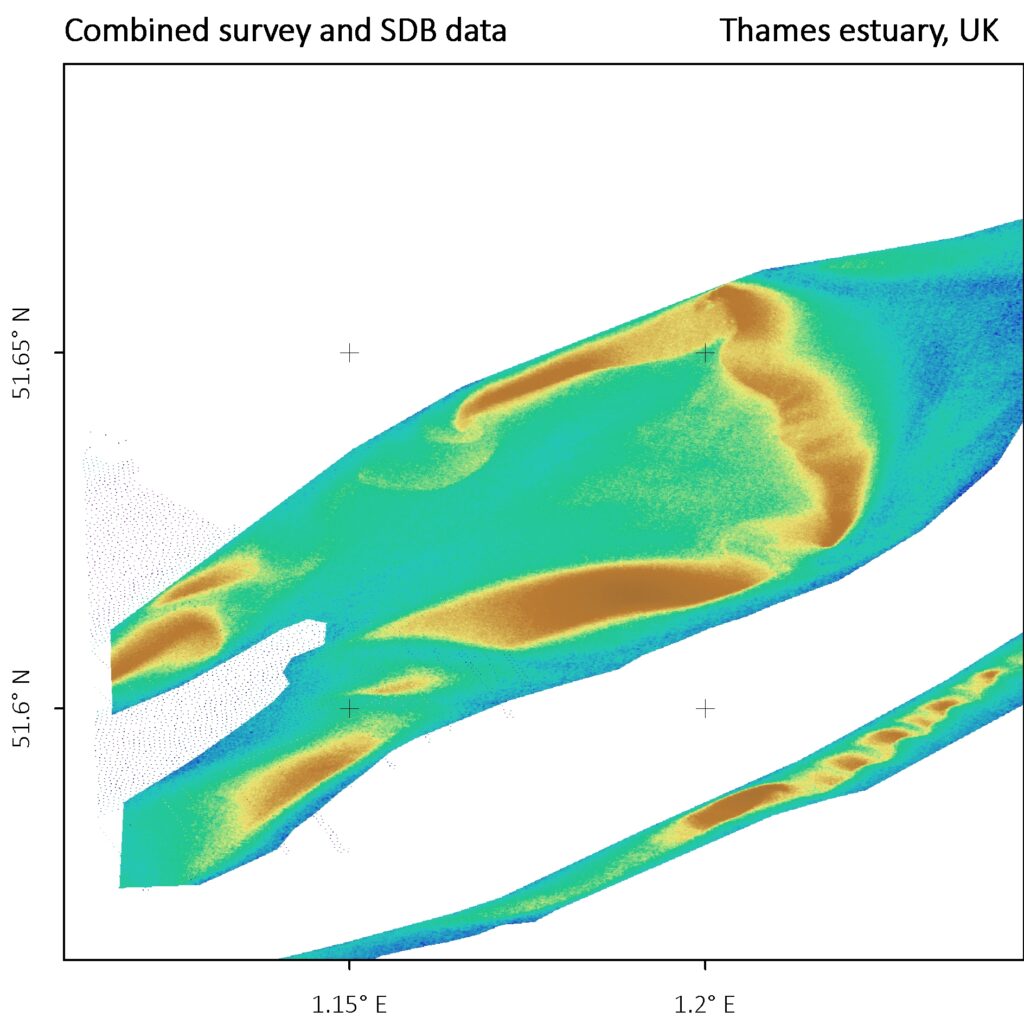
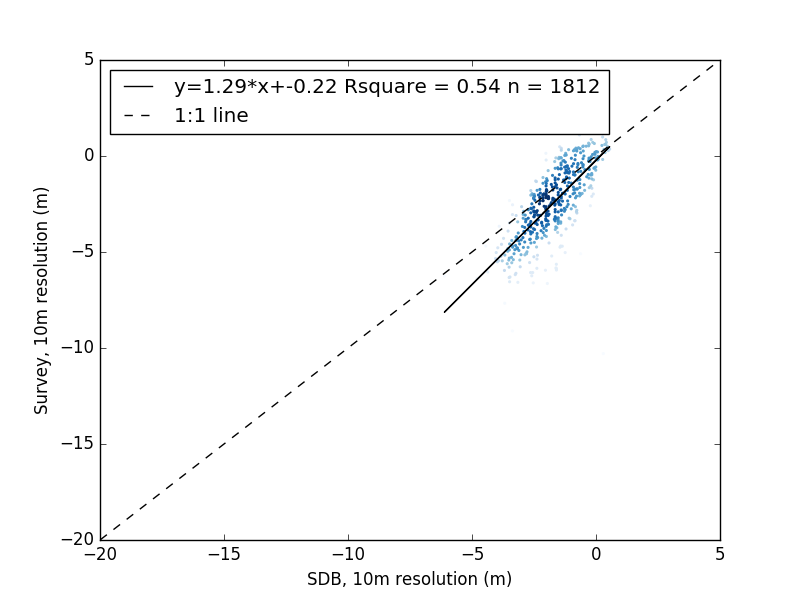
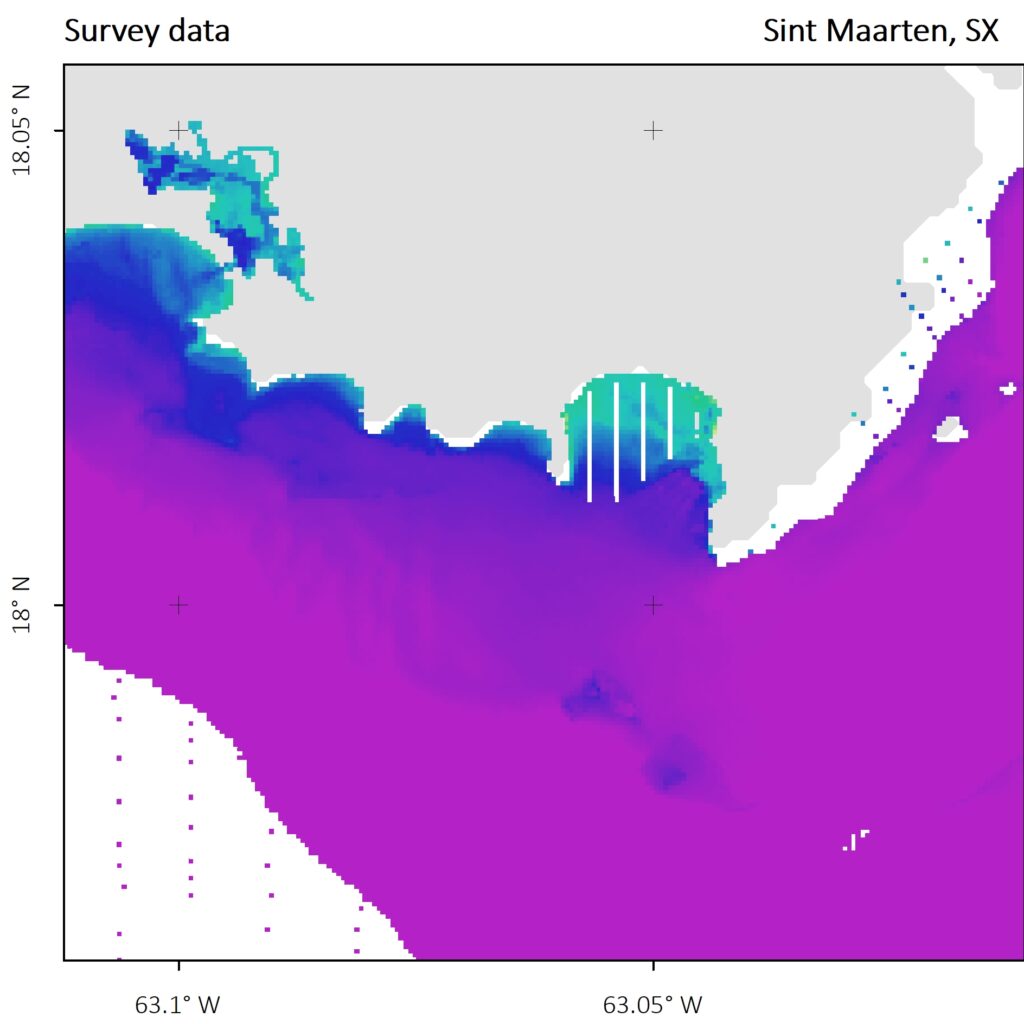
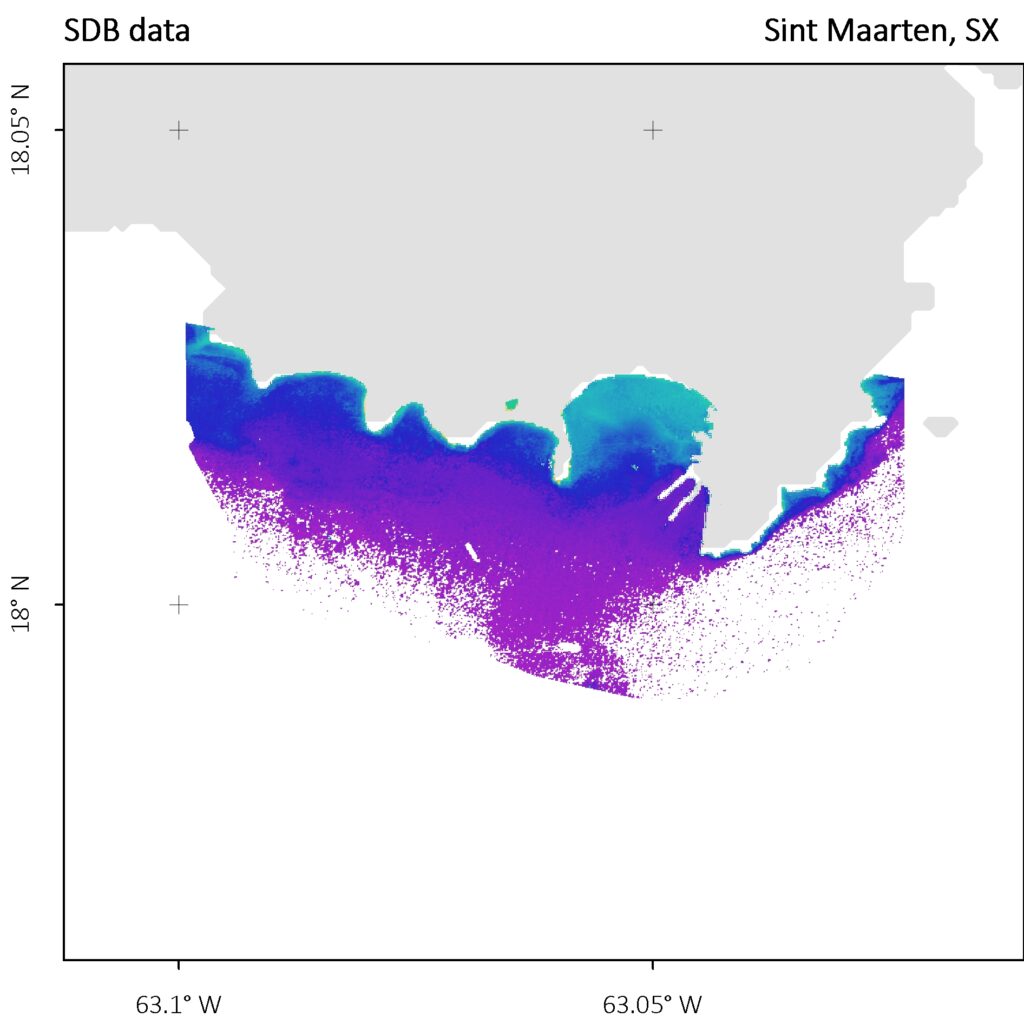
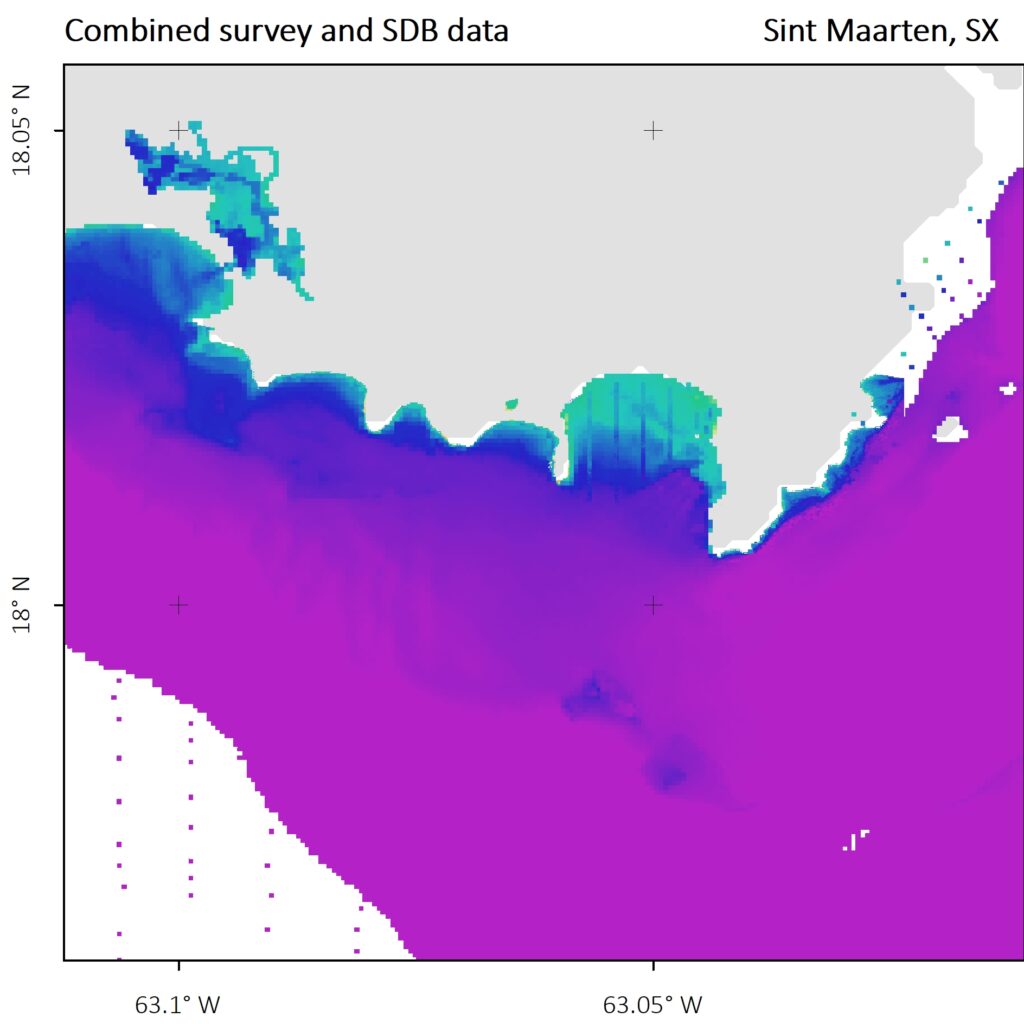
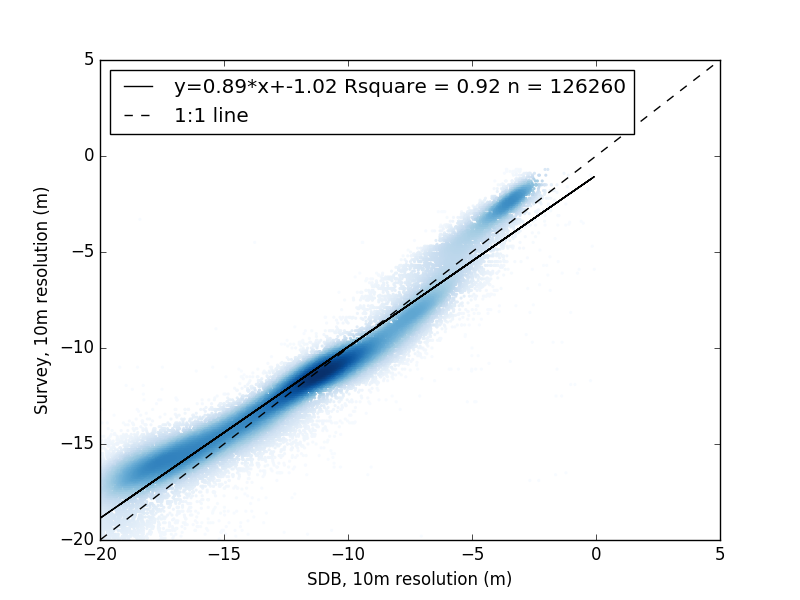
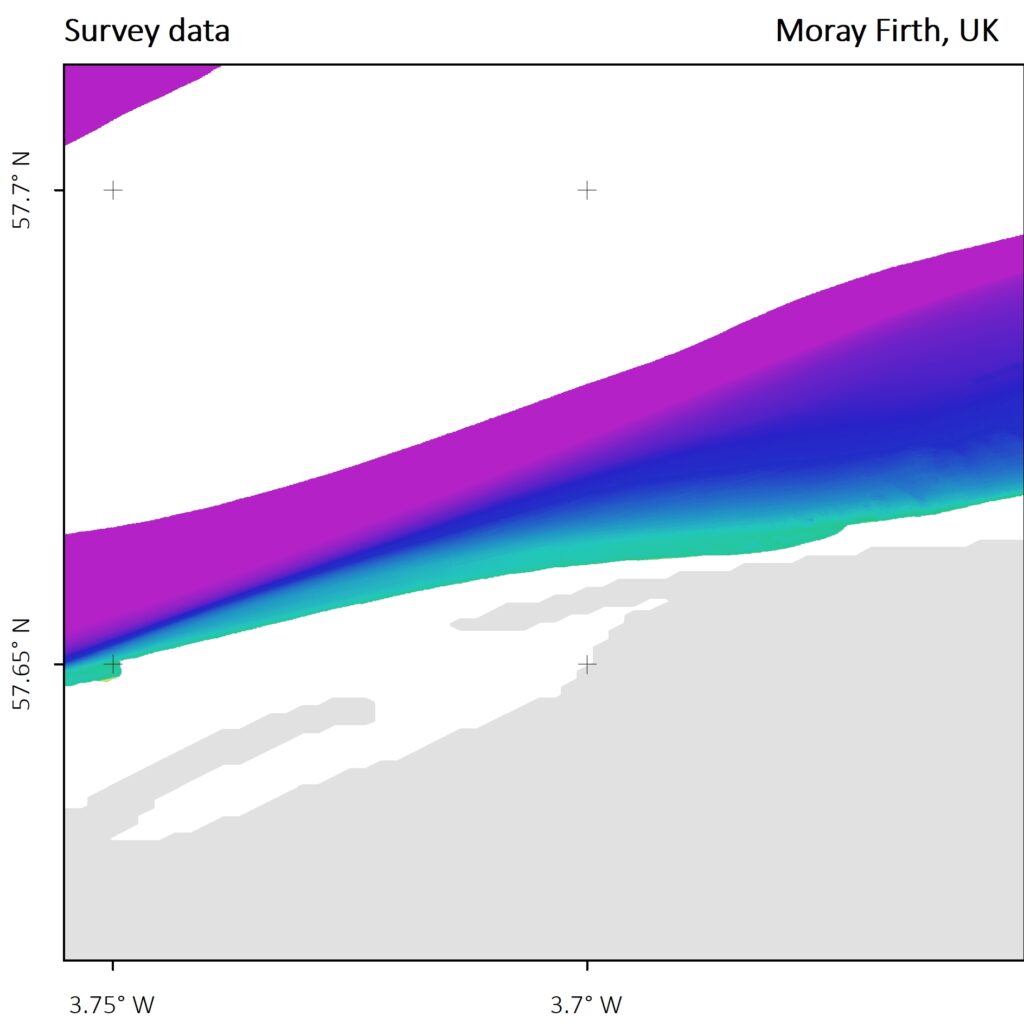
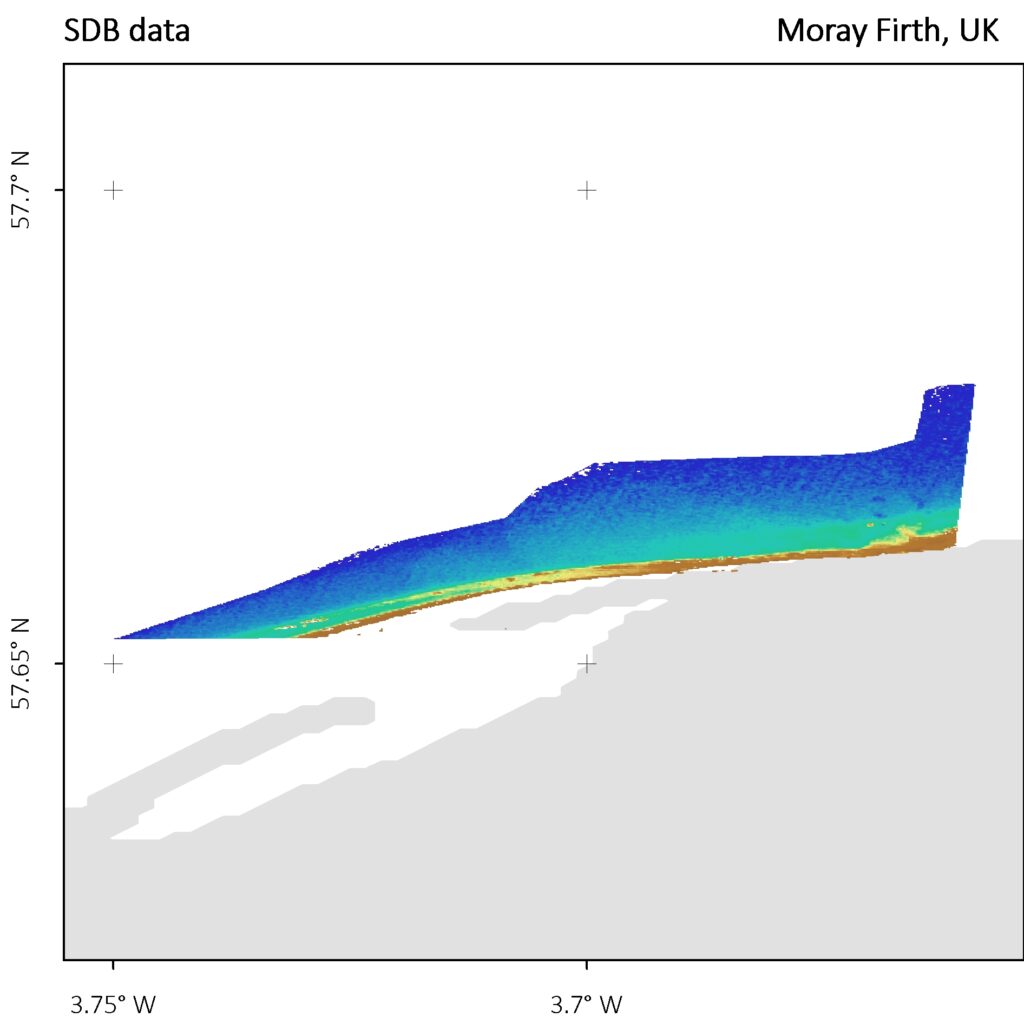
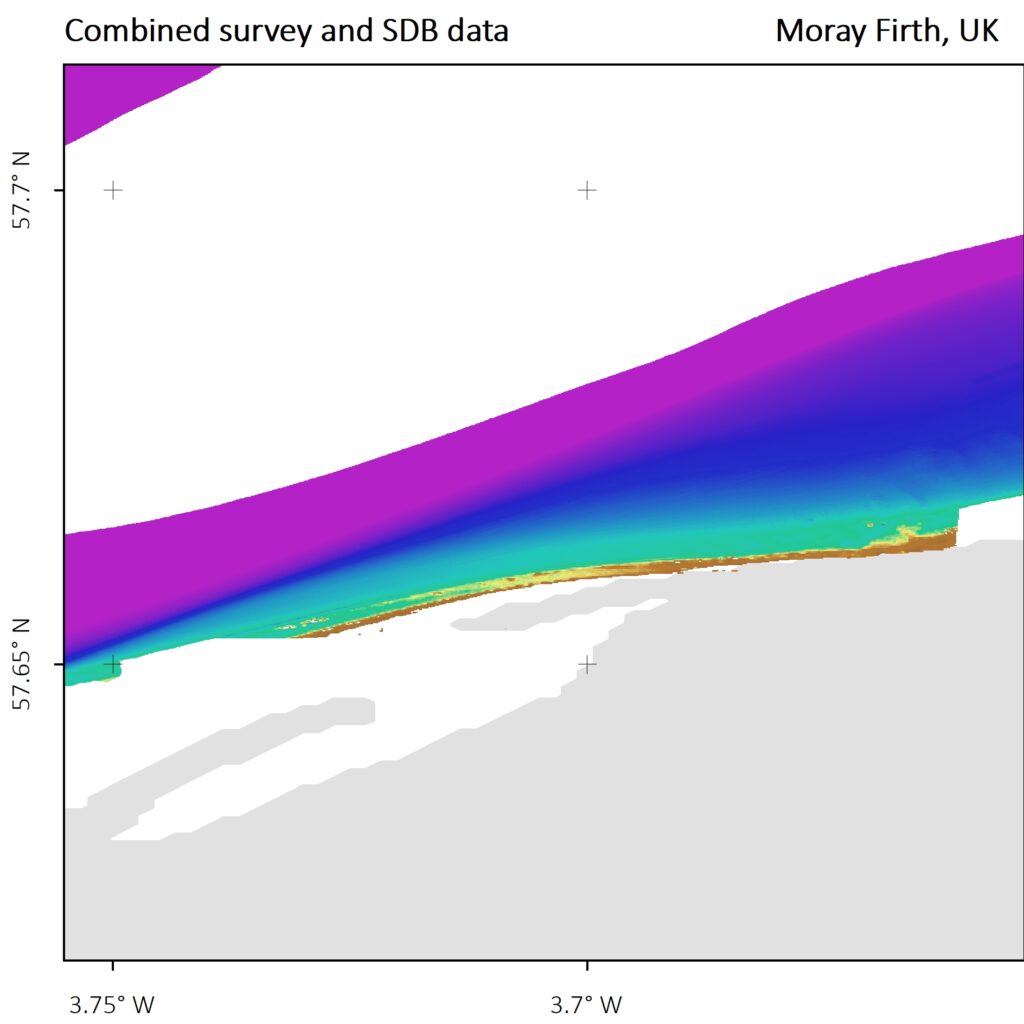
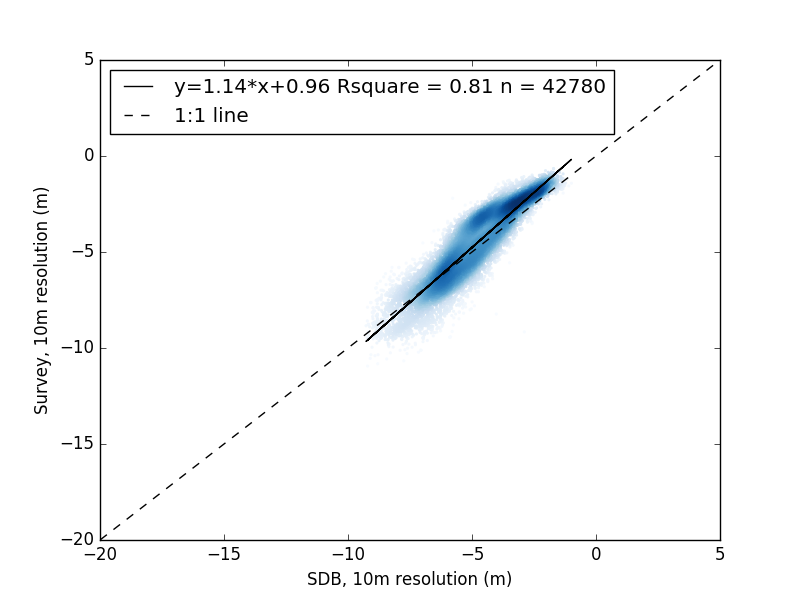
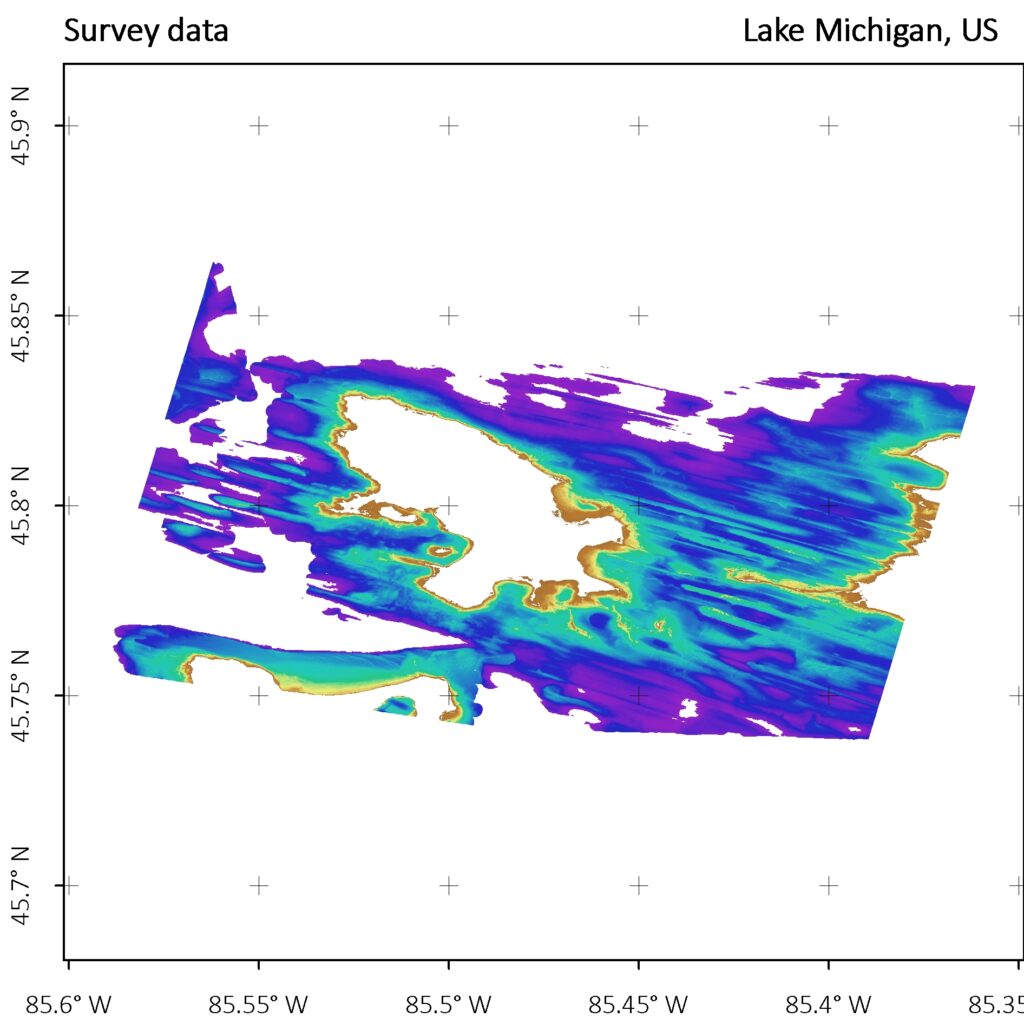
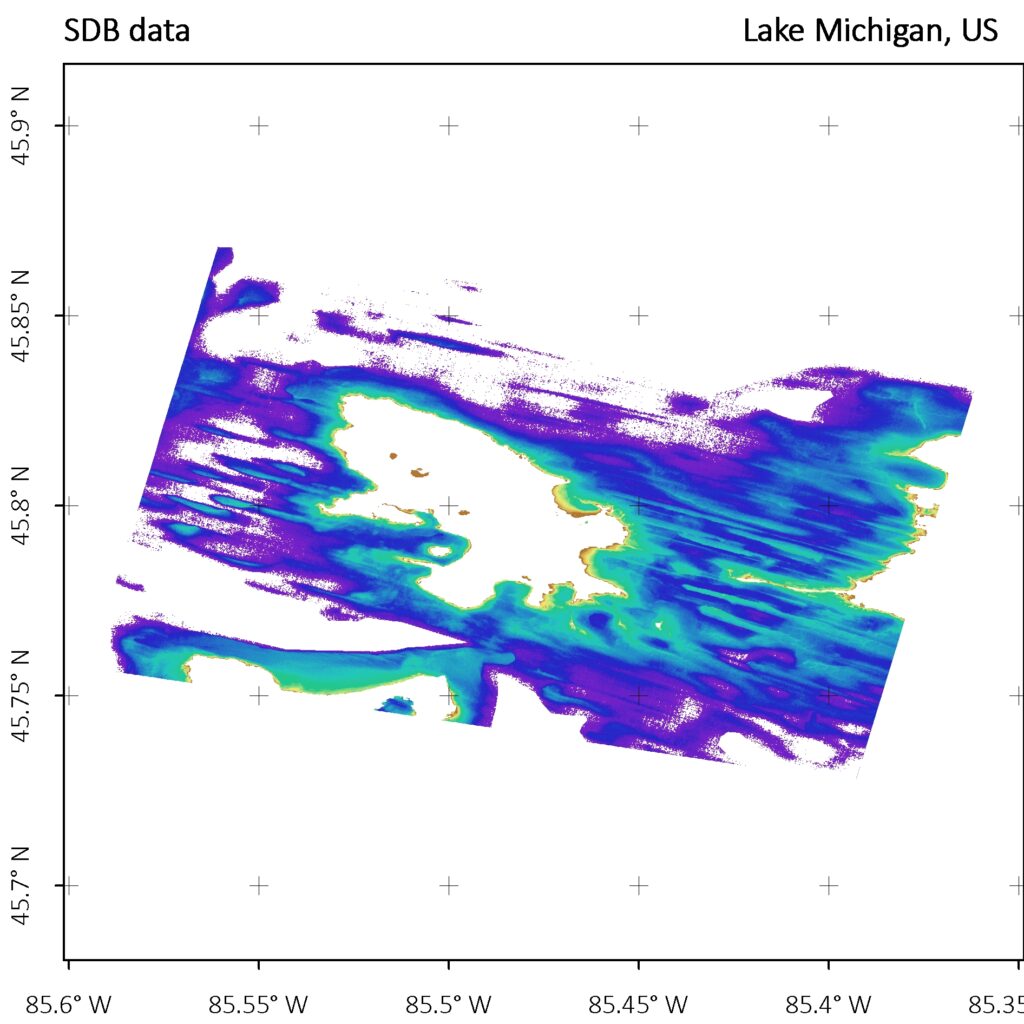
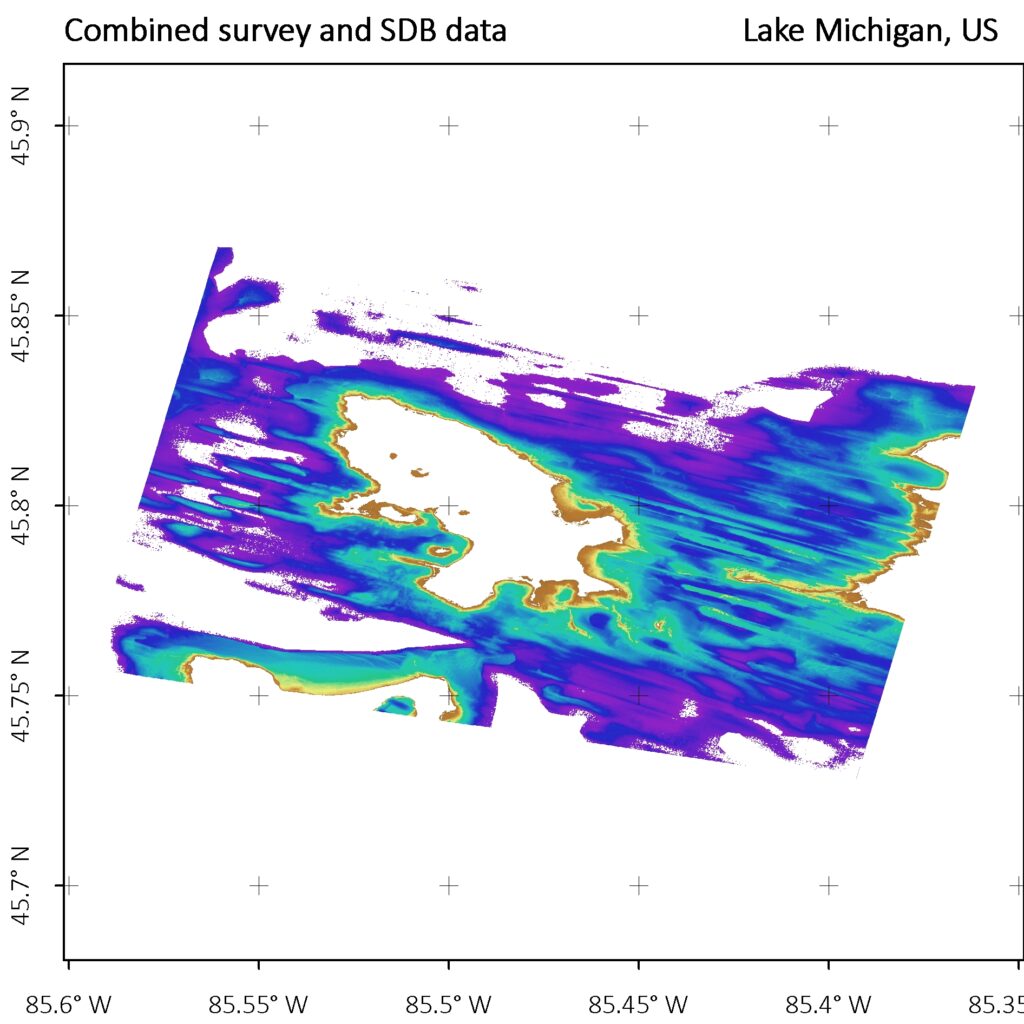
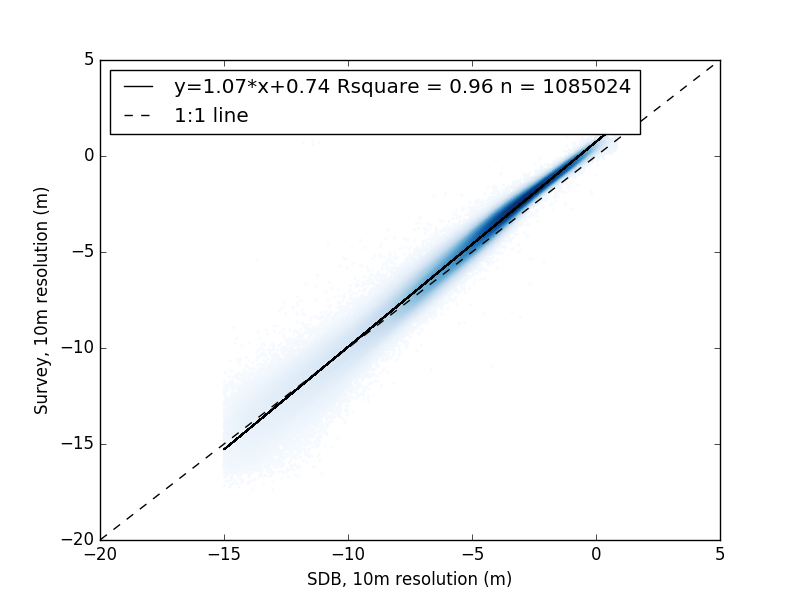
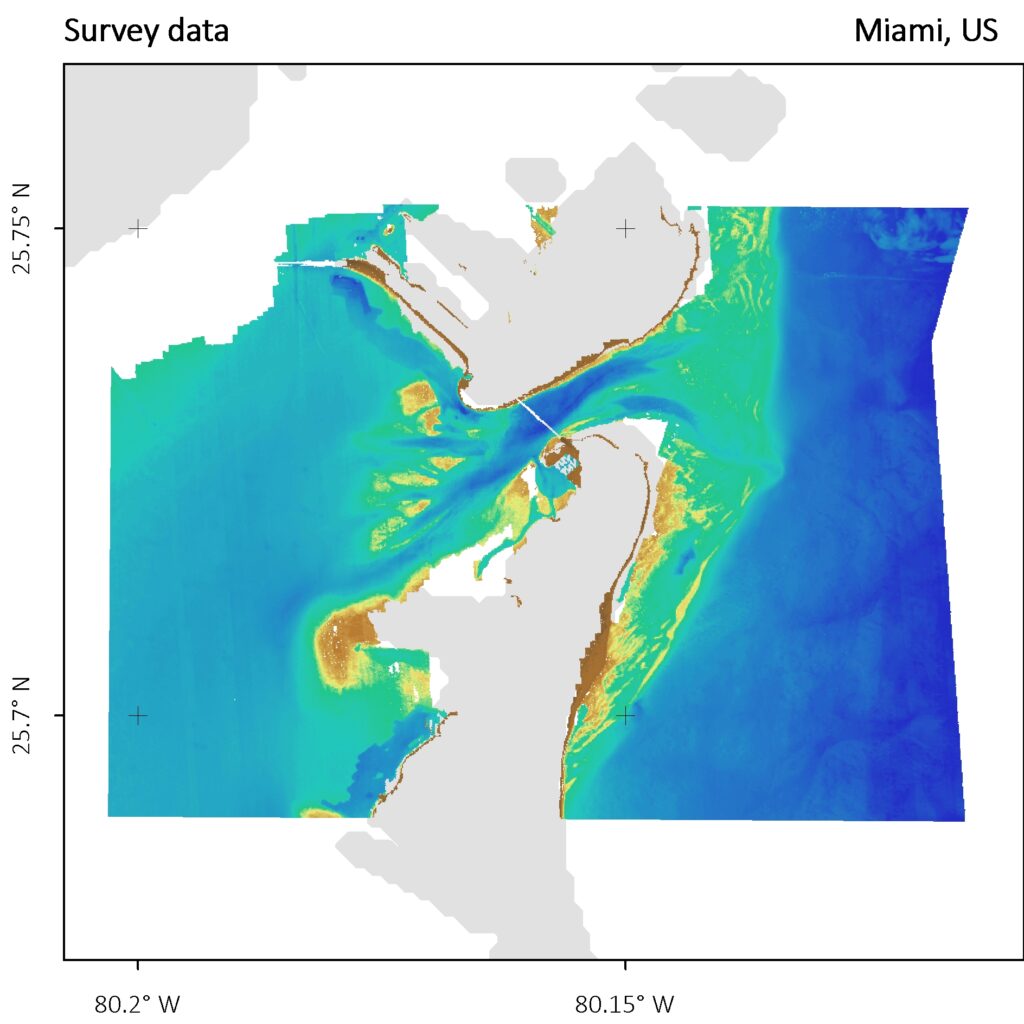
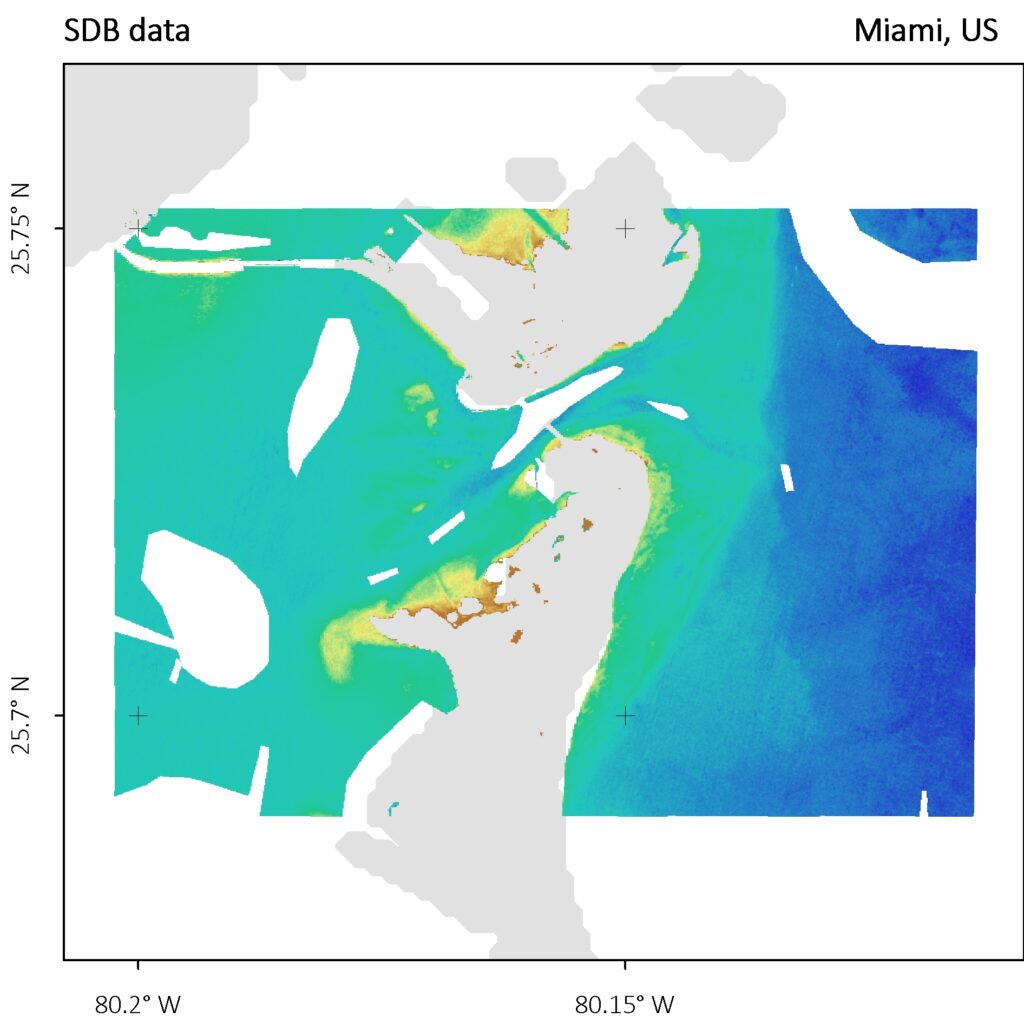
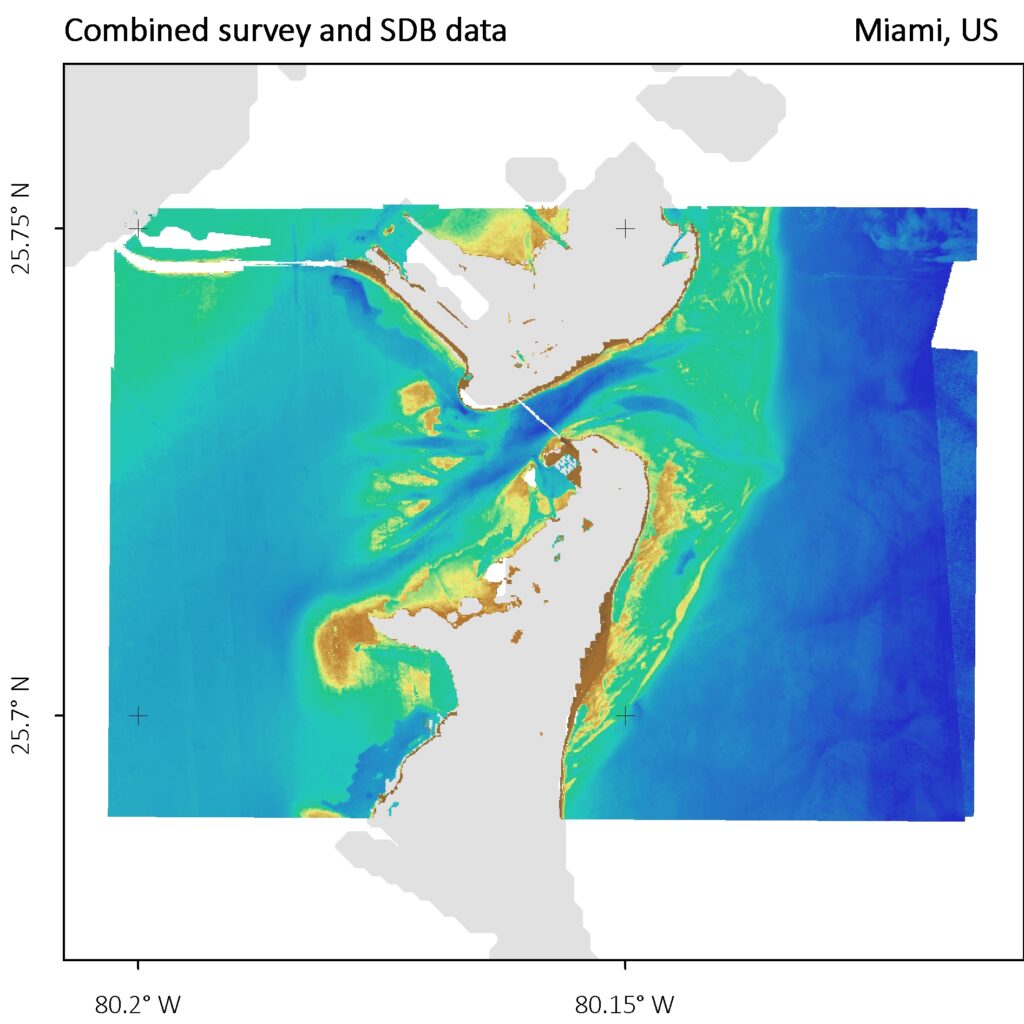
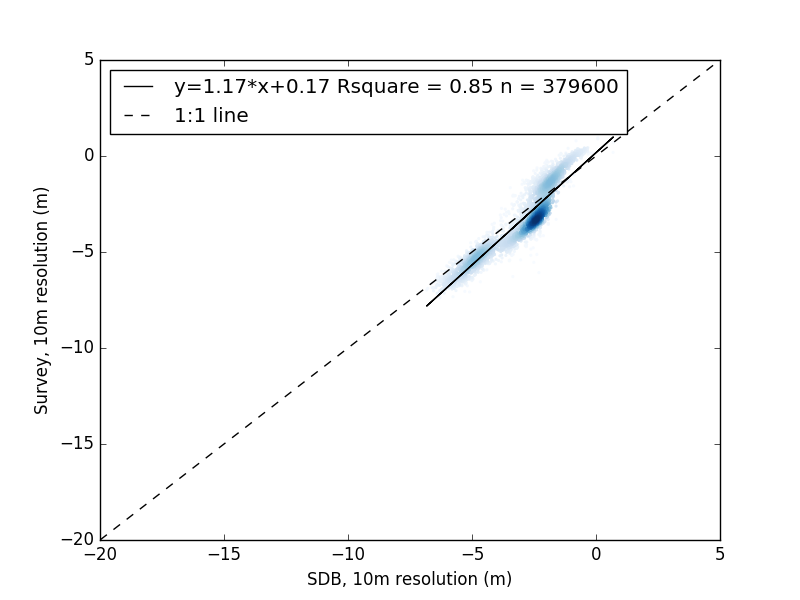
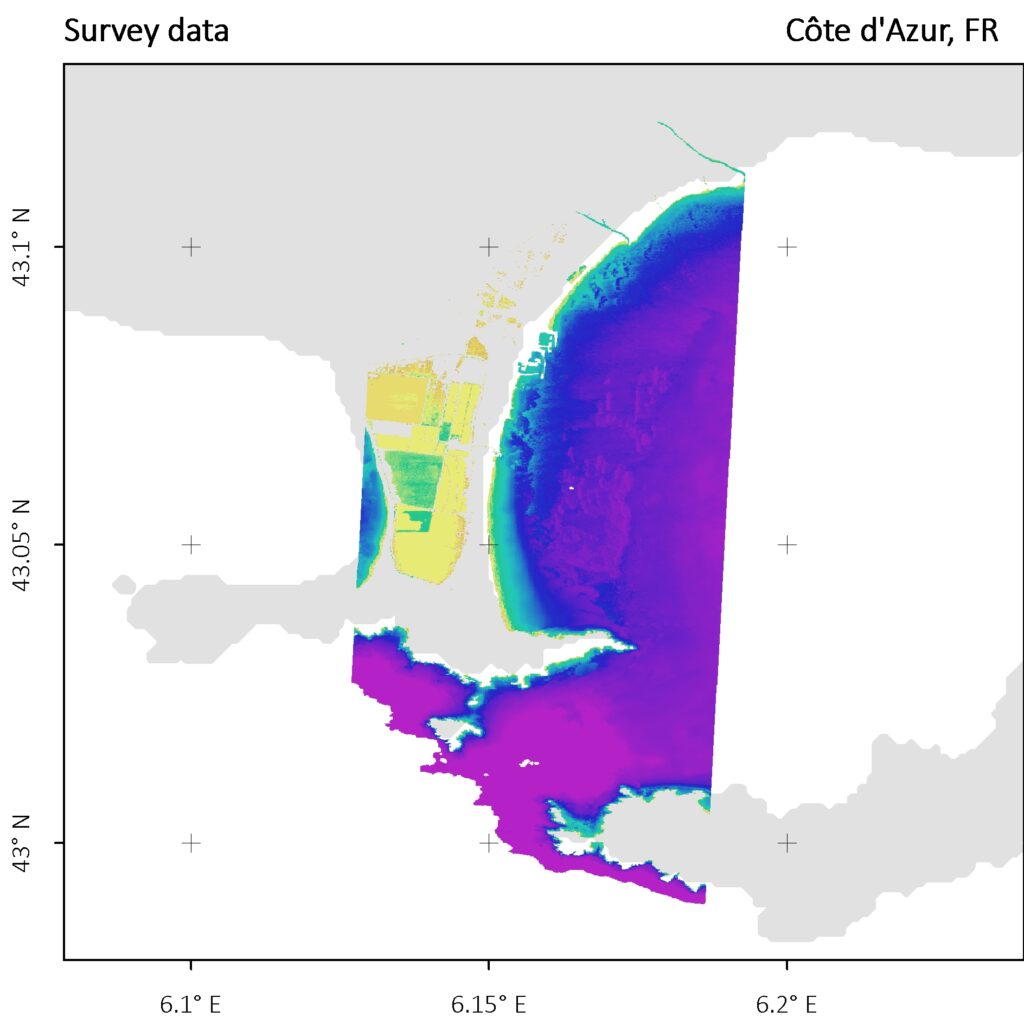
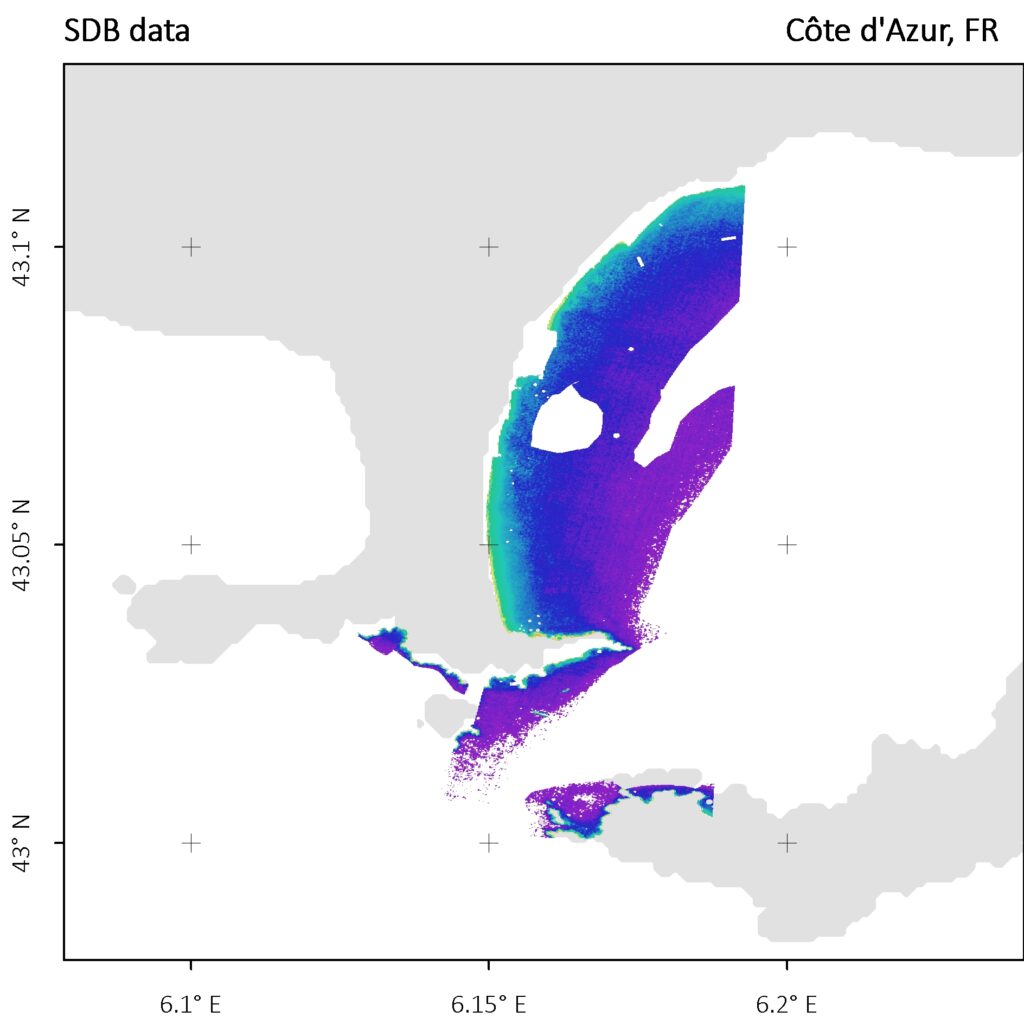
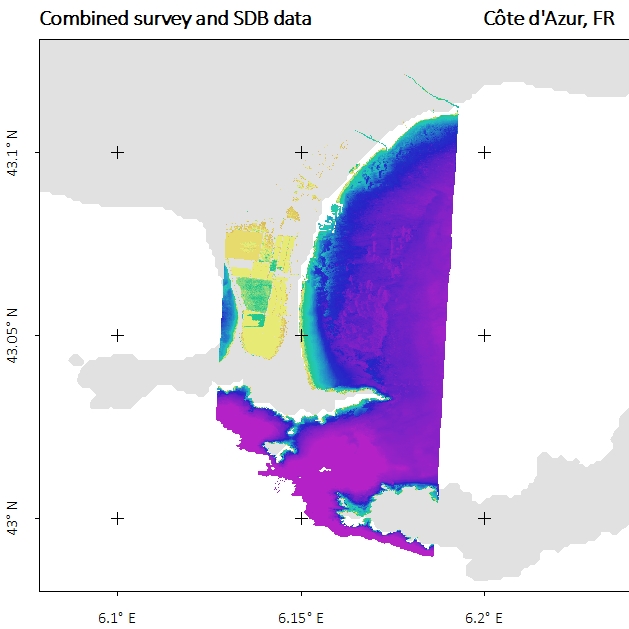
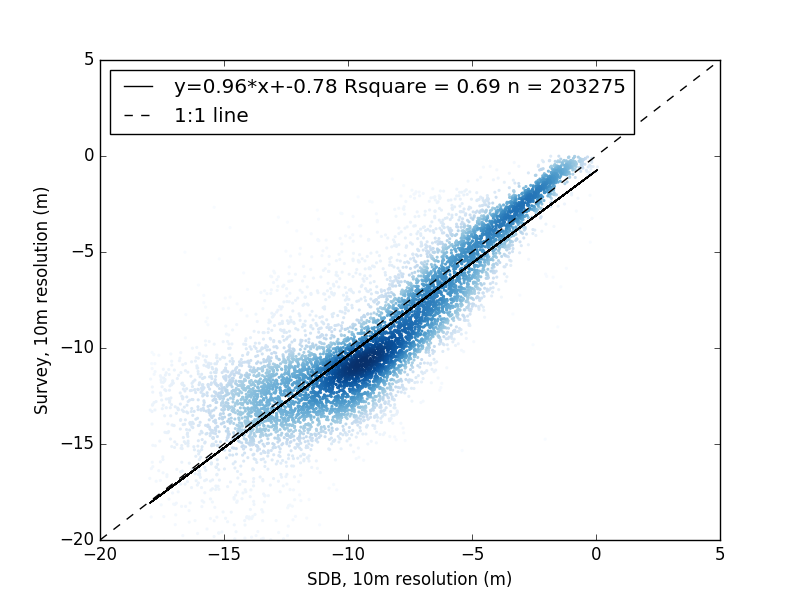
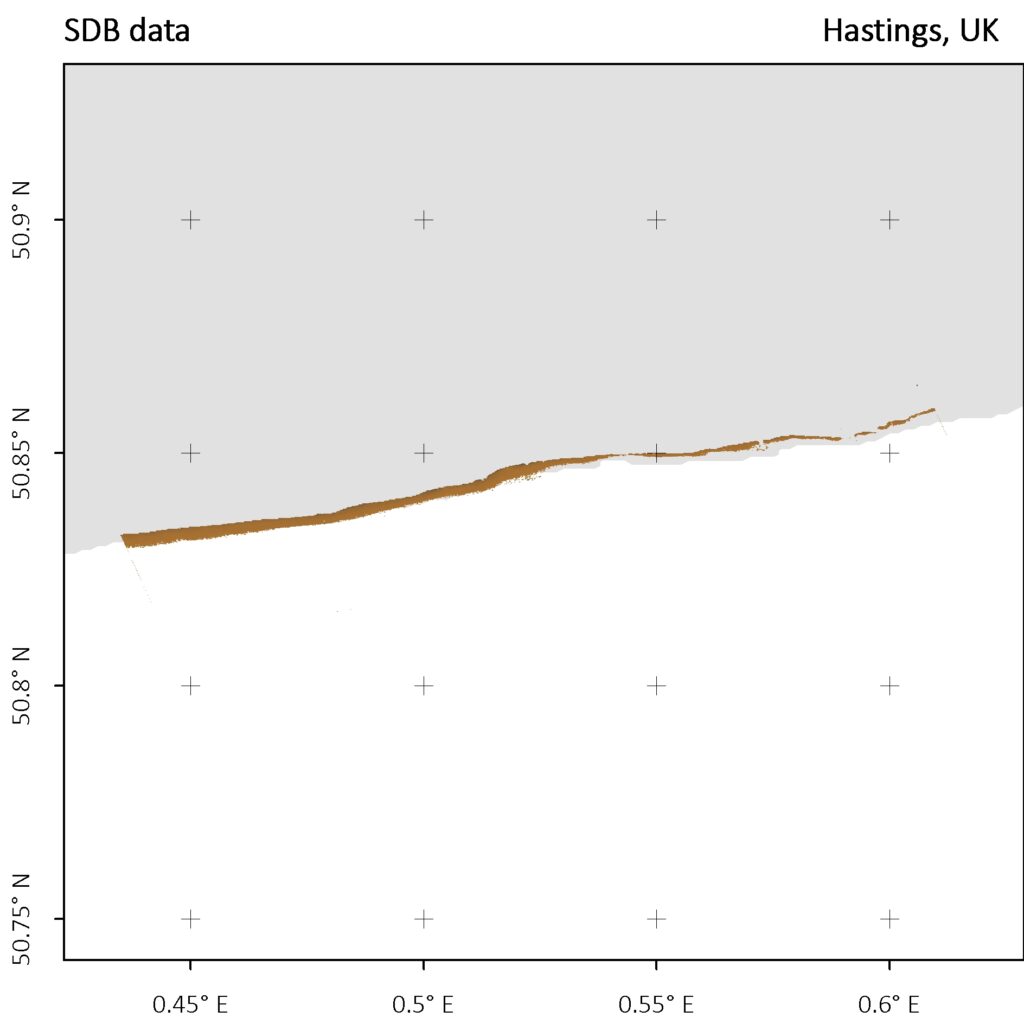
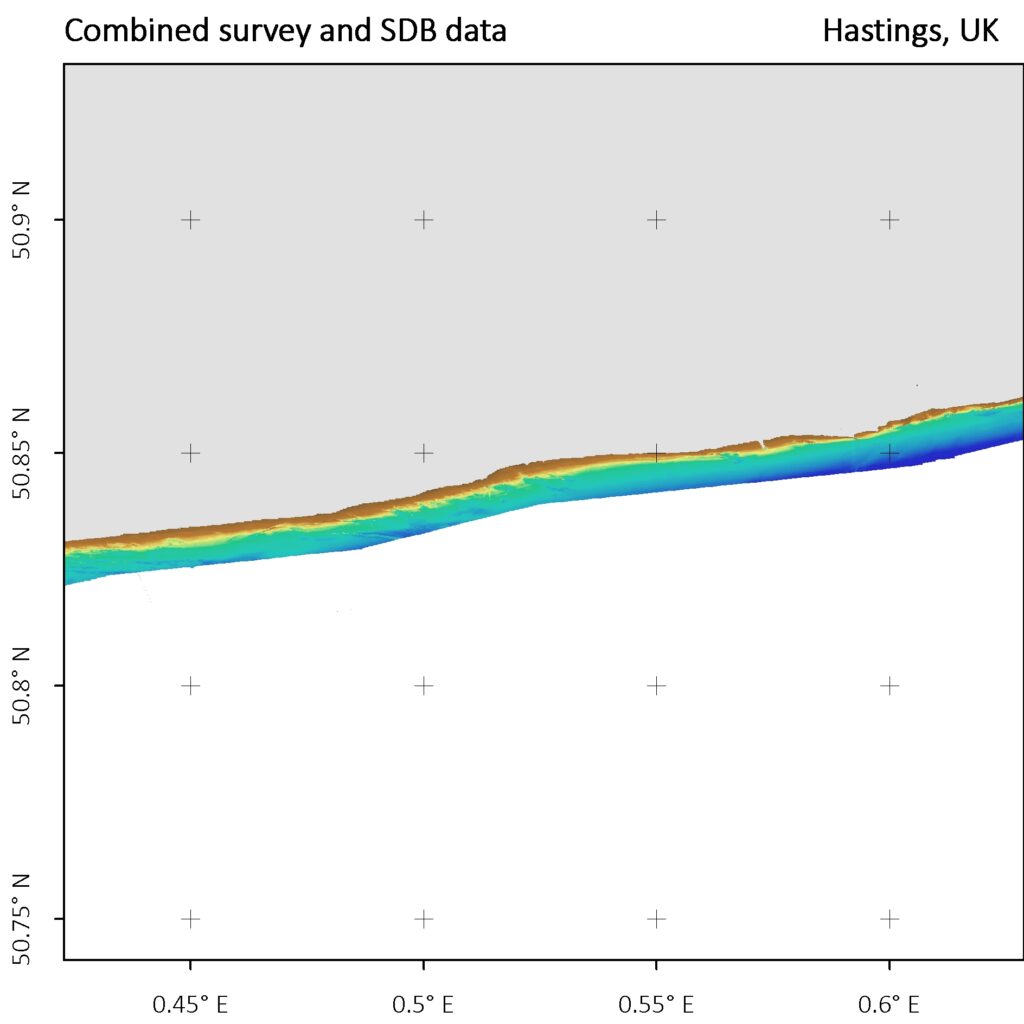
The following figures illustrate the SDB results (top right), the survey data which have been used for the validation (top left), the combined dataset where survey data overlays the SDB result (bottom left) and the scatterplot of SDB vs. survey data (bottom right). A detailed summary of the validation statistics are provided in Table 2, following the figures.
For Hooper, CA (Figure 4) and O’Reilly, CA (Figure 5), SDB data were mapped from shoreline down to approx. 12–15m (LAT). The SDB in the very shallow waters allows to fill data gaps of the acoustic survey. On the Hooper site, a shoal could be identified and mapped in the SDB data (centre) whose spatial dimension was not present in the single beam echo sounder surveys.
Dublin Bay’s water clarity allowed to map the seafloor down to 7.8 m at time of satellite image recording, which equals 5 m below LAT, whereas the MBES survey data did not cover the intertidal depth (Figure 6). The combination of both surveys allows for a seamless bathymetric grid from +3 m LAT down to deeper waters.
The single beam echosounder surveys of the Thames estuary site provide depth data for the vessel survey lines and contain data gaps between those lines (Figure 7). SDB-Online was able to provide depths down to 4m (LAT) and provided details of the morphology of the sandbanks. Although the selected satellite image represents – for this location – relatively clear water conditions, the turbidity impacted the SDB results and led to a slight underestimation of depth.
Sint Maarten, SX represented the water conditions with the clearest waters and allowed for SDB mapping down to 20m depth (Figure 8).
SDB data were created down to approx. 8m (LAT) for the Scottish site ‘Moray Firth’ and can fill data gaps of the echo sounder surveys (Figure 9). Moray Firth site’s water conditions were moderately turbid which can be identified in the greater difference between survey and SDB data.
The Lake Michigan site represents the only lake bathymetry which has been used in this study (Figure 10). The vertical datum of Lake Michigan is 176 meters above IGLD85 and both, the survey and SDB data use this reference datum. The satellite data was recorded at a time of excellent water conditions and SDB data were calculated down to a depth of approx. 15 m and in some areas exceeded the depth of the airborne lidar bathymetry data collection.
The Miami, US site includes more turbid waters in the western parts and less turbid coastal waters to the east (Figure 11). This also impacts the cutoff depth of SDB which is variable within this site. The cutoff depth at the eastern, coastal site has not been reached.
The French Côte d’Azur site was surveyed by very high resolution topographic-bathymetric lidar (Figure 12). SDB-Online created depth data down to approx. 18m. Very dark seabed of Posidonia Oceanica impacted the potential of the SDB performance and resulted in higher uncertainties in depth below -10m. A combination of survey and SDB data does not provide any added-value for this site, because the lidar data provide a full coverage.
The Hasting, UK site was the most turbid of all selected sites and has the most dynamic water levels (Figure 13). SDB data could be retrieved for depth down to 2.2m which represent only a portion of the intertidal heights. No significant coverage nor benefit in combination with the survey data could be achieved for this complex environment.
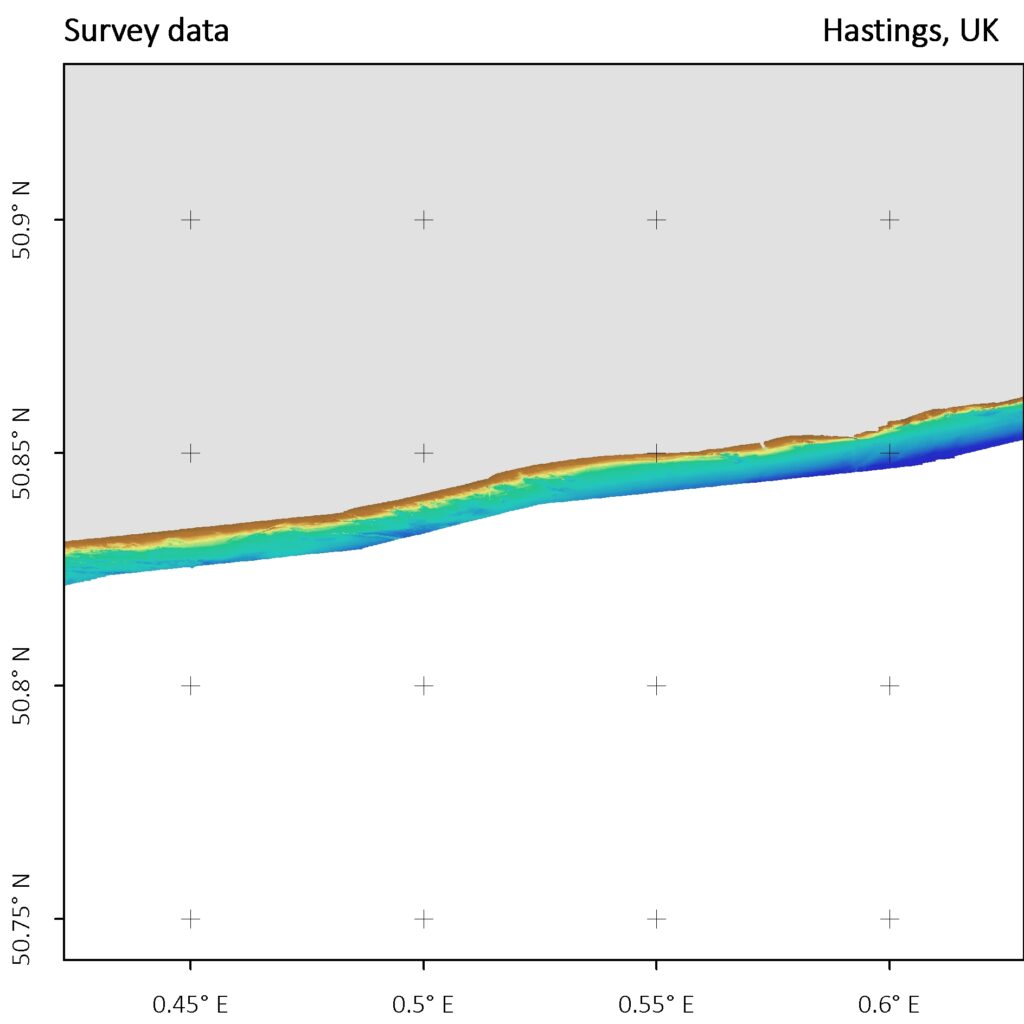
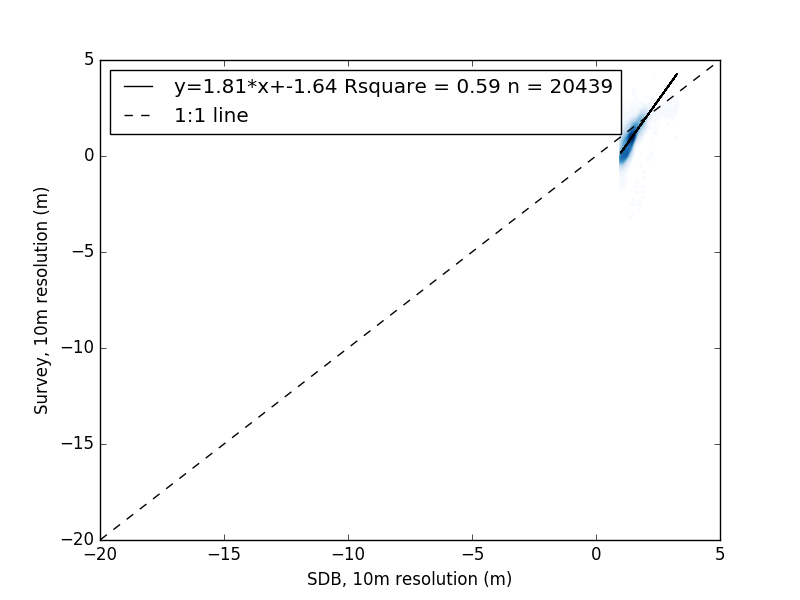
The SDB results were compared with survey data using the linear regression parameters of R², slope and intercept and analysed the percentage of the SDB data within four different IHO categories on vertical uncertainties. The statistics are provided for all ten sites (Table 2). Overall the SDB data and survey data are within a 1:1 linear relation with a variable slope of 0.79 (Dublin Bay, IE) to 1.29 (Thames estuary, UK) and high R² values from 0.69 to 0.96 and 0.28 to 0.54 for more turbid water conditions (Dublin Bay, IE and Thames estuary, UK). The site Hastings, UK has the smallest cutoff depth, highest turbidity and highest water level dynamics. Because of these circumstances, such areas are typically defined as not feasible for SDB techniques.
Satellite-Derived Bathymetry (SDB) methods have found their way into the hydrographers’ toolbox and are part of integrated survey concepts, nautical charts and support global and European programs such as Seabed2030 or EMODnet Bathymetry. The concept of the ‘physics-based’ SDB describes the calculation of bathymetry by modelling the sunlight path from the sun to the seafloor to the satellite sensor. It is a highly sophisticated model which enables the calculation of shallow water depth in the absence of any other survey or ground-truth data. Thus, bathymetric data can also be retrieved for remote and inaccessible areas – in contrast to empirical SDB approaches. Key questions which arise for SDB results are vertical accuracy, potential and feasibility for different sites and the methods to upscale SDB solutions.
These questions are addressed in the current European innovation project 4S. Within the project SDB-Online was developed, a fully physics-based SDB concept which is installed in a cloud and accessible via a web user interface. The backend is parallelised and can be accessed via application programming interface (API) which allows a fully scalable and automatic SDB processing. In this study SDB-Online results are validated at ten sites, ranging from the higher latitudes of Canada to turbid UK waters to the Caribbean. Furthermore, a relationship between the Secchi Disc Depth and the cutoff depth of the SDB results is established and a global map of water-clarity potential of the SDB solution is presented.
Speed performance
The speed performance of SDB-Online was measured for 100 separate SDB results with different area sizes and locations. As a rule of thumb SDB-Online provided the bathymetric outcome of a 50km2 site within one hour after start on two cores and 16GB RAM. Multiple hundreds of processes can be initialised in parallel so that a significant amount of area can be processed within short turn-around time. An analyst is mandatory for the final QA/QC and cutoff depth definition which adds to the total turn-around time.
Global potential of SDB
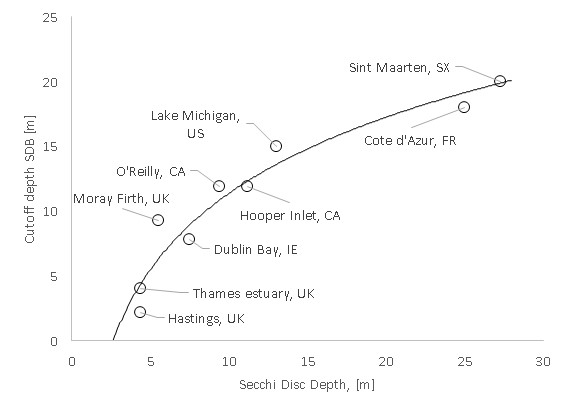
The maximum mapping depth/cutoff depth of the SDB results were depending on the local water conditions of the site and varied across them. The Secchi Disc Depth (SDD) values from Copernicus Marine observation (Copernicus-GlobColour) were assessed for the nearest location and recording date and compared to the cut-off depth of the SDB results. The comparison shows a relationship between the mapping depth and the SDD (Figure 14). Waters with SDD below 4mare known to be very challenging if not feasible which expresses in a none-linear relationship for the selected sites. Miami, US site was excluded in this study because the final SDB cutoff depth was not reached.
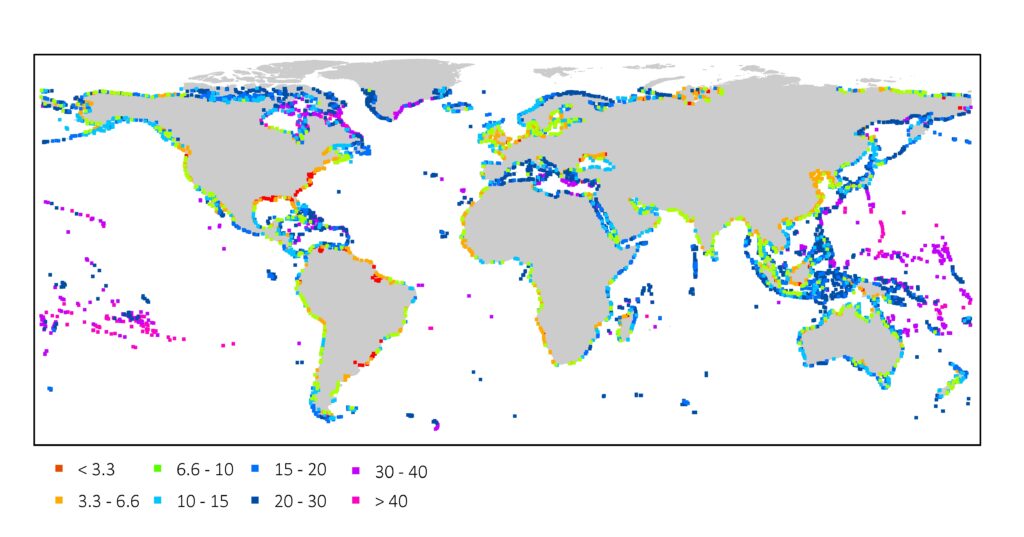
This relationship allows to provide a global map on the cutoff depth and thus water clarity potential of SDB. The following map shows the cutoff depth of SDB, which is based on the described relationship and Secchi Disc Depth4 of a 10 years average of the month with the clearest water conditions (Figure 15). The greatest SDB cutoff depth are found in the Pacific, Caribbean, Mediterranean Sea, followed by the Red Sea and offshore islands in the Indian Ocean and Canadian higher latitudes. The cutoff depth in these regions exceed 15m depth, which is in line with the outcomes of the SDB results of Sint Maarten and Côte d’Azur. Exceptions in these regions are found in mainland coastal regions of e.g. Indonesia, Brunei or Cuba where low Secchi Disc Depth reduces the SDB potential. Areas where water clarity strongly limits the SDB potential are fund in mid latitudes of east coast USA, the North Sea and China and where river inflows impact the water clarity such as the Amazonas delta. Other aspects which might influence SDB results, such as seabed type or ice coverage are not considered in this map.
4. DISCUSSION AND CONCLUSIONS
In this section different aspects of this study and the global potential of SDB are discussed and concluded.
SDB-Online’s physics-based SDB solution for accessing bathymetric data for un-surveyed areas
The study demonstrated the results, performance and accuracy of SDB-Online’s bathymetry across different environmental conditions. All SDB results were created without using local training or bathymetric data. As such, it represents a solution which can be applied globally and at different environmental conditions. This capability represents a significant advantage compared to empirical or semi-empirical SDB approaches which are depending on local on-site survey data and their vertical and horizontal accuracies and/or empirical relationships to transfer from one to another region.
Potential of combining SDB and survey data
It was demonstrated that the combination of SDB and additional bathymetric survey data is a powerful tool to fill data gaps in the shallow water zones inaccessible to survey as well as to verify SDB results. The benefits of this combination were demonstrated especially for Dublin Bay, IE, Moray Firth, UK, Hooper, CA and Thames estuary, UK. The example of the Thames estuary, where single beam surveys provided depth data across the survey lines showed that the combination with SDB data results in a better spatial understanding on the seabed morphology.
In this study the SDB process was not trained with any local survey data. However, such a combined survey of SDB and echosounder surveys is possible with SDB-Online and will reduce the vertical uncertainties of SDB. This refinement and the impact on vertical uncertainties was not part of the study.
Vertical accuracies and precision
The vertical accuracies were evaluated by comparing the survey data with the SDB results in the overlapping areas. Overall, the vertical accuracies can be classified as moderate in more turbid water conditions to good in clear water conditions. Besides of water clarity, the impact of very dark bottom of Posidonia Oceanica in the Cote d’Azur site on vertical accuracies and maximum mapping depth of SDB was identified.
The dynamic changes in seabed morphology (e.g. Thames estuary, UK and Dublin Bay, IE) were not quantified in this study and most likely resulted in a higher discrepancy between bathymetry at the date of the survey and at the date of the satellite image recording.
A detailed analysis on the precision and sensitivity analysis of SDB-Online’s SDB, methods to further improve vertical uncertainties, such as the integrated mulit-image processing or the use of very-high resolution satellite data were not part of is study, and will be published in upcoming publications.
Limitations and requirements
Certainly, the accuracy of specific runs with the physics-based SDB solution is dependent on the environmental conditions of the selected satellite image records. Therefore, particular care needs to be taken in order to access the most suitable satellite record(s) for the sites. ‘Most suitable’ typically represents record(s) with the highest water clarity, little to none impact of cloud, haze, sunglint and seastate, however also most recent or close to the use-case requested dates. The user of SDB-Online therefore needs to be able to interpret the suitability of the input satellite imagery prior to the SDB processing. The SDB-Online solution will provide outputs for all locations which are covered by water at time of satellite image recording. The cutoff depths of the single results need to be defined and might vary spatially with water clarity within the sites. This task is also an interpretation task which requires basic understanding on image interpretation.
The spatial resolution of SDB-Online’s results is currently at 10m, which means that each pixel covers 100 m2. Smaller obstructions or objects cannot be identified by this resolution. SDB based on very-high resolution commercial satellite sensors provides results of 1–2m spatial resolution and allow for a more detailed characterisation of the seabed morphology and obstructions. These sensors are supported by the MIP processor already, but currently not yet implemented in SDB-Online and included in future.
The relationship between the cutoff depth of SDB and Secchi Disc Depth could be identified and provide global estimate on the SDB cutoff depth. The map does not consider other aspects such as ice and cloud cover, seasonality, intensities of sunglint or local seabed colour which further impact the SDB potential locally. However, it identifies areas with the highest SDB potential, many of which are not accurately surveyed or charted.
5. CONCLUSION AND OUTLOOK
This study shows the potential and limits of bathymetry processing using SDB-Online for ten sites spread over Northern America, Caribbean Sea and Europe, covering different water types and environmental conditions. The underlying physics-based SDB approach enables a fully automated SDB processing independent of on-site survey data. The cloud environment, the parallelised workflow and programmatic integration of ESA’s Sentinel 2 data archive lead to a fully scalable, highly time-efficient and derivation of bathymetry surfaces.
The fully physics-based SDB approach can quantify and reduce uncertainties which arise from environmental impacts such as atmospheric conditions, sun glint or varying turbidity on an image-pixel level. This is most relevant, as its strength of SDB is the data provision over the large areas with unknown water depth. So far, the complexity to increasing accurately calculate the interfering environmental impacts still challenges the evolving SDB technology. Also, a detailed analysis and evaluation of the input satellite data is an indispensable prerequisite for the bathymetry derivation. To provide a regional assessment of feasibility for SDB, the Secchi Disc Depth is a suitable measure. Further limiting factor is e.g. a very dark seafloor coverage. Locally occurring impacts which are temporally limited can be reduced by using multiple satellite records to base the bathymetry derivation on. Such a multiple scene approach is already implemented in SDB-Online (not part of this study). Furthermore, additional individual depth measurements from e.g. lidar satellites such as IceSat-2, reduce uncertainties and already provide external quality controls (not part of this study). To recap, in this study we investigated the capability of the completely independent, automated SDB-online approach.
The combination of SDB with survey data shows a very high potential particularly with regard to filling gaps in survey data. Currently, the optional use of own survey data for a comparison with the SDB-Online results as well as for the refinement of this model is not integrated into the system and is accordingly the next essential step of further development.
The refinement of the spatial resolution by using very high resolution satellite image is already standard within the none online SDB software version. The integration of those data in SDB-Online is another important future development.
SDB-Online can be accessed at sdb-online.eomap.com.
6. ACKNOWLEDGEMENT
This project has received funding from the European Union’s Horizon 2020 research and innovation programme H2020-SPACE-2020 under grant agreement No 101004221.
7. REFERENCES
4S (2021). WP 2 -D2.1 Stakeholder Requirements Analysis. 4S – Satellite Survey Software Suite – a European Union’s Horizon 2020 research and innovation project under grant agreement No 101004221. None public publication.
Chénier, R., Faucher, M., Ahola, R., Shelat, Y. and Sagram, M. (2018). Bathymetric Photogrammetry to Update CHS Charts: Comparing Conventional 3D Manual and Automatic Approaches. ISPRS Int. J. Geo Inf., 7, 395. Copernicus-GlobColour. Global Ocean Colour (Copernicus-GlobColour), Bio-Geo-Chemical, L4 (monthly & interpolated) from Satellite Observations (1997-ongoing). https://doi.org/10.48670/moi-00281.
Hartmann, K., Heege, T., Wettle, M., Bindel, M. (2017). Satellite-derived bathymetry. An effective surveying tool for shallow-water bathymetry mapping. Hydrographische Nachrichten HN108-10. DOI:10.23784/HN108-10.
Heege, T., Häse, C., Bogner, A. and Pinnel, N. (2003). Airborne Multi-spectral Sensing in Shallow and Deep Waters. Backscatter p. 17-19, 1/2003.
Heege, T., Kiselev, V., Wettle, M. and Hung N. N. (2014). Operational multi-sensor monitoring of turbidity for the entire Mekong Delta . Int. J. Remote Sensing, Special Issues Remote Sensing of the Mekong, Vol. 35 (8), pp. 2910-2926.
Heege, T., Bogner, A. and Pinnel, N. (2004): Mapping of submerged aquatic vegetation with a physically based process chain. Remote Sensing of the Ocean and Sea Ice 2003. Editors: Charles R. Bostater, Jr. & RosaliaSantoleri. Proc. of SPIE Vol. 5233, ISBN: 0-8194-5116-9 pp. 43-50.
International Hydrographic Organization, Intergovernmental Oceanographic Commission, The IHO-IOC GEBCO Cook Book, IHO Publication B-11, Monaco, Sep. 2018, 416 pp – IOC Manuals and Guides 63, France, Sep. 2018, 429 pp.
Kisselev, V. and Bulgarelli, B. (2004). Reflection of light from a rough water surface in numerical methods for solving the radiative transfer equation. Journal of Quantitative Spectroscopy and Radiative Transfer 85, 419-435.
Kiselev, V., Bulgarelli, B. and Heege, T. (2015). Sensor independent adjacency correction algorithm for coastal and inland water systems. Remote Sensing of Environment, 157: 85-95. , ISSN 0034-4257, http://dx.doi.org/10.1016/j.rse.2014.07.025.
Kisselev, V. B., Roberti, L. and Perona, G. (1995). Finite-element algorithm for radiative transfer in vertically inhomogeneous media: numerical scheme and applications. Appl. Opt., 34, 8460-8471.
Niederjasper, M., Hartmann, K., Steinsiek, M., Bödinger, C., Rump, S., Filippone, M., Stender, M., Lampe, C. and Adhiwijna, D. (2020). HN116 Satellite-derived bathymetry in practice. 116. 40-47. 10.23784/HN116-06. URL: https://www.researchgate.net/publication/343344660_HN116_Satellite-derived_bathymetry_in_practice.
8. AUTHORS BIOGRAPHIES
Dr. Knut Hartmann is working at EOMAP since 2011 and his passion and profession are all aspects of data analytics of our shallow water and coastal zones. Prior to joining EOMAP he worked as geodata analyst in industry and research. Knut holds a PhD of natural science and graduated at the Technical University Braunschweig. Email: hartmann@eomap.de
Mona Reithmeier is lead of SDB-Online and Earth Observation data analyst at EOMAP. She graduated as MSc in Geography at the Ludwig-Maximilians-University Munich in 2019.
Dr. Kim Knauer, a graduated MSc of Geography and PhD in natural sciences is innovation manager at EOMAP. He joined the team in 2017 and leads, amongst others the Horizon2020 innovation project 4S. Prior to working for EOMAP, he was employed at the German Aerospace Centre DLR and the Luxembourgish research centre Gabriel Lippmann.
Julian Wenzel graduated as physicist at the Ludwig Maximilian University, Munich in 2015 with the topic ‘Analysis and Improvement of a fully automatic satellite-based water color processor’. Julian is chief scientist at EOMAP and leading the team of four researchers.
Christoph Kleih is a fullstack software developer at EOMAP. He joined EOMAP in 2009, holds a Bachelor of Engineering degree in Geoinformatics and is skilled in Earth Observation workflow systems.
Dr. Thomas Heege is CEO and founder of EOMAP. Before 2006 he was project manager at the German Aerospace Centre DLR, scientist at aquatic institutes in Konstanz and Munich. Thomas graduated as Physicist in 1993 and received the PhD about airborne remote sensing of water quality in 2000 at the space sciences institute of Free University of Berlin.
- https://sentinel.esa.int/web/sentinel/missions/sentinel-2
- https://sdbday.org/conference-materials/ (video records of the SDB Day conference 2021)
- aviso.altimetry.fr
- Global Ocean Colour (Copernicus-GlobColour), Bio-Geo-Chemical, L4 from Satellite Observations (1997-ongoing). https://resources.marine.copernicus.eu/product-detail/OCEANCOLOUR_GLO_BGC_L4_MY_009_104/INFORMATION