
Preamble
This manuscript is a reprint of the original paper previously published in 1929 in the Hydrographic Review, a predecessor journal of The International Hydrographic Review (IHR, https://ihr.iho.int/): Marmer, H. A. (1929). Hydrographic datum planes. Hydrographic Review, 6 (1), 37–51. https://journals.lib.unb.ca/index.php/ihr/article/view/28153
1 Introduction
In order that the navigator may readily determine safe lanes of travel, it is of prime importance that he have at hand charts showing the depth of water in the region through which his vessel is to pass. But the rise and fall of the tide causes the depth at any point to vary continually. How then is the depth to be represented on such charts? Manifestly the first step in the solution of the problem is to consider the depth as consisting of two parts, the first invariable and the second variable. The variable part depends on the stage of the tide, data for determining this being given in tide tables. The invariable part is shown on hydrographic charts as the depth below some fixed datum. Thus arises the need for hydrographic datum planes.
In the tide tables too, the rise and fall of the tide must be given with reference to some datum. Obviously it is of advantage, for any region whatsoever, to use the same datum for both tide tables and charts; since the depth at any time will be derived immediately on applying the data in the tide table to the depths shown on the chart. It would therefore appear at first thought as if it made little difference what datum plane was used on hydrographic charts, so long as the same datum was used in the tide tables. This, however, is not the case, as will appear presently.
The first datum plane that suggests itself as suitable for referring depths in the sea is that of mean sea level. Indeed, in a sense the depth at any point may be said to be its depth at mean sea level, for it is clear that while the actual depth at that point is continually changing, being sometimes more and sometimes less than the mean sea level depth, its average depth is that reckoned from mean sea level. And for many purposes mean sea level is the most satisfactory datum from which to reckon depths.
For the purpose of the navigator, however, a low water datum is much more satisfactory. The critical depths in navigation are those in shoal areas in which the depth is insufficient for the draft of the vessel. The approximate minimum depth at any point obviously occurs when the tide is at low water. Hence, by using a low water datum, the depths shown on the chart give directly the approximate minimum depths. Another advantage a low water datum has for hydrographic purposes is that with such a datum the corrections to depth for stage of tide are predominantly positive, while with the datum of mean sea level these corrections would be half positive and half negative. For these reasons nautical charts, without exception, make use of some low water datum plane to which the depths shown are referred.
If the tide fell to the same depth at each low water the problem of hydrographic datum planes would be a simple one. Under such conditions there would be but one low water datum and a single low water observation would be sufficient for its determination. But, unfortunately, the fall of low water varies from day to day, this variation being in part periodic and in part non-periodic. At the very outset therefore the hydrographer is faced with the two aspects of the problem, namely, the choice of a suitable low water datum plane, and the accurate determination of this plane.
2 Types of tide
Not only does low water vary from day to day, but this variation is found to be different at different places. In fact, at first glance it appears as if the tides at different places have nothing in common except the bond which relates them to moon and sun as the exciting causes. In the time of occurrence of low water, in the extent of its fall and in the character of the variations which it exhibits, there is bewildering variety. Various classifications of the tide may therefore be made depending on the characteristics chosen as criteria.
In connection with the problem of datum planes, it is of advantage to classify the tide into various types so that as soon as the type of tide becomes known, its general characteristics become known and the hydrographer is then in a position to choose the most suitable datum plane. The most satisfactory classification of tides is that with reference to the form of the tide curve and to the periods of rise and fall. In accordance with this classification, tides may be grouped under three general types known respectively as semidaily, daily, and mixed types of tide. Instead of semidaily and daily, the terms semidiurnal and diurnal are frequently used.
The semidaily type is one in which two high and two low waters occur in each tidal day, the morning and afternoon tides resembling each other closely. The daily type is one in which there is but one high water and one low water in a tidal day. The mixed type of tide is one in which there are two high and two low waters in a tidal day, but with considerable differences between the morning and afternoon tides. In this connection it is to be recalled that the tidal day has the same length as the lunar day, namely 24 hours and 50 minutes.
The well-known sine or cosine curve may be taken to represent, in idealized form, the semidaily and daily types of tide, the semidaily having two maxima and minima in a day and the daily but one maximum and one minimum. These types of the tide are therefore of a relatively simple character. The mixed type is more complex, consisting as it does of a mixture of the daily and semidaily types. Numerous forms of the mixed type arise, depending on the relative magnitudes of the daily and semidaily constituents and on their differences in phase.
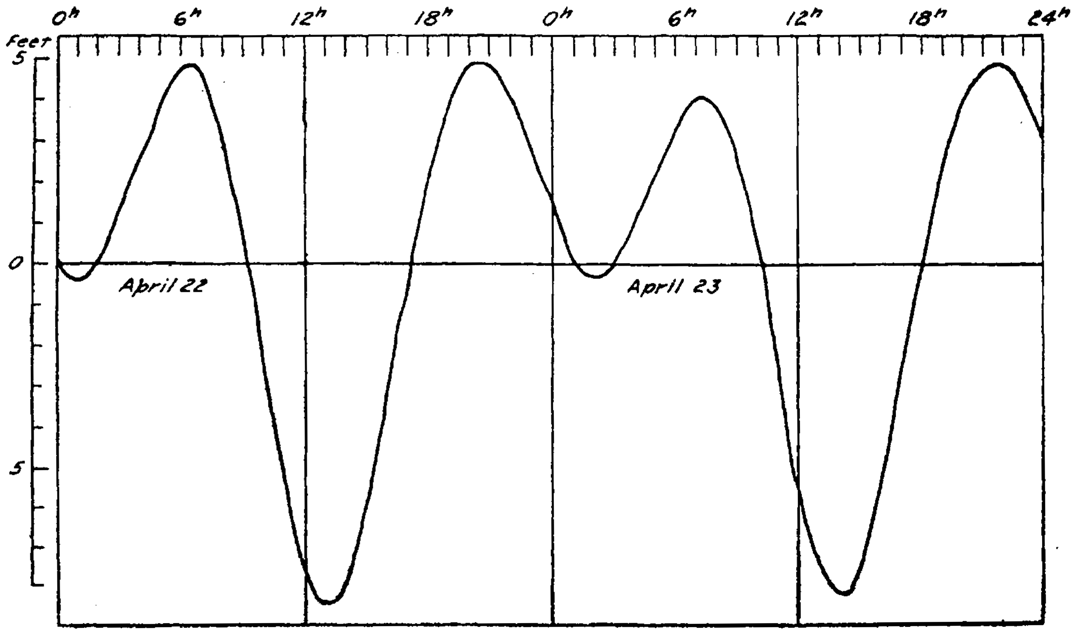
The distinctive feature of the mixed type of tide is the difference between consecutive high or low waters, that is between morning and afternoon tides, this difference being known as diurnal inequality. As an example of the mixed type of tide, the tide at San Diego, California, may be cited, the tide curve for two days, April 22–23, 1920, being shown in Fig. 1.
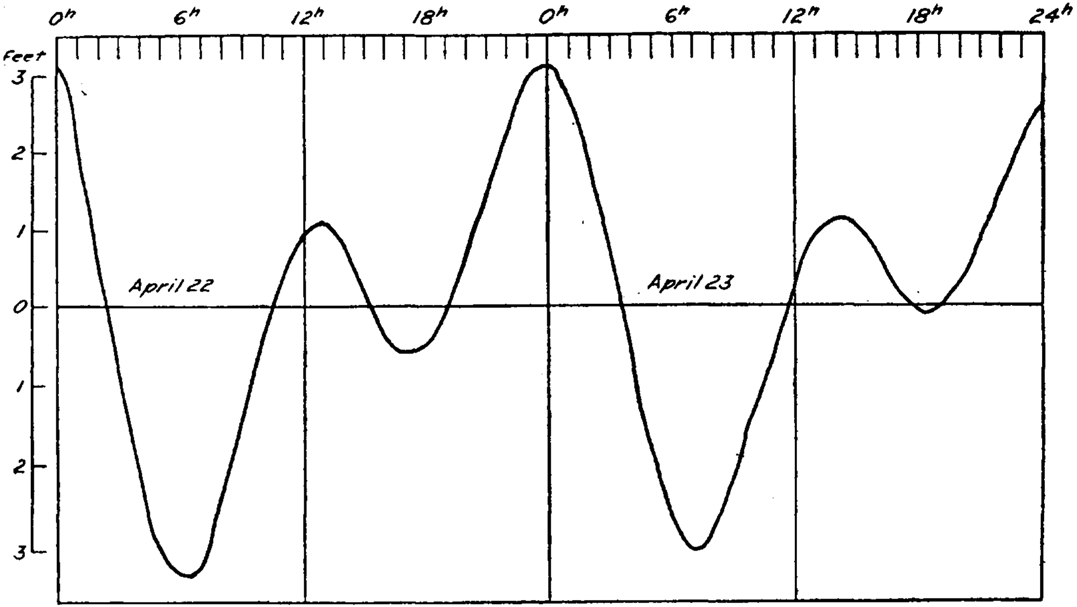
For the two days shown, the average range of the tide at Seattle was about 9 feet. The greatest difference between morning and afternoon high waters during these two days was less than a foot, but morning and afternoon low waters differed by 8 feet. A comparison with Fig. 1, which is the tide curve for San Diego for the same two days, brings out clearly the difference between these two forms of the mixed type of tide.
As an example of the third form of the mixed type of tide, in which the inequality is exhibited principally by the high waters, the tide at ‘Honolulu, Hawaii, may be instanced. And for comparison it will be interesting to take the tide curve for the same days as in Fig. 1 and 2. The tide curve at Honolulu for these two days in April 1920, is shown in Fig. 3.
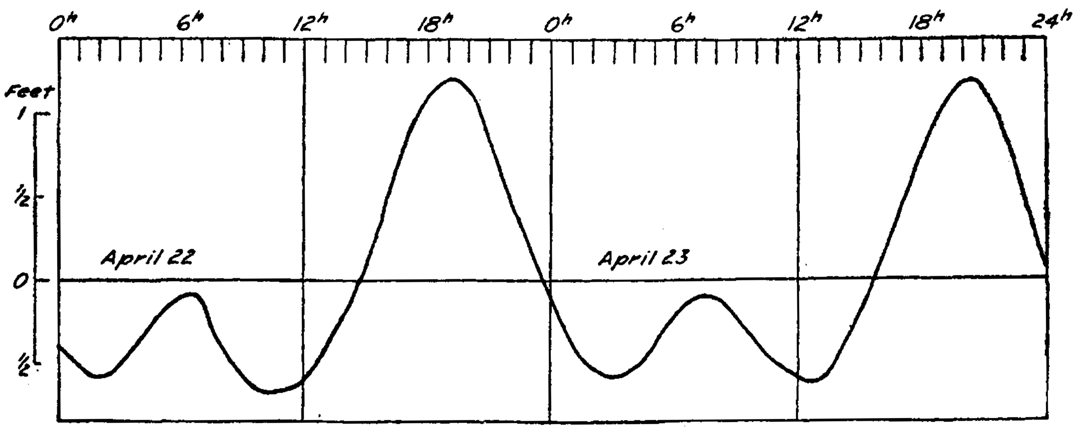
At Honolulu, for the two days shown in Fig. 3, the range of the tide averaged 1.2 feet. Morning and afternoon low waters differed by something like one-tenth of a foot, but morning and afternoon high waters differed by 1.3 feet. It is of interest to note too, that the lower high waters for each of the two days did not rise as high as sea level, which is represented by the horizontal line in the figure.
The diurnal inequality in the tide at any place varies throughout the month in accordance with the declination of the moon, being least when the moon is closest to the equator and greatest when the moon is near its maximum semimonthly north and south declinations. This is true of both the mixed and of the semidaily types of tide. Therefore at the times of the moon’s maximum semimonthly declination the semidaily type of tide exhibits some diurnal inequality; and likewise, when the moon is close to the equator the diurnal inequality in the mixed type of tide is much less than at other times. An example of this is seen in Fig. 4, which represents the rise and fall of the tide at Seattle for the 15th and 16th of April, 1920, a week prior to the time shown in Fig. 2.
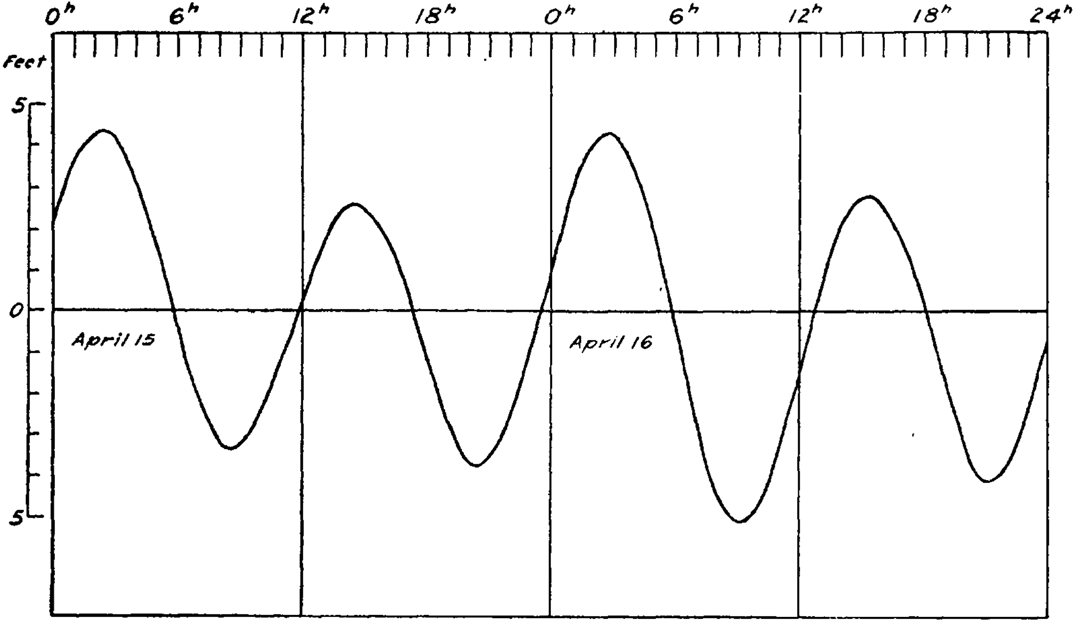
A first glance at Fig. 4 would lead one to conclude that it represented a tide on the border line between the semidaily and mixed types of tide. And it is only when we correlate it with the moon’s declination that its relation to Fig. 2 becomes clear. During the month of April, 1920, the moon was over the equator, in Seattle time, on the 15th, and at its greatest north declination on the 22nd. The variation in diurnal inequality as related to the moon’s declination is brought out by a comparison of Fig. 2 and 4.
In view of the variation in diurnal inequality throughout the month it is obvious that there can be no very sharp line of demarcation between the semidaily type of tide on the one hand and the mixed type on the other.
By means of the harmonic constants, ratios between the daily and semidaily constituents of the tide may be used to define each type of tide, but for purposes of datum planes this is unnecessary. It is sufficient to define the semidaily type as that exhibiting little diurnal inequality and the mixed type as one exhibiting considerable inequality.
It is to be noted too, that in assigning the tide at a given place to a particular type, the reference is to the characteristics of the predominating tide at that place; that is, to the characteristics which the tide at that place generally exhibits. If the tide for the greater part of the time shows considerable diurnal inequality, it is to be classed with the mixed type, if little inequality, with the semidaily type.
Not only is it difficult to draw a sharp line of demarcation between the semidaily and mixed types of tide, but it is also difficult to draw one between the mixed type and the daily type. As the inequality in the tide increases it is evident that the difference between the lower high water and higher low water becomes less and less, and in the extreme case the two finally merge, giving rise to a daily tide. This is exemplified by the curve at Galveston for June 28–29 1920, shown in Fig. 5.
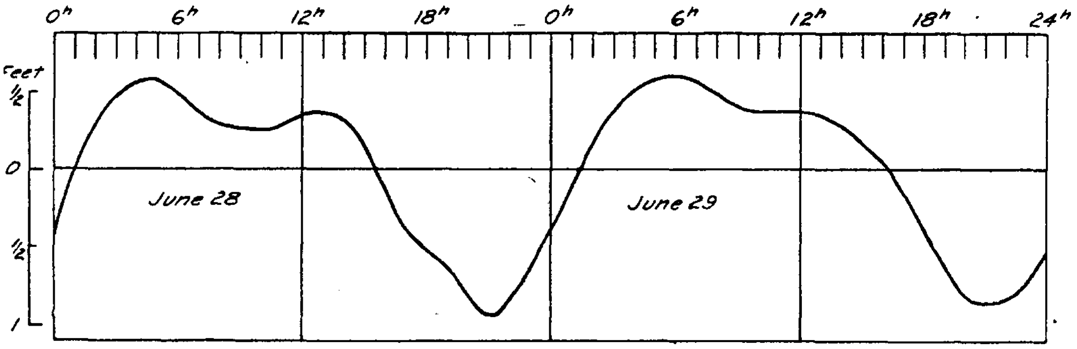
On June 22nd, the moon was on the equator and there was but little diurnal inequality in the tide at Galveston that day. Thereafter, however, with the increasing declination of the moon the inequality increased, the higher low water approaching in height the lower high water so that on the 28th, as shown in Fig. 5, these heights differed by but 0.1 foot and on the following day they merged, giving but one high and one low water in the day. At a number of places the tide becomes of the daily type part of the time, while the rest of the time it exhibits the characteristics of the mixed type of tide.
It is evident that the existence of different types of tide introduces a complicating factor in the choice and determination of suitable datum planes for hydrographic purposes. For the semidaily type of tide, for example, the plane of mean low water furnishes a very satisfactory datum since, insofar as diurnal inequality is concerned, there is but little difference between the low waters. But obviously such a plane is unsuitable at a place like Seattle where consecutive low waters may differ by 8 feet or more.
In addition to the variations in low water arising from the existence of diurnal inequality, there are other variations due to other causes. All these variations, however, may be treated under the same head.
3 Variations in low water
On investigating the fall of successive low waters it is found that the variations to which low water is subject are of two classes. There are, first, the variations due to changes in wind and weather; and since such changes are primarily not periodic in character, the variations in low water brought about by them are likewise nonperiodic. Secondly, there are periodic variations depending on the changes in the phase, parallax and declination of the moon, the periods of which are approximately 29½ days, 27½ days and 27½ days, respectively. These periodic variations may be summarised briefly as follows.
At times of new and full moon the fall of low water is greater than the average, while at times of the moon’s first and third quarters the fall is less than the average. Low water falls lower than usual when the moon is nearest the earth, or in perigee, and less than usual when the moon is farthest from the earth, or in apogee. When the moon is close to the equator, that is, when its declination is small, the two low waters of a day are approximately of the same height; but as the declination increases they differ in height, the difference between the two being a maximum about the time of the moon’s greatest north and south declinations.
The low waters corresponding to the maxima and minima positions of each of the periodic monthly cycles of the moon have been given distinctive names. The low waters coming at the times of new and full moon are called spring low waters, and those coming at the times of the moon’s first and third quarters are called neap low waters. The low waters occurring when the moon is in perigee are known as perigean low waters and those occurring when the moon is in apogee are known as apogean low waters. The low waters that come at the times of the moon’s maximum semi-monthly north and south declinations, when the diurnal inequality is a maximum, are called tropic low waters, and those coming at the time the moon is close to the equator are called equatorial low waters.
It is to be noted, however, that at most places there is a lag between the maximum or minimum positions of the moon and the corresponding maxi mum or minimum low waters. For example, on the Atlantic coast of the United States spring low waters come, not on the day when the moon is full or new, but about one day later. Likewise neap low waters come about a day after the moon’s first and third quarters. The interval by which spring or neap tides follow the corresponding positions of the moon is known as the phase age of the tide; the interval separating perigean or apogean tides from the moon’s corresponding position is known as the parallax age of the tide: the interval between tropic or equatorial tides and the moon’s corresponding position is known as the tropic age of the tide : these various ages differ from place to place and are generally ascribed to the effects of friction.
It is to be further noted that while the three periodic variations in low water discussed above are exhibited by the tide the world over, they are not alike at all places. In many regions the variation from spring low water to neap low water is the principal variation; in certain regions it is the variation from apogee to perigee that is the principal variation and in other regions it is the variation from equatorial to tropic tides that is the predominant variation.
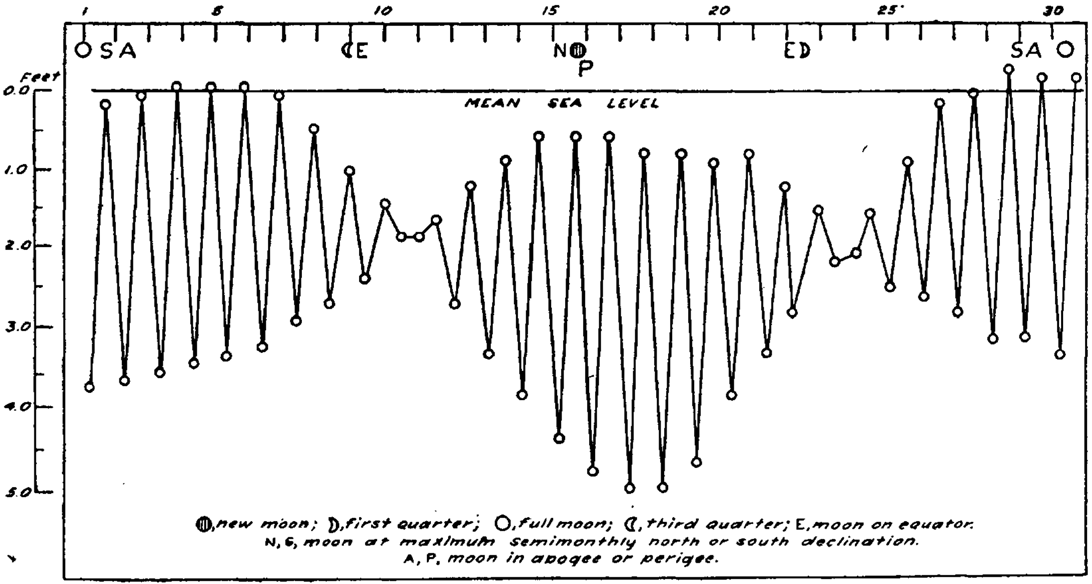
Since the three monthly variations in low water do not have the same periods, it follows that various combinations of the variations may occur. For example, the low water that comes at the time when the moon is in perigee and at the same time is also full or new, will fall very much lower than the low water coming when the moon is in perigee and at the same time is in its first or third quarters. Fig. 6 illustrates the variation in successive low waters at San Francisco, California, for the month of June 1920, as related to the position of the moon.
In Fig. 6 the small circles give the depth of each low water below mean sea level, which is represented by the horizontal line. To indicate clearly the succession, each low water is joined by a straight line to the preceding and succeeding low waters. During the first few days of the month the tide is responding to the moon’s extreme southerly declination which occurred on the first of the month. The moon was then also full, but close to apogee, so that the effects of each of these are very nearly neutralized. On the 9th the moon was over the equator and this is shown in the low water by but little diurnal inequality for the following few days. On the 16th the diagram shows the combined effects of the moon near its maximum northerly declination and in perigee at the same time that it is new. It is of interest to note that at certain times during the month low water did not fall below mean sea level.
It is to be noted that the periodic variation in the fall of low water from day to day is a function of the range. Moreover, in terms of the range the percentage variation is approximately the same over relatively wide areas. For example, all along the open Atlantic coast of the United States from Maine to Florida, which is a distance of considerably more than a thousand miles, the variation in the fall of low water from neaps to springs is from fifteen to twenty per cent of the range of the tide. This means, in other words, that the greater the range of tide, the greater the variation in the fall of low water. Thus at Eastport, Maine, the mean range of the tide is feet and the average variation in the fall of low water below sea level from neaps to springs is from 7.7 feet to 10.3 feet, while at Fernandine, Florida, where the mean range of the tide is 6.0 feet the average variation in low water from neaps to springs is from 2.5 feet to 3.5 feet. At Eastport, therefore, this variation is 2.6 feet while at Fernandine it is only 1.0 foot.
There are other periodic variations in low water depending on the moon’s motion with respect to the earth. Thus the variation in longitude of the moon’s node, which has a period of 18.6 years, introduces a variation in the fall of low water with a period of the same length. All these periodic variations to which low water is subject may be summarized by the statement that in consequence of the variations in the position of the moon relative to earth and sun, low water at any place varies from day to day, from month to month, and from year to year.
Superimposed on the periodic variations in low water discussed above are non-periodic variations due to changes in wind and weather. Heavy winds and marked changes in barometric pressure are accompanied by variations in the fall of low water of considerable magnitude. And at places situated on tidal rivers the variations in the run-off from the territories these rivers drain likewise give rise to variations in the fall of low water.
Such nonperiodic variations in low water are most advantageously regarded as arising from variations in sea level. For it is obvious that the mobility of the water permits wind and weather to raise or lower its normal level by considerable amounts. And since the rise and fall of the tide takes place from sea level, it follows that any cause that brings about a change in sea level must change in much the same way the depth to which low water falls. This is illustrated in Fig. 7 which gives in graphic form the daily heights of sea level and of low water at Atlantic City on the open coast of New Jersey.
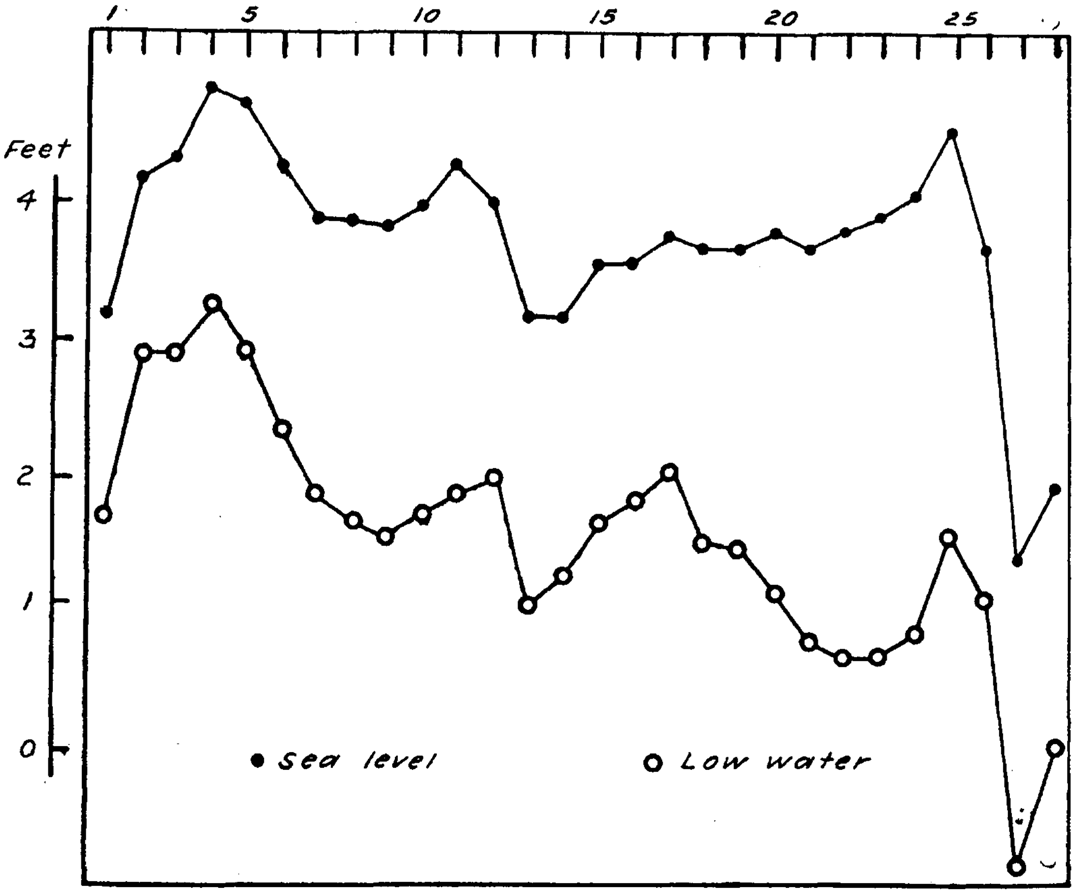
The small solid circles of the figure represent the average height of sea level for each day, while the open circles represent the fall of low water below sea level each day. For the purpose of exhibiting the relationship between low water and sea level it will be sufficient to take the average height of the two low waters of each day, and this was done in Fig.7. The upper diagram of this figure gives the change in the height of sea level from day to day during the month, and the lower diagram gives the average height of the two low waters of each day with reference to sea level.
A glance at Fig. 7 is sufficient to show that, notwithstanding the changes in the height of low water from day to day due to changes in the position of the moon, there is a variation also that corresponds to the daily variation of sea level. To the nearest tenth of a foot the average fall of low water at Atlantic City is 2 feet below sea level. For the month shown in Fig. 7 the fall of daily low water varied from less than 1½ feet on the 2nd to more than 3 feet on the 25th, this variation reflecting primarily the periodic changes due to the changes in the position of the moon. On the 2nd of February, 1925, the moon was one day past her first quarter and only two days before apogee; hence a much-reduced fall of low water. On the 23rd new moon occurred, and at the same time the moon was only two days past perigee; hence a much increased fall of low water.
As between the 4th and 27th of the month, Fig. 7 shows that the low waters differed by exactly four feet. This difference in only in part due to the change in the position of the moon. In greater part it is due to the difference in sea level between those dates. Fig. 7 brings out clearly how closely the low waters from day to day follow the corresponding changes in sea level.
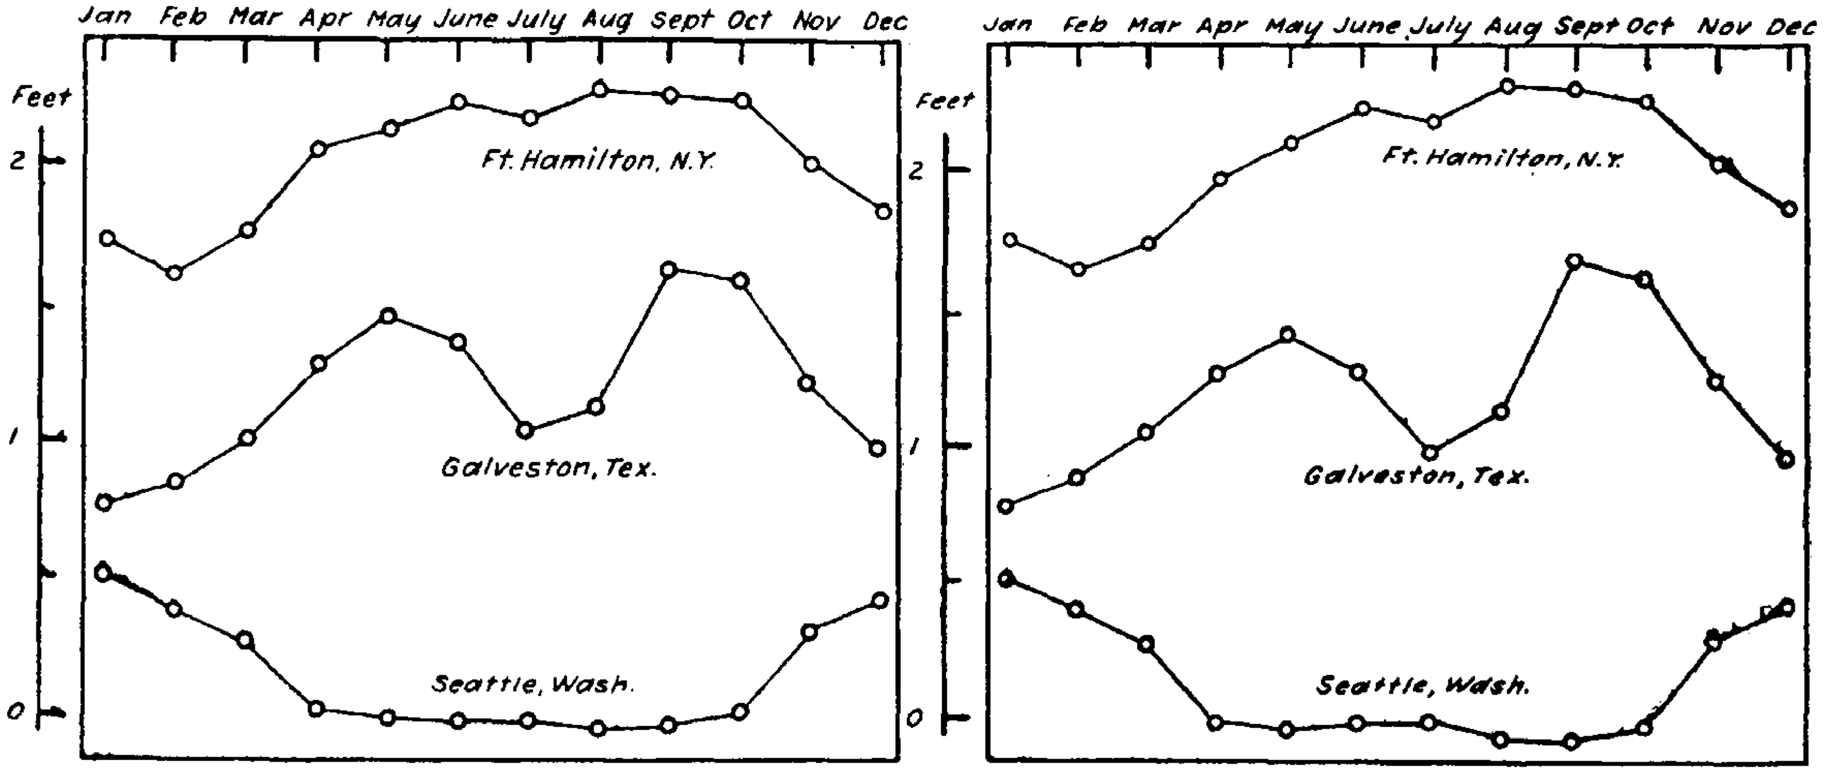
Sea level is subject not only to daily variations but also to seasonal variations and to variations from year to year. And just as low water follows sea level in its daily variation so does it follow sea level in these longer period variations. The seasonal variation is of special interest since this is different for different places. Fig. 8 shows the curves of seasonal variation in sea level at three stations, one each on the Atlantic, Gulf and Pacific coasts of the United States. In Fig. 9 the seasonal variation in low water is represented for the same stations. A glance is sufficient to show that at each place the variation in low water follows closely the corresponding variation in sea level. In both figures each curve is based on a number of years of observation.
The net effect of the periodic and nonperiodic variations is to make the fall of low water at any place a variable quantity. At Seattle, for example, the depth to which low water fell during the year 1920 varied from 10.5 feet below mean sea level to 2.0 feet above mean sea level. And for the twentyfive year period from 1900 to 1925 the fall of low water varied from 11.1 feet below mean sea level to 3.7 above, giving a difference between the two low waters of nearly 15 feet.
4 Choice of datum
Even after eliminating all but low water datum planes for hydrographic purposes, it is evident that the choice oi the most suitable datum is not a simple matter in view of the different types of tides and of the variations to which low water is subject. At first thought it might appear as if the lowest low water would constitute the most suitable datum for the hydrographic chart of a region. For, it may be argued, by the use of this datum the chart will show the least depths possible during unfavourable meteorological conditions. Furthermore, the corrections necessary for the rise and fall of the tide to give the actual depth of the water at any given time will always be additive, which obviously is an advantage.
Several serious objections, however, may be urged against the use of the datum of lowest low water. In the first place, what precisely is lowest low water and how can it be determined practically? For it is to be kept in mind that in the hydrographic survey of any locality a tide gauge is kept in operation for but a relatively short period of time, generally not exceeding several months. And the lowest low water during this period of observations – which almost without exception corresponds with the period of least variable weather conditions – may be several feet higher than the lowest low water during an exceptionally severe storm. Indeed, the very term “lowest low water” is so vague and indefinite as to preclude its use as a hydrographic datum plane if any pretence to precision is to be made.
But even if it were possible from a short period of observations to determine with precision the lowest low water that may occur in a given locality, are there not serious disadvantages in the use of a datum which makes the depths shown on the chart such as occur only at very rare intervals during periods of exceptional storms? At the present time, with the draft of vessels approximating the normal low water depths in the channels of many of the most important harbours, the datum of lowest low water would make the depths shown on charts so shallow as to give a totally erroneous idea of the navigability of such channels.
Still another objection to the adoption of an extremely low low-water datum has been raised by Rear-Admiral Phaff1. He directs attention to the fact that with the use of such a datum a positive danger may arise. For banks or rocks, which at normal low water are very nearly uncovered, will be shown as visible on charts making use of an extremely low low-water datum. Being shown as visible on the chart the navigator would attempt to use them as aids in navigation with the resulting danger of seriousmistakes.
The most suitable datum plane for the hydrographic chart of a given region is the one that will most satisfactorily fulfil the following conditions: (1) show the least depths that normally prevail; (2) admit of easy and accurate determination; (3) represent some natural and easily-understood phase of the tide; (4) make necessary the use of only small negative corrections for the rise and fall of the tide, and only relatively few of these in number. The importance of the first condition follows from the preceding discussion on the use of lowest low water as a datum, and the importance of the second is self-evident. The third condition, however, requires further consideration in view of the advocacy, from time to time, of datum planes based on harmonic constants.
Such terms as low water, spring low water, and lower low water are easily understood and refer to phases of the tide with which the mariner is thoroughly familiar. Datums depending on these phases of the tide are not only readily understood but refer to easily observed phases of the tide. And it is to be noted that such datum planes admit of endless choice. That is, if for example a datum is desired which is found to be n feet lower than mean low water, we may specify it by stating that it is datum n feet below mean low water without in any way losing the advantages inherent in this natural datum.
At times, however, datum planes based on harmonic constants are advocated. It cannot be too strongly emphasized that for the purposes of the tidal mathematician the harmonic analysis provides the most satisfactory and most powerful method for the analysis and prediction of tides. But the harmonic analysis is a highly specialized mathematical process and necessitates a considerable amount of time-consuming numerical computations. The mariner and the hydrographic surveyor may well question whether the time and effort required for mastering the technique of harmonic analysis and acquiring adequate understanding of its results are not out of all proportion to its possible benefit for their purposes.
From a given series of tide observations the precision with which a datum plane can be determined is the same whether derived from an harmonic analysis or from a low water tabulation. But it is a much simpler matter to tabulate a tidal series with regard to some low water phase than to put it through the harmonic analysis. A natural datum plane, such as defined by or related to some observed phase of the tide, is therefore to be preferred to one derived through harmonic constants.
The fourth condition to be fulfilled by a suitable datum plane, namely, that it make necessary the use of only small negative corrections for the rise and fall of the tide, and only relatively few of these in number, requires but little discussion, for it is almost self-evident. In general, negative heights in tide tables are somewhat troublesome; but if they are small they may, as a rule, be totally disregarded by the mariner. For he realises that since it is impossible to make advance predictions of the weather in connection with the prediction of the tides as given in the tide tables, the predicted heights are to be regarded as approximations to the heights which will actually occur, because of the disturbing effects of wind and weather.
On examination, the datum used on the hydrographic charts of the various countries are found to vary. As a rule, however, these datums may be grouped under the following heads: spring low water, mean low water, lower low water, monthly lowest low water. In every case it may be assumed that mean or average values are intended and frequently this is indicated by the prefix, “mean”.
A great deal of confusion has, however, resulted from the fact that datums were derived from short series of observations, without any attempt at correction to mean values. And as a rule it was impossible to make an accurate correlation between the datums of charts of contiguous areas because the relation to mean sea level of the datums used was not stated. It is altogether unlikely that radical changes will be made in the near future in the datum planes now being used. If these are referred to some well-known phase of the tide, are accurately determined and the relation to mean sea level given, the requirements for a good datum will be fulfilled.
It is to be observed that from a given series of tidal observations the best determined mean values will be for those phases of the tide for which the greatest number of observations are at hand. This means that as regards accuracy of determination from a given series of tide observations, the various datums that may be used for hydrographic purposes would list as follows: (a) mean sea level, (b) mean low water, (c) lower low water, (d) spring low water, (e) monthly lowest low water.
For the semidaily type of tide mean low water constitutes a very desirable datum for hydrographic purposes, especially in regions of moderate range of tide. It gives approximately the least depths that normally prevail and it can be accurately determined from relatively short series of observations. Where the mean range of tide is less than I0 feet the difference between mean low water and spring low water or even perigean spring low water is only a few feet so that large negative corrections for the tides are infrequent.
Where the tide is of the semidaily type but has a considerable range, it is frequently of advantage to use a datum lower than mean low water to obviate the necessity of large negative corrections for stage of tide. In this case spring low water, or as it is frequently called, mean low water springs, furnishes a satisfactory datum. If desired, however, a datum a given number of feet, say 2, 3, 4 or more feet below mean low water, may be used. This latter procedure has all the advantages inherent in the use of the da- tum of mean low water.
For the mixed type of tide, the plane of lower low water is very satisfactory. It fulfils the condition that by its use the chart shows the least depths that normally prevail, since it is the average of the lower low waters. It is a well-known phase of the tide and may be derived with considerable accuracy from several months of observations. And since it is lower than the datum of mean low water, large negative corrections for stage of tide, which would arise because of the diurnal inequality in this type of tide, are obviated.
It is to be observed that in the use of the datum of lower low water, the existence of considerable diurnal inequality in the low waters is implied. And as a general rule this is true of the mixed type of tide. However, in any locality in which the mixed type of tide exhibits the diurnal inequality almost wholly in the high waters, the datum plane of mean low water would differ so little from that of lower low water that the former datum might be used if desired.
The datum of lower low is applicable even where the tide becomes diurnal at times. For where there is but a single low water in a day due to the tide becoming diurnal, it is obvious that it arises from the merging of the higher low water with the lower high water and hence the single low water is a lower low water.
Where the tide becomes wholly diurnal, the average of all the low waters may properly be called mean low water and therefore this datum may be used in such regions. If in any particular locality large negative corrections arise from the use of this datum, a lower datum may be used, this being defined by its distance below mean low water.
To the hydrographic surveyor there is a great ad- vantage in the use of some natural datum which is referred to an observed phase of the tide, and which may be readily derived from a relatively short series of observations. For he is then in a position to derive the datum during the field season and to draw up a preliminary sounding sheet. If a longer series of observations determines the datum more accurately, it will differ from the preliminary determination only by a small amount. And since this difference is a constant, a note on the sounding sheet that all soundings shown are to be increased or decreased by this difference refers the depths to the well-determined datum.
Quite apart from their importance in connection with charts, accurately determined hydrographic datum planes are of importance in bringing to light changes taking place in the depth of a waterway. Such changes may arise from silting or erosion in the channels or from changes in the rise and fall of the tide. Accurate determinations of hydrographic datum planes at different times separated by years furnish the necessary data for determining not only whether changes in depth have taken place, but also to which of the causes the changes in depth are due.
The accurate determination of datum planes is a problem that falls within the province of the subject of tides. For the methods used and principles involved in the determination of datum planes, reference must be made to tidal manuals dealing with this phase of the subject2.