
Preamble
This manuscript is a reprint of the original paper previously published in 1973 in The International Hydrographic Review (IHR, https://ihr.iho.int/): Oudet, L. (1973). The value of a nautical chart. The International Hydrographic Review, 50(1), 149–161. https://journals.lib.unb.ca/index.php/ihr/article/view/23844
Editor’s note
The first half of the present article is reprinted from The Journal of Navigation (Volume 25, No. 3, July 1972) with the kind permission of the Royal Institute of Navigation, London.
1 A stranding in the West Indies
In January 1971 the liner Antilles sailing among the islands of the same name ran aground in the neighbourhood of the Grenadines, between the islands of Mustique and the Pillories. Nobody was injured but the ship was lost. An inquiry by a maritime court in the following October acquitted the Captain and this came as a great relief to the seafaring fraternity because it was difficult to see how a sailor at the top of his profession could knowingly have navigated with such imprudence. The fatal rock was not shown on the chart and everyone knows that charts are not perfect: the Master had been the victim of the inevitable.
Meanwhile some people, both seamen and laymen, had noted that the passage in which the stranding occurred was not one that would normally have been used by such a ship as the Antilles. They felt that her Master had taken an unjustifiable risk in order to show his passengers an enchanting landscape; so first this criticism must be examined.
Cruising is an increasingly important sector of maritime trade and all liners now do cruises; even the big transatlantic ones only operate passenger services at the peak period in summer and for the rest of the year carry the idle rich on the look out for ways to spend money and kill time. Such an employment is certainly not essential and does little credit to a society that finds such an outlet for its capital, but one cannot blame a master for taking command of a cruising ship; it is not he who is responsible for the system. In the long run it has the merit of finding work for crews who would otherwise he laid off. The trade unions, with no love for capitalism, have helped by their demands lo perpetuate and even to foster the profitable undertaking of cruising. It may he added that even the USSR fits out cruise liners.
Cruising is thus a widespread enterprise; since it is profitable it is accepted, and every company tries to attract custom. On French ships the ambition is to surpass other nations in the pleasures of the table. But naturally in a floating hotel like a liner the attractions are not confined to good eating and the ports of call; a captain aware of his responsibilities usually tries to make the voyage itself as interesting as possible. The company did not leave this point entirely to the initiative of the Master of the Antilles, but actually encouraged him by allowing extra time en route.
Had he used the extra time in detours out of sight of land he would certainly have been acting contrary to his employers’ intentions.
One cannot however press this point too far for the Captain is ‘master under God’ and the company cannot dictate his course; he was free to choose a course that would make the voyage as interesting as possible and that was his job. One might say that that was what he was there for, and one might add that he would never have dreamed of taking a cargo where he lost his liner.
Thus it was in carrying out his assignment that the Captain decided on a bold piece of seamanship. But boldness is not rashness and whatever the assignment may be it does not justify risks that might prejudice its execution. We must see whether the Captain of the Antilles did in fact navigate rashly. From his own statements, he was fully aware that the passage he was taking was an unusual one and did everything he could to make sure that it was not dangerous. He took continuous soundings whenever close inshore or in the vicinity of danger. He had on previous occasions sailed in the neighbourhood of the channel in which the accident occurred and his soundings had not shown any discrepancy with the indications of the chart. In attempting the channel that was to lead to disaster he thought that he was only making a reasonable extrapolation. It was a reasonable extrapolation but it was based on false premises. What took place to the north of Mustique could equally well have happened on the other experimental passages she had already made; the Antilles had in fact been sailing dangerously for a long while and in the long run the unappreciated risk could not fail to become an actuality.
We must now clinch the matter and see how an experienced master, one of the best in his compaprecise methods of survey had been in use since the end of the eighteenth century, thanks to the perfecting of the sextant and instruments associated with it like the station pointer; so that in a narrow channel like that off Mustique it was easy to make a close and accurate survey. An examination of the chart shows that it was based on surveys the scientific character of which remains valid today. In fact it shows the regular lines of soundings that are recognized in the nautical literature as evidence of careful hydrographic work. This does not of course exclude the possibility that a dangerous rock has escaped detection in these regular soundings, but that is another matter and we shall consider it presently.
It was also suggested that the Antilles might have struck a coral reef. If so, such a reef could well have grown by 1971 to become a danger to navigation which did not exist a hundred years earlier and, if he was in an area of coral, the Captain was wrong to ignore this possibility; everybody knows that while the sea wears away even the hardest of rocks it does not stop corals from growing. But the chart indicates no coral anywhere in the vicinity and the investigations carried out after the accident show that the Antilles struck an uncharted rock, which must have already been there a hundred years ago, and which had escaped the survey of that date.
Such defects are inherent in the methods employed before the middle of the present century and can only now be eliminated by the most modern methods of underwater search. If one is to be certain of detecting all the irregularities on a bottom whose general features have been established by lines of soundings, an ultrasonic transmitter is towed just clear of the bottom so that its beam sweeps over the surface to be examined; any object that it encounters gives an echo in the receiver. It then only remains to proceed to the point above the obstacle and determine its depth and extent by sounding or by sending down a diver.
There was no such method a hundred years ago and even if one were revising the chart of the Grenadines today it would possibly not be employed, and that brings us to the root of the problem which is the scale of the chart. To construct a chart at any given scale the survey is carried out at a similar scale, and the use to which the chart can subsequently be put depends on this. It is a point which Sailing Directions still barely touch on, so that the Captain of the Antilles was insufficiently informed as to the use he could make of his chart.
The French chart of the Grenadines, like the British chart from which it is derived, is on a scale of about 1/75 000 which means that the surveys on which it is based were on a scale not less than this. Parts of the survey may been on some larger scale, 1/50 000 perhaps or 1/25 000 and therefore in greater detail, but this is immaterial because the navigator cannot know it. A survey at 1/75 000 means that on the plotting sheets from which the chart is compiled the lines of soundings are represented by lines drawn not more than one centimetre apart, the equivalent at that scale of 750 m. Soundings at that interval are therefore appropriate for a survey of that scale and for the chart compiled from them. Thus to read on a chart that its scale is 1/75 000 means that the lines of soundings on which it is based could be 750 m apart.
Naturally the soundings are much closer together along the tracks followed by the surveying vessel or her boats. In 1860 the only apparatus for sounding was the lead and line and at depths between 10 and 20 m, as in the case with which we are concerned, the distance between successive soundings would be the distance made good by a boat under oars in the time needed to heave and recover the lead, some tens of metres. Nowadays surveying ships and their boats are equipped with echo sounders of a type similar to those found on every ship’s bridge which provide a sounding, say every three seconds. At 5 knots this gives a sounding interval of 7.5 m, but at a scale of 1/75 000 this still does not mean that the lines of soundings are less than 750 m apart. Such a pattern cannot claim to cover the bottom with a fine tooth-comb the teeth may be 750 m apart. Even in a large-scale survey of 1/10 000 the guaranteed interval is as much as 100 m and dangerous obstructions can occur between two lines at that separation. Detection by sonic beam, of which we have already spoken, is the infallible method for discovering such obstructions, and since the effective range of the beam is upwards of 1000 m, surveys at 1/100 000 carried out since the method came into use can provide a degree of certainty hitherto unattainable. One may say in fact that any chart based on surveys before 1970 carries with it a risk that the surveyors may have missed some dangerous wreck or other obstacle to navigation.
The risk certainly varies in different areas. Thus the largest scale of charts covering the English Channel is about the same as the scale of the chart of the Grenadines, but one would not therefore say that it is dangerous to approach within 750 m of every marked danger on the Channel charts, nor that the navigator is anywhere in danger of striking an uncharted wreck or obstruction. It must however be recognized that this security is due as much to the presence of buoys, the volume of traffic, and soundings taken by ships that frequent this seaway, as to systematic hydrographic surveys. Even so the same degree of safety does not apply everywhere, among the shifting sands of the Goodwins for example it is the buoyage that contributes most to safety. Besides, in areas where navigation is infrequent the possibility cannot be excluded that there are submerged rocks not marked on the charts in the neighbourhood of those that are marked. In this respect the ‘crab catchers‘ who like to skirt dangers would be well advised to temper their appetites by the larger scale charts of the French and English coasts. In any case navigators know that the largest scale chart available for any area should always be used.
For the Grenadines there is no chart on a larger scale than 1/75 000 and it seems clear that the Captain of the Antilles would not have attempted the Mustique channel had he realized the qualifications as to the reliability of his chart that we have stated above. This channel, some 400 m wide, was not adequately covered by a survey in which the gaps between lines of soundings might be as much as 750 m.
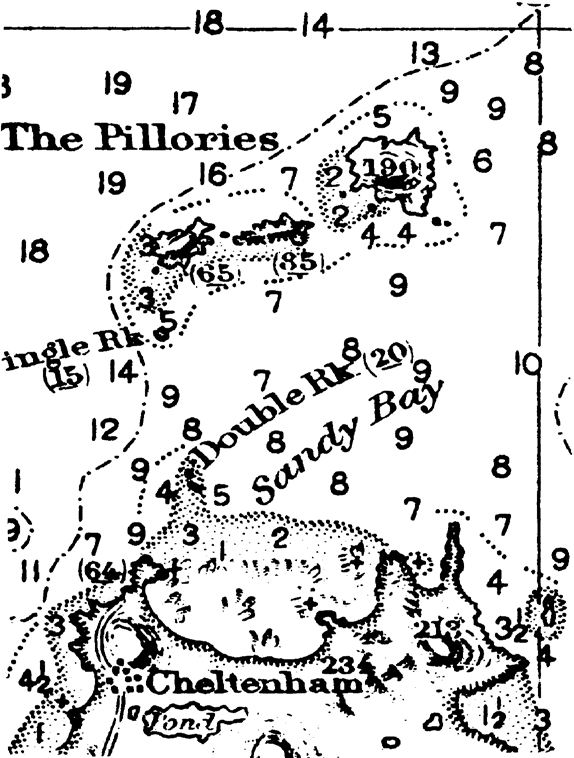
It is true that the representation of the area on the British and French charts gives an impression of accuracy in this respect which might mislead a mariner unfamiliar with hydrographic procedures. To illustrate this other important aspect of the problem parts of the British chart (No. 2872; Fig. 1), the French chart (No. 3206; Fig. 2) and the American chart (No. 1640; Fig. 3) are here reproduced at four times the scale of publication. Of course this enlargement of charts is not to be recommended to the navigator since it does not alter the scale of the original survey; it is only to make the topographical details clearer and to show the part that a draughtsman plays in interpreting survey data.
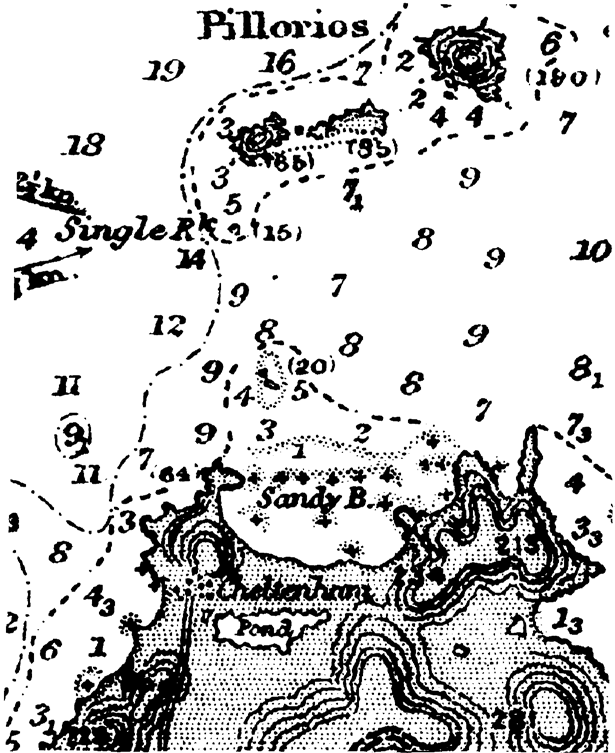
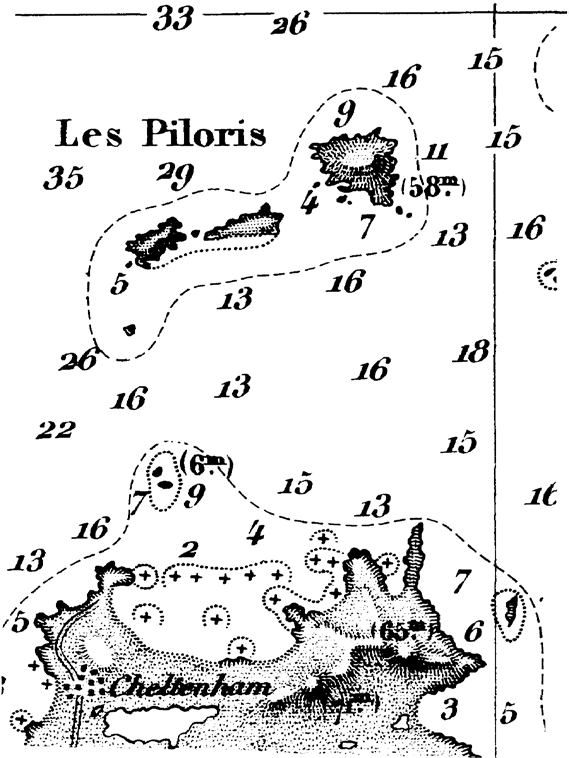
On the original British chart (depths in fathoms) one finds a continuous 5-fathom contour on both sides of the channel except to the north-east of Cheltenham, westwards of a narrow point of land. On the French chart (depths in metres) the 10-m contour replaces the 5-fathom contour and shows no discontinuity at this point. This chart also stands up to enlargement better than the British chart; the topography, bottom contours and lettering are so clear that it is hard to believe that it is an enlargement, only the size of the figures showing depths reveal to anyone familiar with charts that it is so.
But we must turn to the American chart to find a style of interpretation different from the original. While there is an extreme simplification of such details as the topography everything that concerns dangers to navigation, awash or submerged, is more conspicuously shown than on the other two charts. It seems that to some extent the Americans have incorporated information of their own; the entire area of dangers awash or barely submerged is shown by a stipple, which is particularly close along the perimeter and emphasizes its dangerous aspect. Besides, the 5-fathom contour is shown by a discontinuous pecked line which gives the impression that the dangers may extend as far as that. Above all, this contour is completely absent to the north of Mustique where the inscriptions ‘Double Rk. (20)’ and ‘Sandy Bay’ take its place. The general impression is that to the north of the island the limits of the danger are ill defined and that it may well extend as far as the middle of what is shown as a channel on the other charts.
All this shows how difficult it is for a navigator to make an appraisal of the chart, yet it is something he has to do whenever he is in unfamiliar waters. This is too large a subject to deal with in a short paper and would require the collaboration of hydrographers and navigation instructors. Short of that it is worth repeating the advice given by a hydrographer many years ago. This ‘rule of thumb ‘ is that whatever chart he may be using a mariner should not approach nearer to charted dangers than the width of his own thumb. Taking this as 2.5 cm, the equivalent of the English inch, it will he seen that it represents two and a half times the maximum interval between lines of soundings, or 1875 m for a chart at the scale of 1/75 000. The rule of thumb is in fact an application of the seafaring proverb ‘too strong never breaks’.
It may not always be possible to allow so wide a margin, but it is wise to keep this order of magnitude always in mind and, in particular, lo apply it when sailing in unfrequented waters. The Captain of the Antilles ignored the rule and this led him to overestimate, as doubtless many sailors do, the degree of confidence which should be placed even in a good modern chart where there is always the possibility that submerged dangers may have escaped the surveyor’s notice. As we have shown, this risk is only averted by the most modern methods of survey and it will be many decades before they will have been applied to all existing charts. Channels like that in which the Antilles was lost will certainly not have a high priority. That is why there should be no delay in making mariners aware of the lesson which cost the life of one unfortunate ship. The ‘rule of thumb’ will long retain its value in counselling prudence to those who are tempted to sail in waters where some uncharted rock may have escaped even a relatively recent survey.
2 The concept of cartographic interpretation
I have showed that identical original data when cartographically interpreted can nevertheless result in varied cartographic representations. All cartographers, as indeed all men, have individual personalities and consequently an individual character tends to be stamped on the picture of the reality as seen by each cartographer. Thus we see that the French cartographer, using the British chart as original, has delineated a more attractive picture of the facts, whereas the American has depicted a more menacing aspect.
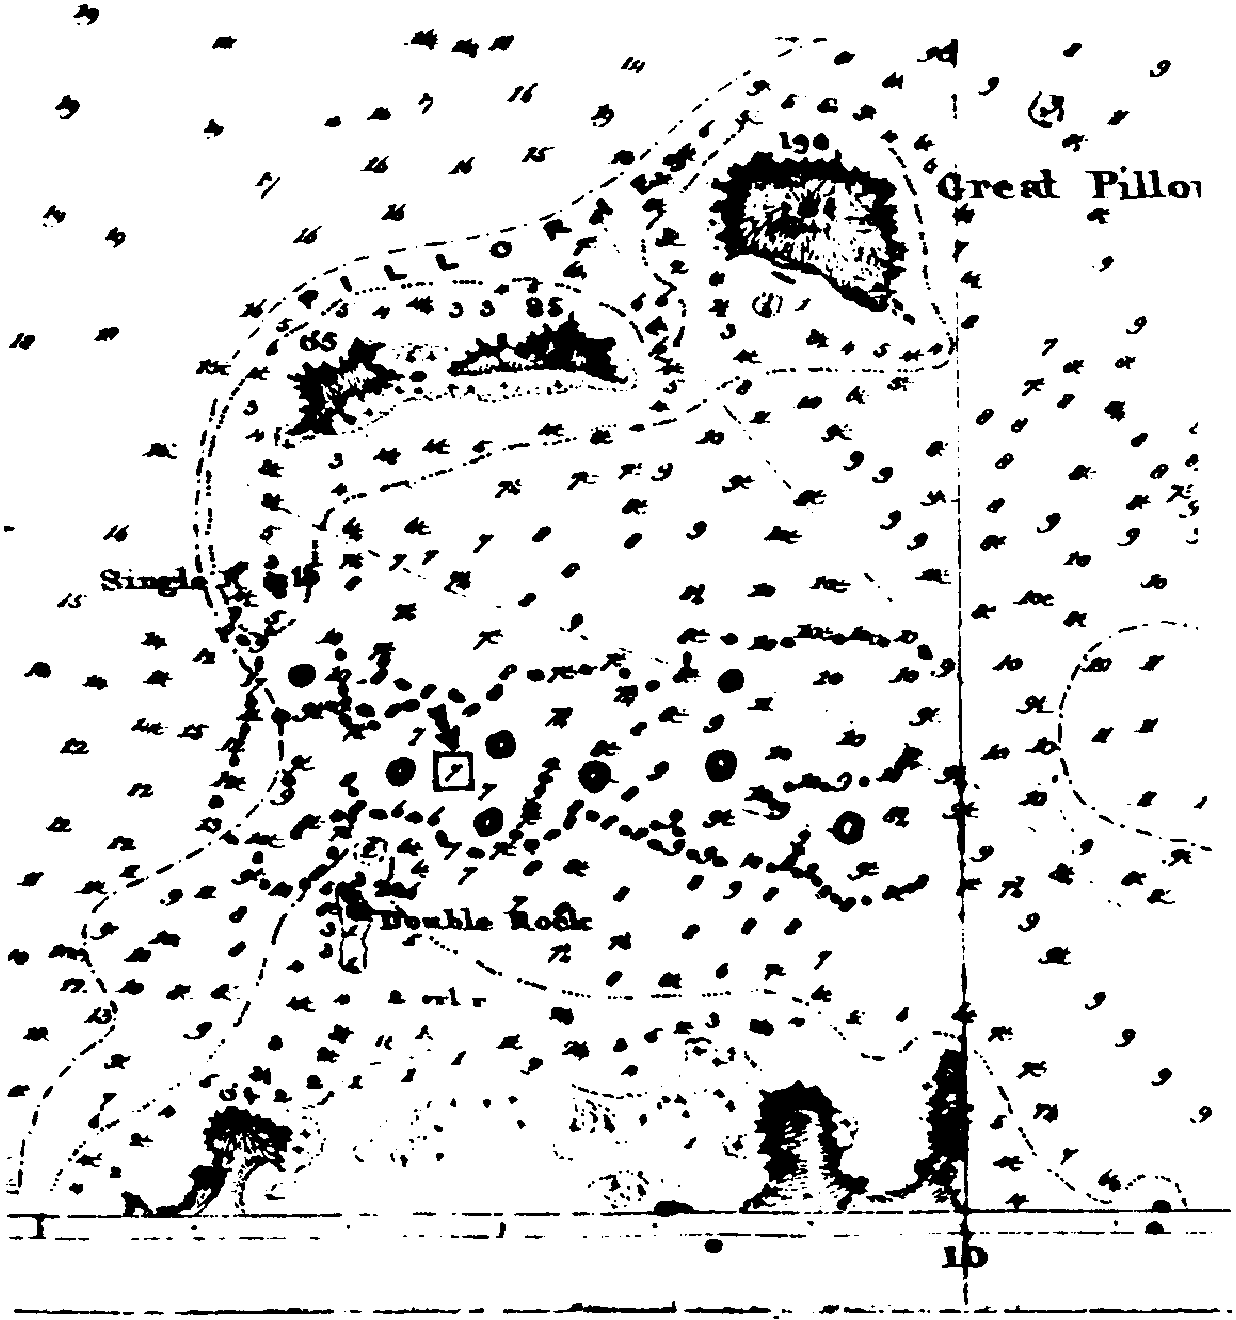
What then is the relation of these pictures to the surveys on which they are based. A full scale photograph of an original survey (No. D 5931, Sheet 5) carried out in 1861–1862 by a British survey party demonstrates this relationship (Fig. 4). Here, as will shortly be shown, enlargement would lead to a faulty analysis of the document.
The authors of the 1861–62 survey are today succeeded by others whom l would like to thank for permitting me to publish this document. They are thereby doing me the honour of making me their advocate at the bar of public opinion, an opinion which, roused to indignation by the loss of a splendid and well commanded ship, suspected inadequacy of the chart in question. Although the document was in effect inadequate for the use to which it was put, this does not in any way prevent it giving a far fuller degree of security to the navigator than at first appears. If in point of fact the arguments were always as good, advocates would have no difficulty in securing acquittal for their clients.
Close to the exact position of the stranding the maximum spacing between soundings is a third of that acceptable for the scale, i.e. 250 m instead of 750 m. This has been brought out by superimposing a dotted line through adjacent soundings which serves to render their small interval more apparent. We may be certain that soundings were in fact made at closer intervals all along these dotted lines for, as mentioned above, this was an easy matter at that period.
As it was naturally not possible to plot all these soundings on the sheet the cartographer had to limit himself to the minimum interval necessary for separation of two adjacent soundings where obviously the figures have to be as small as possible consistent with legibility. When selecting his soundings for the final chart he has naturally systematically chosen the shoalest.
A second addition has been made to this same document. In the area around the scene of the stranding circles have been added to highlight “blanks” in the survey, areas where no soundings exist. We can see that here these blank areas have a maximum diameter of 500 m, whereas further from shore their diameter reaches, although never rises to more than, the 750 m acceptable for the scale. The rock on which the Antilles stranded is within the area of these blanks (see Fig. 4).
The foregoing analytical appraisal shows that in this survey both its execution and its portrayal – and the two are not interdependent – meet very adequately the survey’s requirements within the limits of its scale. A hydrographer’s professional conscience can take him no further than the limits which figure size imposes, for the whole must remain legible, however small and densely packed these figures may be.
The rule of thumb is self-evident on a plotting sheet. We can be sure that the width of a thumb mark will cover any blank, even the largest permitted by the chart scale.
However, it must never be thought that the broad application of this rule will provide the easy solution to all problems of interpretation. Following the example of biblical scholars who have provided us with scriptural exegeses, I venture to suggest that the cartographer in his turn would do well to provide a critical estimate of each chart’s worth – a cartographic exegesis in fact, a word conjuring up patient and careful work carried out by experts – and that this information should he included in Sailing Directions.
It was to show the extent of the problem of interpretation on one particular chart that I wrote my article “A stranding in the West Indies”, reproduced here. An extensive analytical appraisal of the chart in question led me to include a short paragraph reducing everything lo be learned from the appraisal to a single simple rule.
We may note in passing that the appraisal of a similar scale chart in the English Channel has led to results which are at first sight considerably different, but in reality to the discovery that the two have certain common points. One is that each chart must he used for its own specific kind of navigation, and another that its degree of dependability is not even uniform all over the chart. Thus, the cartographic reliability of a depthreferenced rock is certain, provided of course that a check has been made for other peaks at lesser depths, using divers if necessary. On the other hand a sandbank or a coral reef may vary. Some sandbanks pile up, others disappear, others again have seasonal mean levels, and yet others have surfaces with wave-like undulations. In the north of France we call these sand-waves “ridens” (ripples). As a result of the perpetual movement of swell and currents the size and location of these sand-waves changes continually. This aspect of hydrography is still poorly understood. We knew that these sand-waves existed in waterways, but in the Channel they remained undiscovered until the day the keels of supertankers came near to grazing their crests. When measuring an actual clearance in order to fix a maximum acceptable draught the depth values began to fluctuate and never remained twice the same.
The ultimate reason for this cartographic appraisal is perhaps when the hydrographer discovers that there is a capital deficiency in the chart he is selling to the public. In 1970 Captain J. D. Winstanley, R. N. made a remarkable analysis of both the extent of the sandwave problem and the means of solving it (Journal of Navigation, Vol. 23, No. 4). The question was so new that there existed no specialized survey equipment suitable for the work. Up until then there had never been any need for such high measuring and positioning accuracies when sounding so far from the coast. It became a necessity to position these sand-waves month after month and to plot their various profiles – and all this in an area fifty miles or so out sea! Let it be remembered to that this was vital for the navigational needs of the ships bringing in to Europe her vital lifeblood, as well as for the chart that is so vital to these ships from whatever quarter they come. It is thus a far cry to the chart of the Caribbean.
What does all this signify. Astoundingly, but quite simply, that our charts are both incomplete and insufficiently documented, and that we are ignorant of the fact. In order to comprehend its significance we should perhaps go back several centuries to those handsome old parchments embellished with marine monsters that are the glory of our museums. Doubtless modern hydrographers, well up in such things as electronics and artificial satellites, will say “Those were works of art. Our charts in 1972 are the fruits of science”.
But this is not the case, and at heart hydrographers well know it. They are perfectly aware that they only possess absurdly inadequate means to satisfy the mariner’s needs, needs that are moreover invariably underestimated by those who control their budget. They are well aware that they do not yet have the cameras to take to sea to chart the bottom. A great deal more science enters into the charts of 1972 than on those medieval charts – but there is still not enough, since science has not pronounced the last word and will in fact never do so. How then should those blanks in the survey be interpreted on our charts, blanks which will have to be filled in by succeeding generations. We should use the art of today of course, but a subtle art containing something of both Raphael and Picasso.
From this aspect, we could classify the three national charts of the region where the liner Antilles was lost as follows.
- The original British chart. Here we can discern the pleasing quality of those expressive primitive painters of the Middle Ages who with great simplicity of means were able to express virile force, feminine grace and the whole gamut of feelings to he read on a human face.
- The French chart. This can be likened to Raphael, and to the Renaissance in all its beauty. Here Nature is not quite handsome enough, and so the artist embellishes her.
- The American chart. And here we come to Picasso. On a single canvas the painter gives us an object’s front, back, and even interior! The result may sometimes he hideous, but he cares little. ls there not a saying-exaggerate to make yourself better understood!
It is nevertheless the Americans who were right to show the fads in their worst light. It is probable that if he had been using an American chart the Antilles’ Captain would have abandoned the idea of entering this particular channel, for a skilful presentation of visible dangers already foreshadowed the existence of invisible ones.
All this is merely an attempt to enter into the subtleties of cartographic interpretation, and such considerations would no doubt be most useful when working out the fundamentals of a philosophy for cartography. However, when a ship’s captain takes up a chart he has no time to philosophize. He has need of concrete facts and, as we have now seen, the figures and symbols taken in their aggregate may well prove misleading to him. The error committed by the Captain of the Antilles is enough to prove this, but we have now produced further evidence to show that cartographers themselves are not always of like mind in the interpretation of a survey. in these circumstances, what chance has the mariner of interpreting the chart before him without risk of mistake?
The remedy is now clear. During my twenty-three years with the French Hydrographic Office I used vaguely to seek this remedy, feeling subconsciously that it must exist. I had noted that in the British Admiralty Pilots published during the first half of the present century density of soundings was considered as one of the criteria for determining the value of a chart, but that this notion has disappeared in more recent editions. I also noted that French hydrographers were tending to reduce the number of soundings and to increase contour lines. The result seemed to me to lead to a more intelligible picture of the submarine topography, but nevertheless I continued to be dissatisfied when pondering over such charts as the one for the Approaches to the English Channel, from the South of Ireland to Penmarch. What was the exact worth of all those soundings and of all those contour lines? On this very wide continental shelf all the important banks carry names – a fact that demonstrates their existence better than anything. But what exactly were the merits of each of these soundings measured and positioned in the last century, or in an even earlier age?
Now that I know the remedy, am not at all proud of having taken so long to perceive what was staring me in the face all the time. For 23 years I used to write Sailing Directions, the object of which is to supply all that cannot be shown on a chart, yet it was not until 18 months after the loss of the Antilles that I was to realize that what these Sailing Directions lacked was an appraisal of the value of each chart. These volumes enumerate the relevant charts at the head of each chapter or sub-section; to these details we should now add evaluations, drawn up by hydrographers themselves, regarding the degree of reliability of their work, its limitations, and the uses to which mariners have a right to put it.
This evaluation would have to be revised with each succeeding edition and for each block correction. The mariner should be made aware that a particular edition has been pulled from an already worn plate used for an earlier edition, and that another includes data from a survey on a given date concerning one particular part of the chart and not its other portions. It seems strange that when new editions are exchanged between Hydrographic Offices in the form of the actual charts annotated with these very indications none of us has realized until now that these are of even more concern to the mariner than to the chartmaker.
However it is never too late to mend our ways! It is therefore with a somewhat malicious pleasure that wish those who have followed me every success, for the critical evaluation of certain charts will be an unremitting task that will sometimes lead to curious discoveries. At least ten years will be needed to complete a first evaluation, and what is more, the need for fresh ones will no doubt arise, and they in their turn will destroy, modify and reveal.
Such is man’s lot. Three centuries ago Boileau had this advice to give about taking up a work only just completed: “Polish it unceasingly, and then polish it all over again”. In the French Navy there is a caustic and somewhat disillusioned saying: “To do a job and then to undo it – both arc still work”, although I cannot say that I myself approve of this dictum.
The exegesis I am advocating is at one and the same time a science and an art: the task should be allotted to those same patient, careful and disinterested cartographers who must be relentless in their probings of the depths of the human mind. There are already scriptural, juridical and literary exegeses: it is an honour for the nautical cartographer to join this company.