
Preamble
This manuscript is a reprint of the original paper previously published in 2000 in The International Hydrographic Review (IHR, https://ihr.iho.int/): Hecht, H. (2000). Hydrographic GIS. The International Hydrographic Review, 1(2), new series, 71–76. https://journals.lib.unb.ca/index.php/ihr/article/view/20499/23662
1 Introduction
Geographic information has been the basic information for navigation at land and at sea as well as for military and administrative purposes since the early beginnings of our culture. Since these early days maps and charts have been used both for displaying the information and as analogue databases, containing the geo-referenced data in a graphically fixed form.
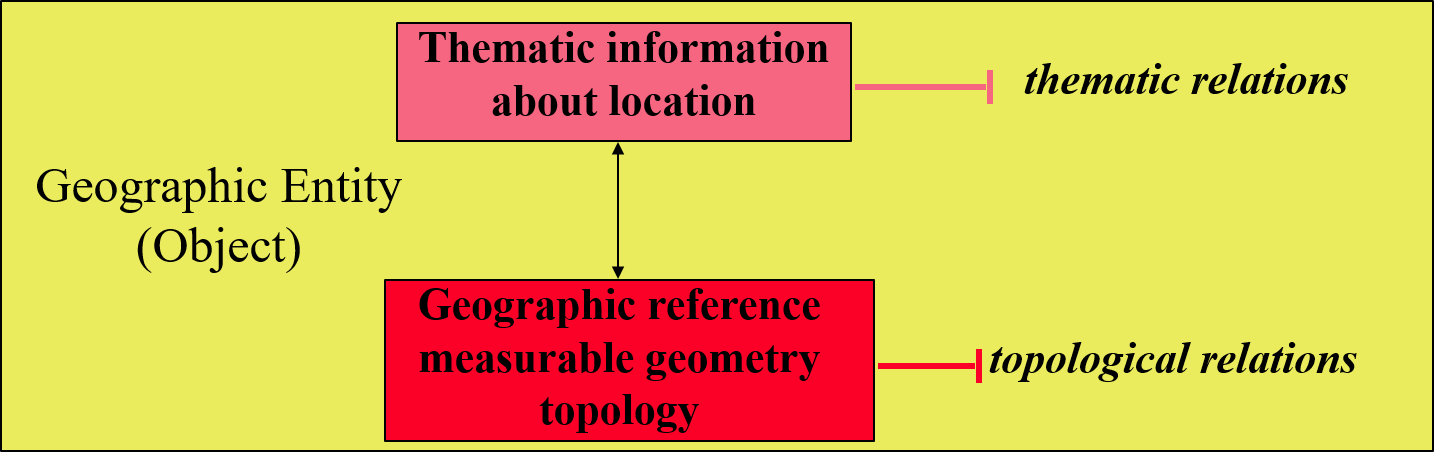
Geographic Information (GI) may be defined as an information entity providing a qualitative description of a location together with a quantitative, measurable geo graphic reference containing positional and topological information, and its relationships to other geographic information entities (Fig. 1). The development of information technology, together with the tremendous increase of computer power have, for the first time in history, now allowed a new, direct access to geographic information by means of digital databases. Geographic information can be retrieved, evaluated and presented today in a very diverse, flexible manner without being restricted by graphical symbols and their need of translation through cartographic legends. At the same time the real-time positioning possible with the Global Positioning System (GPS), together with digital survey methods (remote sensing, digital sounding) have tremendously increased efficiency of information collection. Correspondingly, new applications have emerged in the use of geographic information, particularly in conjunction with GPS for real-time navigation. Technological progress and the increasing requirements of navigation and administration lead to a development where, as a vision, ‘accurate and up-to-date, high resolution geographic information will be readily available from anywhere (land, sea, air) and for any purpose’.
This will require:
- Completing / updating geographic data coverage on a global scale
- Availability of data as digital vector source data (as opposed to analogue raster data or data digitised from analogue sources)
- Interoperability between GI data of various sources (land, atmospheric, hydrographic and oceanographic data)
- Networking between geographic information providers
2 The position of hydrography in geographic information
Hydrography traditionally has been a service for navies and merchant fleets. In this function hydrography has helped mankind to establish and secure a global transportation network which is the basis for our modern economy. It also helped to explore the hydrosphere both scientifically and economically. As a natural consequence it became necessary to agree on common rules for administering the marine space. This has been accomplished through the UN Convention on the Law of the Sea (UNCLOS) where hydrography has been given an additional function in:
- Claims of maritime boundaries
- Marine environmental monitoring
- Use of the Exclusive Economic Zone (EEZ)
- Management of living and non-living marine resources
Hydrography, together with the related science of oceanography, has natural interfaces with topography on the land, and with the atmospheric sciences. Hydrograph y at present, however, seems still being pretty isolated from these other types of geographic information. This may be illustrated in the following example.
3 The Baltic Sea Region project
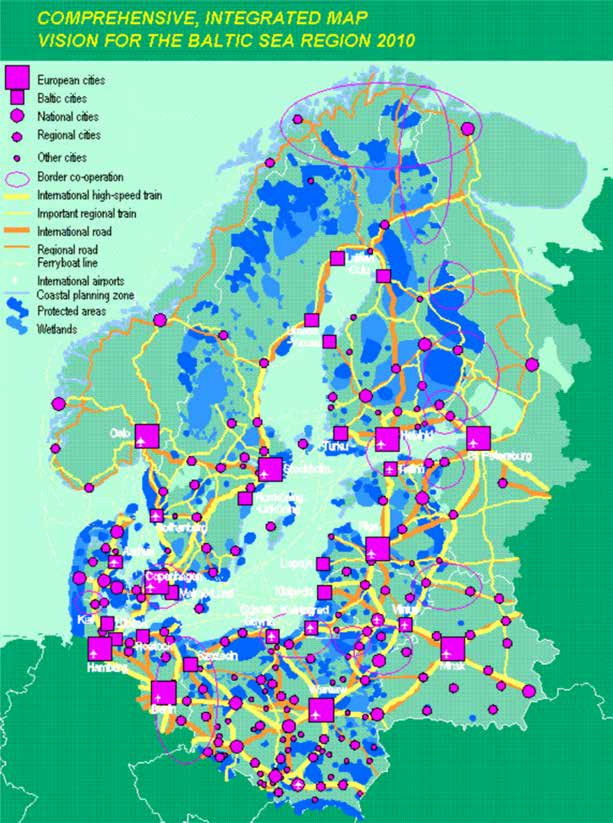
The Baltic Sea Region (BSR) interestingly is defined in hydrological terms as the Baltic drainage area, i.e. those countries having rivers flowing into the Baltic Sea. Thus, not only the coastal states surrounding the Baltic Sea are considered to belong to the Baltic Sea Region but also more distant countries like Belarus belong to it (Fig. 2). As the result of the dramatical political changes, governments of this region in 1994 set up a joint programme to intensify mutual cooperation, and to speed up economical and environmental development. Spatial planning and administration has soon been recognised as crucial for this purpose.
This resulted in the so-called Stockholm Declaration1 of 21 October 1996:
- Outlining a policy of sustainable development for ‘coupling of economic development needed in cities and regions with the cautious use of the coastal zone and landscape in the hinterland’
- Launching a Baltic Region-wide GIS initiative involving:
- The Helsinki Commission (marine environmental protection)
- The MAP Baltic Sea Region (MAP BSR) Project of national mapping authorities
- The University GIS Network of Upsala University
Funding was provided by the European Union under the Baltic Sea Region Initiative.
Although sea-borne traffic plays a very important role in the Baltic Sea2 – approximately 60 million passengers are ferried annually across the Baltic Sea – hydrography has not been taken into account in the Baltic Sea Region Project. On the other hand, the third conference of the Ministers of Transport of the Baltic Sea States, at a conference in Berlin on 21 April 1997, has stated the goals for the Baltic Sea to:
- Promote maritime transport as environmentally friendly means of transport
- Providing ‘continuous transport systems, by integration of all modes of transport’
- ‘Provide European-wide logistic systems and interoperable information and communication systems for electronic data exchange along the transport chain’
The fact that hydrography has been ignored in the set-up of both projects seems to illustrate that the provision of marine safety information is considered a separate issue not related to spatial administration, or to the integration of transport systems. In other words, hydrography has not yet been made visible as the prime source of marine information having a potential impact on sustainable development, especially in the coastal zone area (coastal zone management), as well as on the efficiency of intermodal transport, e.g. by increasing safety and efficiency of the maritime transport.
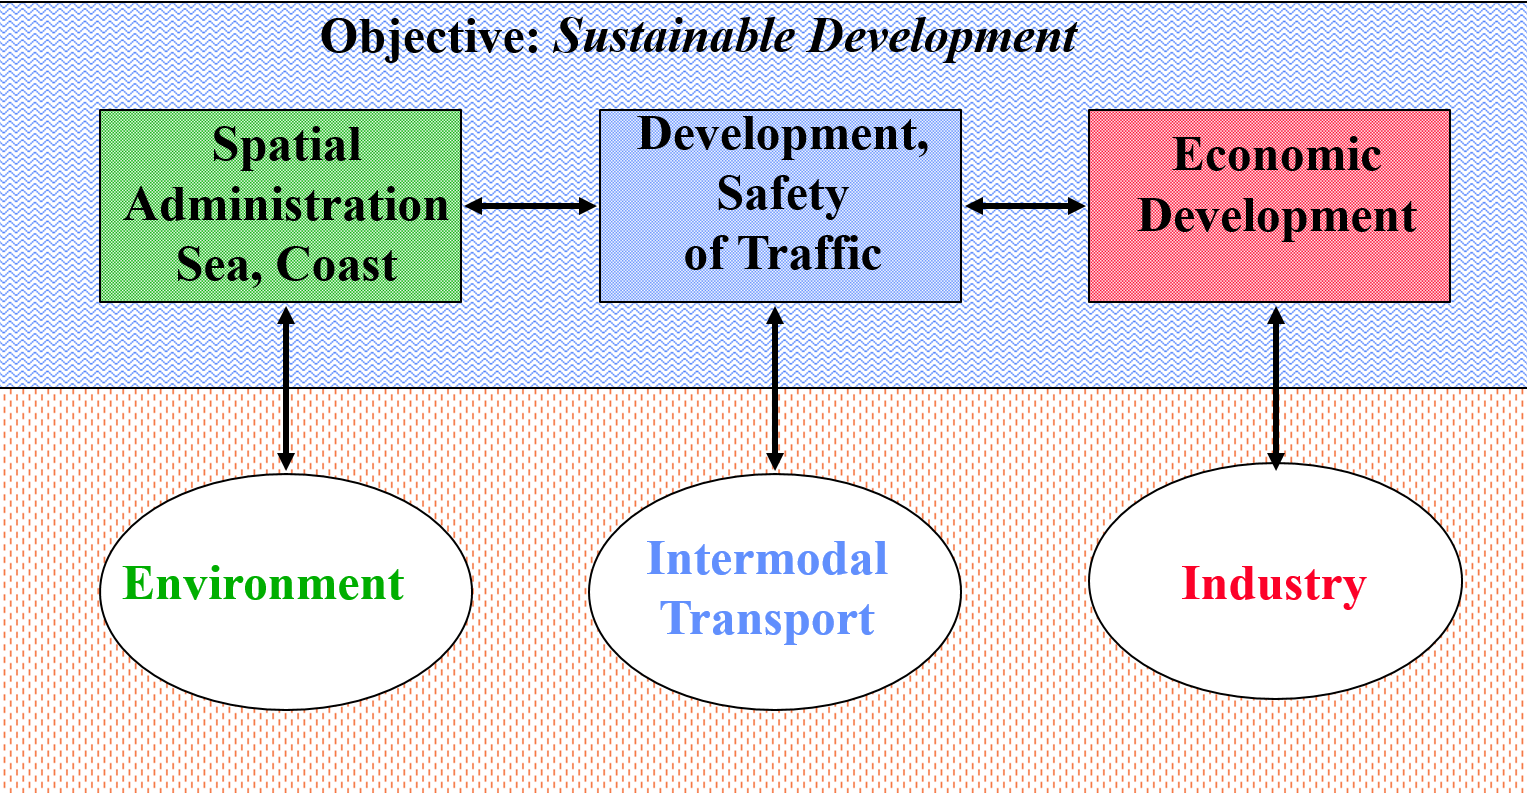
It is a trivial fact that the coastline links seaside and landside. Thereby spatial administration traffic management and economic development are closely related and form the objective of Coastal Zone Management (Fig. 3).
4 Vessel Traffic Management and Information Services
Vessel traffic services have been established world-wide as an efficient means of securing safety of navigation especially in congested and narrow waters. This concept has recently been broadened towards vessel traffic management and information systems in order to increase efficiency of navigation.
Vessel traffic management, the essential function of vessel traffic services, is defined as follows: ‘The set of efforts (measures, provisions, services and related functions) which, within a given area and under specified circumstances intend to minimise risks for safety and the environment, whilst maximising the efficiency of water-borne and connecting modes of transport’.
In its broadened meaning ‘Vessel Traffic Management and Information Services’ intend to respond to public and private demand for facilitating vessel traffic management. Vessel traffic management and information services include services distributing in given areas (at regional, national or transnational level) the pertinent information to be used both in real-time and in retrieval modes by actors involved. Hydrographic information is, to a limited extent, already part of VTS today, e.g. Navigational Warnings. More, however, is being needed such as, e.g., real-time surface current data at the approaches of ports where cross currents are known to be dangerous, digital navigational warnings or temporary updates of electronic chart data, latest ice information etc. In addition, it has proven to be very useful if both VTS Centres and ships at sea have the same and up-to-date level of electronic chart data both for navigation and geographic reference.
In principle, VTMIS is conceived as a system linking:
- Logistic information
- Traffic information (land/sea) Navigational information and warnings
- Meteorological and current data, ice information
The European Union, in a Concerted Action, has studied the potential of VTMIS to enhance maritime transport, and potential measures for their implementation. One important aspect is networking together the various information to facilitate access by ship operators, maritime administrations and ships at sea to obtain the relevant latest information. The European Union within the Fourth Frame Work Programme currently has established a project on information of a VTMIS Information Network.3
5 Implementation of GIS at Hydrographic Offices
With its ‘Transfer Standard for Digital Hydrographjc Data# (Special Publication S-57) IHO has established a flexible, powerful, modern GI data standard for digital hydrographic data. It has been already accepted as a world-wide transfer standard for the Electronic Chart Display and Information System (ECDIS) which itself is a real-time navigation information system. ECDIS, however, currently is the only realisation (application profile) of this standard for particular purpose. In principle, S-57 represents an excellent basis for a wide range of hydrographic information systems. Many hydrographic offices today are already working on establishing hydrographic information systems allowing the integration of different product lines, such as:
- Production of ECDIS data
- Storing the results of hydrographic surveys
- Production of paper charts and nautical publications
With the necessary extensions to the Object and Attribute Catalogues of S-57, it is easy to extend the capability of S-57 to many other applications, for instance in oceanography. As an object-based standard it provides the potential for linking the GIS systems of HOs to other external GIS of land mapping authorities, maritime and port authorities, universities and other scientific institutions.
6 Extended information services planned at BSH
The following is a description of developments planned at the Federal Maritime and Hydrographic Agency (BSH), Germany, as an example.
Like many other (currently 10) hydrographic offices, BSH is co-operating with the Regional Electronic Navigational Chart Coordinating Centre Northern Europe, PRIMAR, on the distribution of electronic chart data and provision of respective updating services.
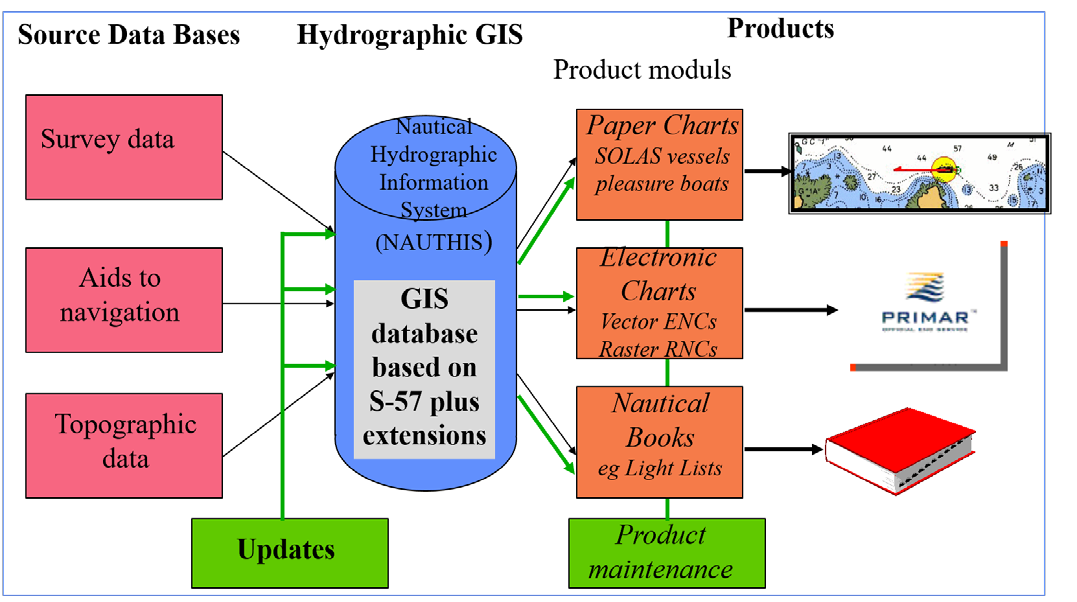
In order to integrate their production lines for the traditional paper products and the electronic chart data, BSH has set up a project to develop a ‘Nautical Hydrographic Information System’ (NAUTHIS, see schematic overview in Fig. 4).
Experiences from seagoing tests of ECDIS have shown that ECDIS as a navigation system is used in a different manner than the traditional paper chart. In particular, in narrow waters the virtually unlimited zooming capabilities of ECDIS are stretched to their limits. It has turned out that it would be unsatisfactory, and in the long run even unsafe, if ECDIS data would only be based on digitised paper chart products. Rather ECDIS data must reflect the full data accuracy of the regional source data. As the ECDIS database is a combination of hydrographic and relevant topographic data where data from different authorities are being compiled into a single database, it is seen essential to develop any hydrographic information systems of HOs into a source database for hydrographic data networked wit11 source databases of other relevant authorities. This is a goal pursued in the medium term for NAUTHIS where links will be established to topographic data bases of federal coastal states of Germany, and databases operated by local water and shipping off ices.
7 Conclusions
Hydrographic data are essential geographic base data increasingly needed beyond navigation, for EEZ administration. Vector geographic information data offer a huge synergy potential when networked with other databases.
The technological progress with computer power and telecommunication will put HOs under pressure to incorporate the data with larger national geographic information networks. The VTMIS project of the European Commission is an example and part of the policy of EU forming trans-European geographic information data networks to facilitate administration (multi-modal transport, economic development and environmental protection).
Hydrographic Offices will have to adjust soon to the widening scope of geographic information in a net worked world.
8 Note
This article is a text version of a lecture presented at the ‘Workshop on the modern management of a hydrographic service’ on 23 September 1999 at the International Maritime Academy in Trieste, Italy.
Author’s biography
Horst Hecht, born 1943, received a master’s degree in meteorology in 1969 at the Free University Berlin. From 1970 to 1988 he was serving as IT manager at the German Hydrographic Institute, which 1990 became the German Federal Maritime and Hydrographic Agency (BSH). From 1988 to his retirement in 2008 he was Director of the Hydrographic Department, acting also as head of the Rostock office of BSH from 2003 to 2008. For many years, he was involved with ECDIS standardisation in various bodies of IHO and IMO, and he is co-author of the textbook “The Electronic Chart”. After his retirement, he was active until 2017 as freelancer and senior scientific advisor on marine GIS issues to a major geospatial software company.

- Stockholm Declaration on Sustainable Spatial Development Policy in the Baltic Sea Region. Internet URL: https://vasab.org/home/about/ministerial-conferences/stockholm-1996/ (accessed 23 Feb. 2023).
- Laue, U. (1998). Ostseeschiffahrt – Besonderheiten und Entwicklungen (Baltic Sea shipping – peculiarities and developments). Schiff & Hafen 3/98, p. 10–13.