
Preamble
This manuscript is a reprint of the original paper previously published in 1972 in The International Hydrographic Review (IHR, https://ihr.iho.int/): Pascoe, L. N. (1972). World bathymetric charts – On the requirement for a world wide bathymetric chart on a scale larger than the General Bathymetric Chart of the Oceans (GEBCO). The International Hydrographic Review, 49(1), 153–160. https://journals.lib.unb.ca/index.php/ihr/article/view/23874
~
At the present time, in spite of criticisms that it is on too small a scale, and therefore cannot show bathymetric information in as much detail as oceanographers require, and also that it is not maintained sufficiently up-to-date, the General Bathymetric Chart of the Oceans (GEBCO) affords the only world-wide Bathymetric Chart.
All Hydrographers and many Oceanographers know of this important series of Bathymetric Charts, its purpose and history have been the subject of frequent articles, the most recent being that in the June 1971 issue of the Journal of the British Cartographic Society. It comprises 16 buttjoining sheets each covering 90° of Longitude, arranged in 4 parallel belts, extending from the Equator to Latitudes 46°40’ N and S, and from 46°40’ to Latitudes 72° N and S, on Mercator projection, scale 1/10 000 000 at the Equator, 1/6 860 000 at Latitude 46°40’ and 1/3 100 000 at Latitude 72°. They are complemented by 8 charts for the Polar Areas on the Lambert Conformal projection, each chart a quadrant, a rolling fit at the same scale at Latitude 72°, the scale decreasing slightly to 1/3 180 000 at the Poles.
These charts are produced by the International Hydrographic Bureau (IHB) with co-operation in the supply of information, co-ordination and cartographic compilation by all the member states of the International Hydrographic Organization (IHO). However, in spite of much international effort and considerable expense, of the 16 Mercator charts of the oceans only those of the Atlantic Ocean have been revised by New Editions since 1955, and only a small proportion of the enormous amount of bathymetric information obtained in the last 20 years is presently available in published form.
The GEBCO series shows bathymetric contours at every 1 000 metres outside the Continental Shelf and Margins enhanced by the customary blue hypsometric layer tints deepening in colour with increasing depth. Whilst this artificial method of representing morphological relief is occasionally subjected to criticism, iso-lines are accepted as the most scientific method of cartographic relief representation and the GEBCO series has been criticised only in that additional depth contours at least at every 500 metres are not shown.
The GEBCO series, although somewhat out-of-date, affords complete worldwide coverage, no other such complete coverage has yet been published at this scale. Bathymetric charts of the separate oceans have been published but no complete worldwide series. GEBCO has been criticised as being on too small a scale. Charts of certain ocean areas are available in published form on larger scales. The U.S. Naval Oceanographic Office publish Bathymetric Charts (BC charts) of the North Atlantic and North Pacific Oceans and the Mediterranean Sea. These are on Mercator projection, scale 1° Longitude = 4 inches, i.e. 1/1 100 000 at the Equator, 1/950 000 at Latitude 30° N and 1/550 000 at Latitude 60° N with depth contours at every 100 fathoms mostly shown in pecked lines, being interpolated from insufficient information, and most were published in the period 1951 to 1953.
The new, massive World Map on 1/2 500 000 – in reality also a World Chart – now in process of publication by the Socialist nations of Eastern Europe, is still far from complete and the rate of publication of new sheets has decreased in recent years. Of the ocean areas only those fringing the Americas and South Africa are at present available. The sheets of this World Chart are published in 6 zones, from the Equator to Latitude 24° and from Latitude 24° to Latitude 64° on the Conical Equidistant projection, and on a Polar Azimuthal Projection from Latitude 64° to the Poles. Bathymetry outside the Continental Margins is shown by depth contours at every 1 000 metres, i.e., not more closely than those given on the much smaller scale GEBCO charts, supplemented by hypsometric layer tints of 5 gradations of blue.
Additional to these, the only other available bathymetric charts are of limited areas, for example those published of “national” areas or from the results of scientific expeditions, e.g., the 1/2 000 000 charts of the North West area of the Indian Ocean. The Japanese Hydrographic Office publishes Bathymetric charts of the ocean areas around Japan and these supplement the United States BC charts.
The total world coverage of contoured Bathymetric charts available in published form, other than the GEBCO series, is thus of limited extent.
However, one other important source of bathymetric information is available. This is the International series of Ocean Sounding Plotting Sheets compiled under the auspices of the International Hydrographic Organisation with the assistance of all member nations. Individual Plotting Sheets are obtainable from several National Hydrographic Offices or from the IHB and give all worldwide original Bathymetric information at present available. This series of 600 sheets is grouped into 8 latitudinal bands each with a common mid-latitude and hence a common longitude scale, the mid-latitude scale of each band being 1/1 000 000. The Hydrographic Offices of 16 nations have accepted national responsibility in agreed ocean areas covering the whole world for the collection of all bathymetric information and for the compilation and maintenance of this information on the master Ocean Sounding Plotting Sheets covering their accepted areas. These master sheets arc compiled in manuscript and show all available depths, to a density limited only by the scale. Some plotting sheets give depths in Fathoms, some are in Metres. These master sheets are maintained in as up-to-date a state as possible, depending on the resources of the national hydrographic office, from information obtained by the nation concerned or supplied from ships of other nations. Copies are made available at a reasonable charge. In recent years certain nations have commenced periodic revision of their master plotting sheets and publish printed copies.
The existence of these Ocean Sounding Plotting Sheets is well known to oceanographers. They are the basis for the GEBCO series of charts.
However, the master plotting sheets show only depth information outside the 200 metre (100 fathom) contour line and on many sheets the coastline of the mainland, and of the islands, is not given, and the continuous compilation in manuscript of dense lines of depth figures, often crossing at narrow angles, makes these important documents somewhat confused and illegible. Until depth contour lines have been added to these crowded plotting sheets they are sometimes unintelligible.
The GEBCO charts are compiled directly from these plotting sheets, contours being first added and compilation made in two stages to accommodate the large scale reduction and with minimum generalisation.
GEBCO has also been criticised in that it is on too small a scale, and a larger scale of about 1/2 000 000 is now desirable. This is the scale of the charts of the new multi-nation International Indian Ocean Expedition, recently published.
Such a larger scale worldwide Bathymetric chart is now possible. The recently agreed International Series of Navigational Charts on Mercator projection, scale 1/3 500 000 at Latitude 22°30’, 1/2 000 000 at Latitude 55°, now being produced with International co-operation under the auspices of the IHO now makes this possible. In the early stages of the preparation of this navigational chart, fully detailed bathymetric contours would normally be compiled on the 1/1 000 000 plotting sheets and the availability of this compilation makes the production of a bathymetric version of each International chart a practical proposition.
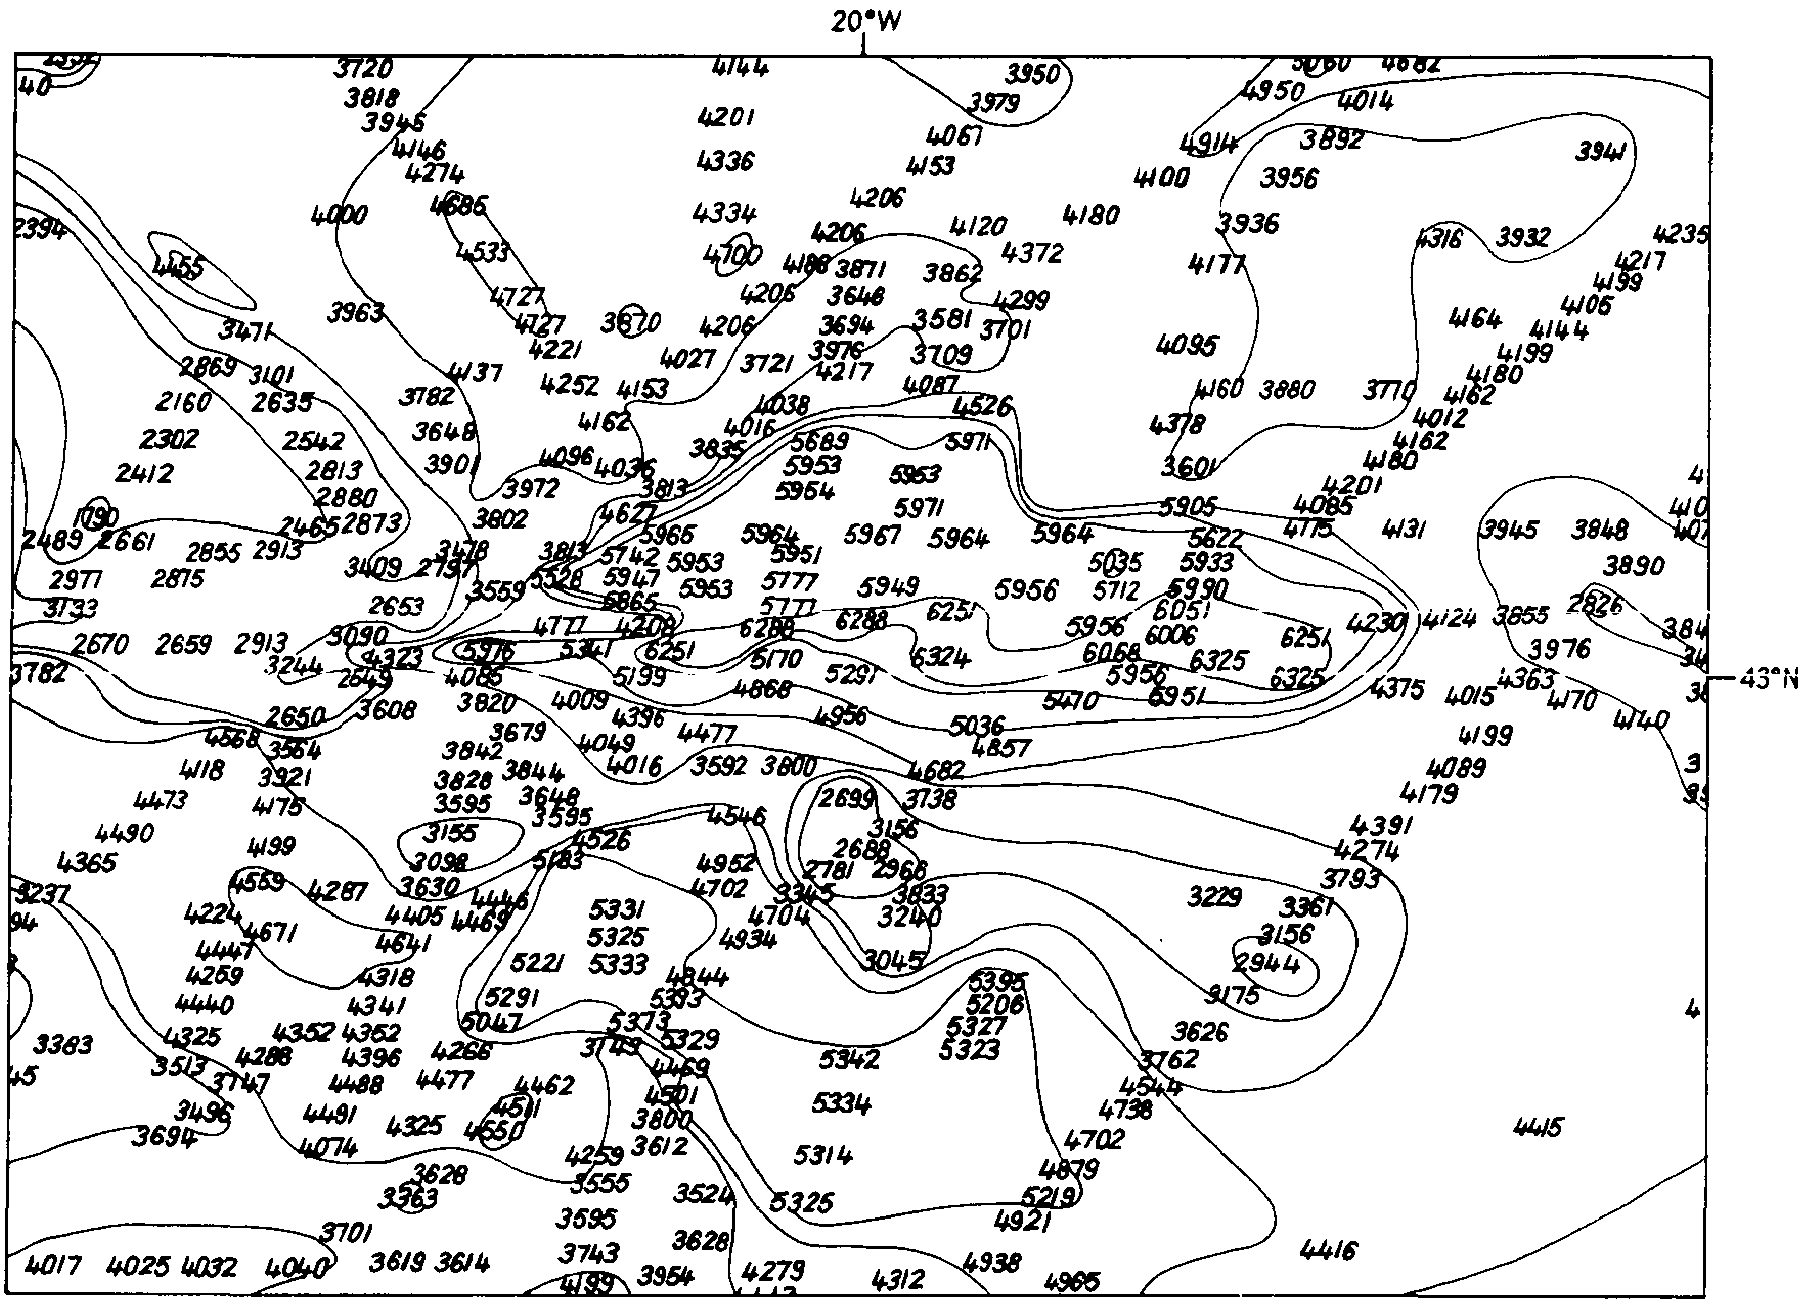
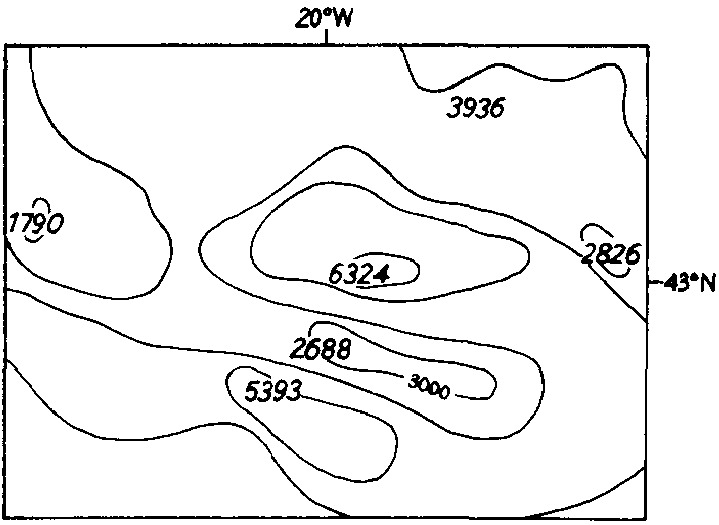
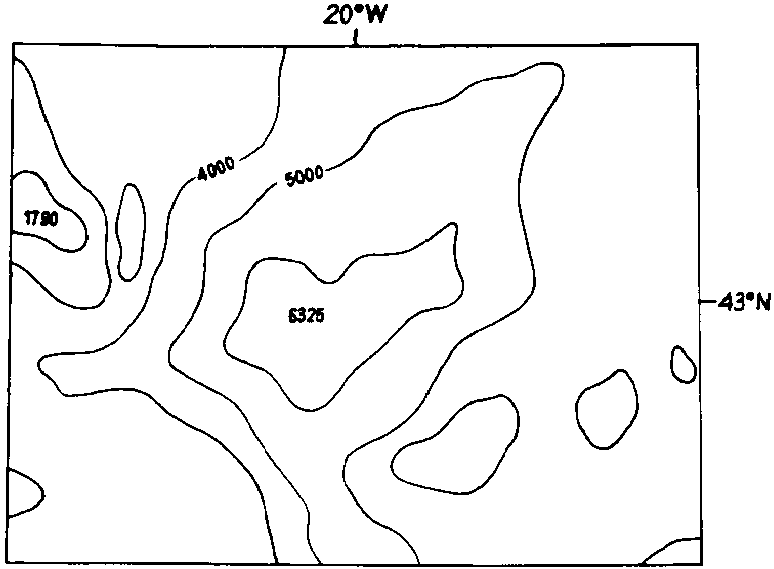
The usual steps in the preliminary compilation of these charts are shown in Figs. 1, 2, and 3. Fig. 1 shows all the available depths in metres in an area close Northward of the Açores as plotted on the relevant Ocean Plotting Sheet, with depth contours interpolated at every 500 metres. Fig. 2 shows these contours reduced to the scale of the chart, 1/2 750 000 at this latitude, before generalisation. Fig. 3 shows the relevant portion of the navigational chart with generalised depth contours. For comparison the same area as shown on the relevant World Map on 1/2 500 000 is given in Fig. 4 (less the four shades of the blue hypsometric tint).
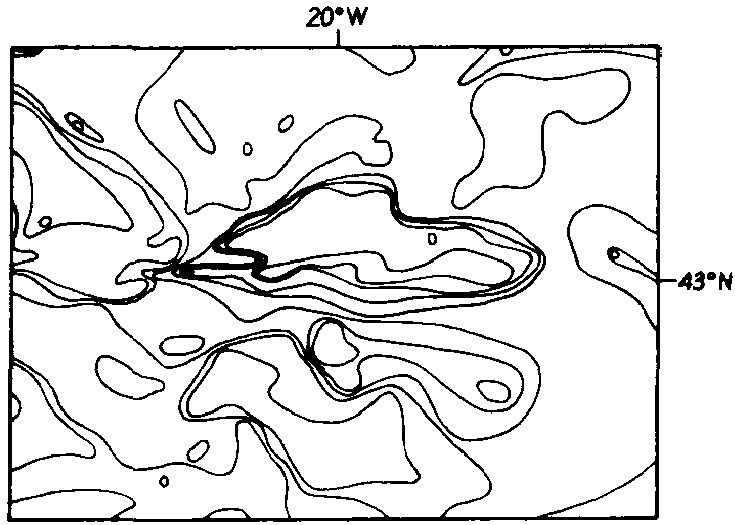
The compilation stage shown in the Fig. 2 example could thus be the basis of a detailed bathymetric chart, as most of the compilation is complete and only mechanical copying and preparation of any tint plates needs still to be done. When the compilation stage of adding contours on the plotting sheets is carried out by, or in conjunction with, oceanographers no criticisms regarding scientific accuracy can be made. The task of producing a bathy metric version of each sheet of the agreed International Chart series is thus shown to be relatively easy.
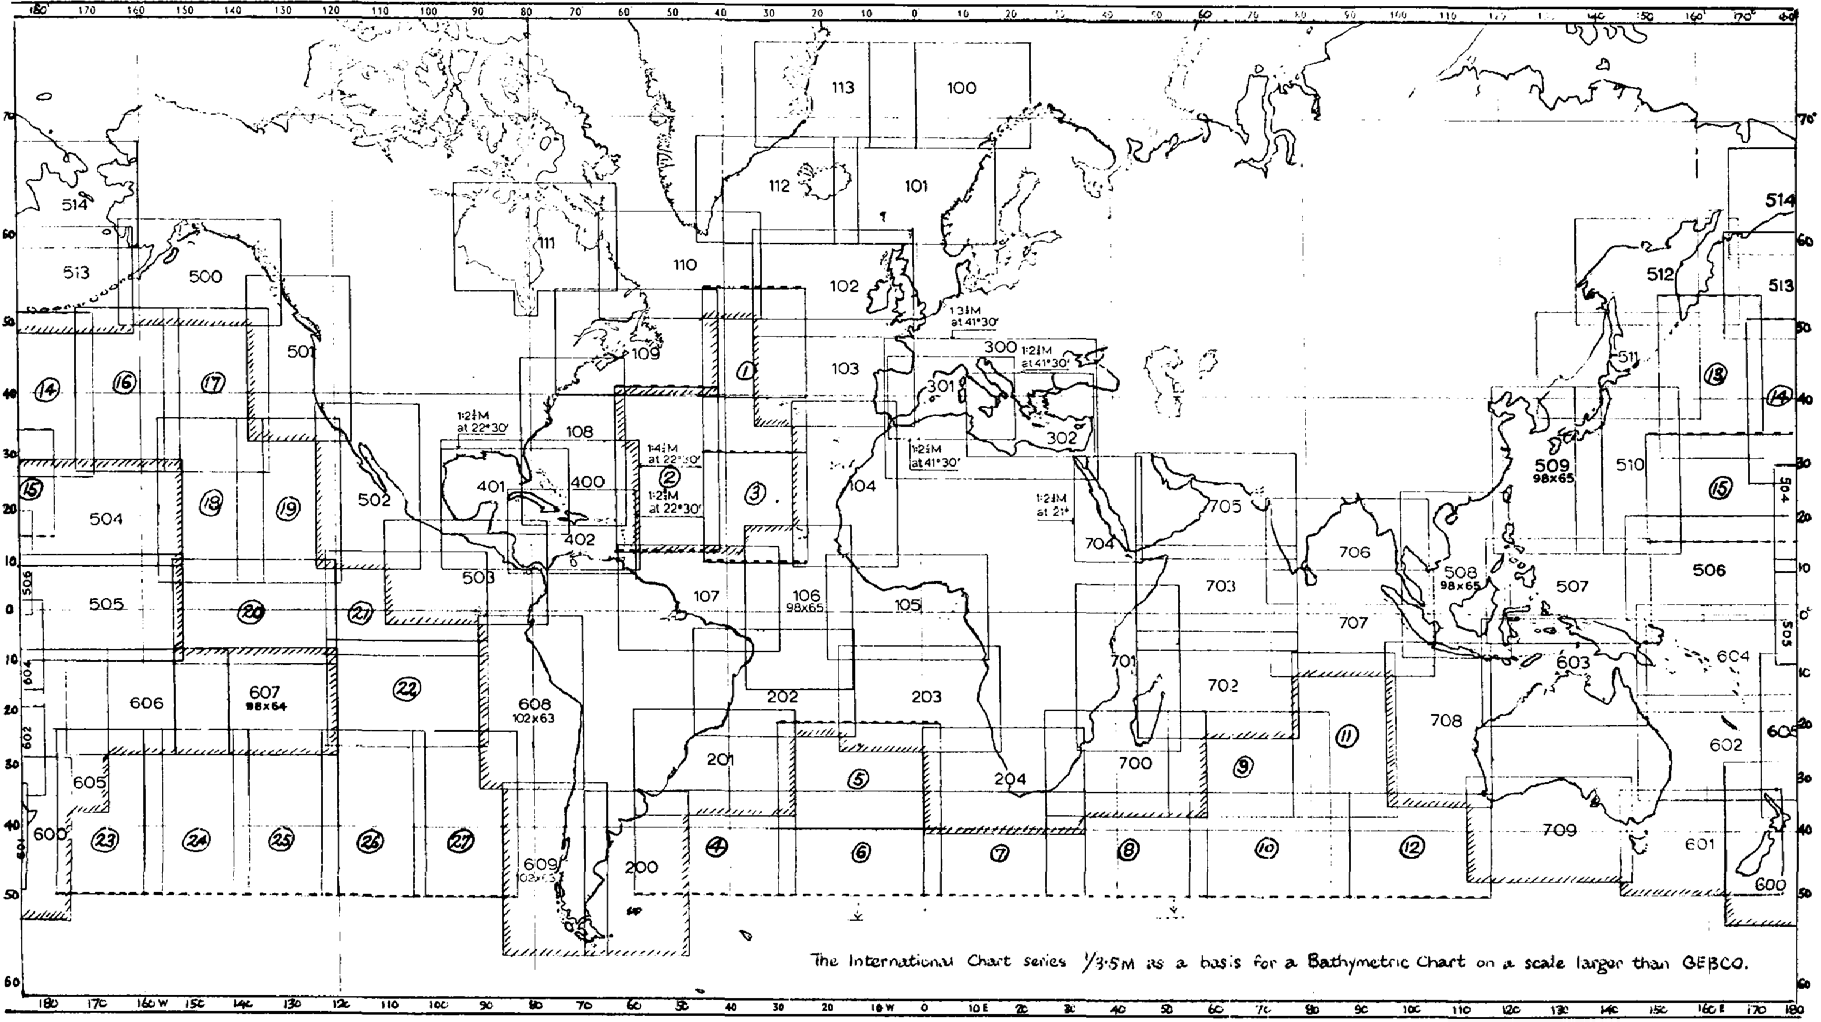
The limits of each sheet of this series are given in Fig. 5. These sheets have been schemed only for navigational requirements, with adequate overlaps, and the series does not cover the scientifically interesting central ocean areas. Limits of possible additional charts to cover these areas are shown on Fig. 5 with a distinctive numbering. Three additional charts, for example, would give complete coverage of the North Atlantic.
Again, it is expected that the International Charts will be revised every 5 years, at each Magnetic Epoch, for correction of the isogonals, and this stage should also include an up-dating of bathymetry. So that it is possible that a similar 5 year cyclic revision of any relevant Bathymetric chart could also be anticipated.
It is appreciated that new techniques of mechanical or semi-mechanical methods using line digitisers, computers, and automatic plotters will permit much greater freedom in the production of any bathymetric chart, where most of the detail is in line form, once the relevant contours have been made available from the continuously-updated plotting sheets.
This article is being written to bring to the notice of World Oceanographers the opportunity that the production of the International Chart series now presents, and it is being published to bring this also to the attention of the compiling Hydrographic Offices, so that the important detailed contoured compilation material, as shown in Fig. 2, is not needlessly destroyed.
It must be mentioned here that any such series of Bathymetric Charts, even with International co-operation, would constitute a major additional undertaking by hard-pressed Hydrographic Offices.
The most important question must now be asked: “What Bathymetric Chart of the World do Oceanographers Require?” i.e., need. Is there a real requirement for a complete worldwide series on a scale of about 1/2 000 000 as has sometimes been stated to the author, or does that need exist only for charts of limited areas of special interest? And what then is the optimum scale? It is possible that Oceanographical Science will be satisfied with such limited area charts, e.g., of some portions of the Atlantic, with detailed larger scale charts to he made when adequate survey position accuracy is available of even more limited areas, e.g., of typical oceanographic features, seamounts, trenches, etc.?
And when these large scale graphics of ‘typical examples’ are possible, will not they not better appear in Ocean Science text books and thus be unnecessary in any other published form?
But until Cartographers know what are the considered requirements of Oceanographers for Bathymetric Charts, their scale and coverage, it is not possible to discuss in real terms the other important factors of finance and effort.
The Navigational Chart, whether harbour plan, coastal chart, or ocean passage chart, is a necessity. It is a navigational requirement of the first order. Its production, even excluding the heavy cost of the original surveys, its compilation, printing, and subsequent revision, is a costly business, financed from national resources with only limited re-balance from chart sales.
The Bathymetric Chart, with its layer tints, has hitherto been regarded as not a necessity. Its production has been scientifically important and desirable, and its production has been financed usually only by enlightened Foundations or by International co-operation, in the few series of charts now available. With increasing interest internationally in Oceanography, with the increasing development of the resources of the sea bed in deep and ever-deeper waters, the gathering of bathymetric information is of great practical importance for both scientific and economic purposes. But its communication, in as comprehensive and easily understood a manner as possible, requires presentation in chart form. For multi-user availability, this requires a published Bathymetric chart and the producers and publishers of present small scale navigational charts, the Hydrographic Offices, would appear to be the most efficient publishers of Bathymetric charts.
But this article which demonstrates the overlap between the production of the Navigational small scale chart and a detailed Bathymetric chart, must bring to the notice of Oceanographers the other factors of finance and effort.
The problem of finance needs no re-stating. But effort, the compilation effort of trained cartographers, proficient not only in cartographic techniques but in the evaluation and synthesis of source material now being obtained in ever-increasing quantities by ships and research vessels of many nations, is almost as important a problem as finance, in that there is a very limited staff available with such expertise.
However, it could be considered regrettable that much of the large amount of bathymetric information obtained in recent years has not yet been made available in published chart form. It may be that the 600 manuscript Ocean Sounding Plotting Sheets produced with International co-operation under the auspices of the IHO, with copies available from the several participating Hydrographic Offices are sufficient for all scientific and economic purposes.
The attention of Oceanographers is called to the 9th International Cartographic Association (ICA) Congress to be held in Ottawa, Canada, later in 1972. The theme of the morning session on Wednesday, 23 August is Marine Cartography, this theme to exclude Nautical Charting. This article was written for presentation al that conference, hut it was decided to publish it in this volume of the Review, thus ensuring that it will available for advance information, both to those Hydrographic Offices participating in the International Chart Scheme and to International Oceanographers. It is expected that this article will be referred to during the Marine Cartography meeting of the ICA conference and it is hoped that Oceanographers, with possibly a representative from the Intergovernmental Oceanographic Commission, will be able then to state their requirements for Bathymetric Charts.
The purport of this article is to ask, on behalf of International Cartographers for guidance, for answers to the questions raised herein, and again to mention the controlling words of need, finance, effort.