
Preamble
This manuscript is a reprint of the original paper previously published in 1955 in The International Hydrographic Review (IHR, https://ihr.iho.int/): Day, A. (1955). Hydrographic surveys – The purpose and the choice of scale. The International Hydrographic Review, 32(1), 9–24. https://journals.lib.unb.ca/index.php/ihr/article/view/26749
The main purpose of a navigation chart is to show what lies under the water, in order, first, that a ship shall not take the ground unwittingly, and secondly, that observed changes of depth over identifiable features may be used to assist the determination of her position. The conventional method of showing this information in plan is by a selection of depths reduced to a common datum and they will usually be in greater profusion than the comparable spot heights of the land map. They are supported by contour lines, called fathom lines at sea, using symbols which are strengthened when they surround the shallower areas that need greater emphasis. These depths will invariably have been taken from the final drawing or «fair sheet» of the hydrographic survey of the area and each one will have resulted from an up and down sounding to measure the depth at that particular spot.
There is in fact no known way of determining the depth of a point on the sea floor other than by a vertical measurement from the surface above it; and as far as can be foreseen, the future does not hold any means of seeing through water, at least not in the sense of human vision with its capacity for discrimination and estimation, which is so valuable when more than one dimension is concerned. Even if his was not so, plane-table methods employing the intersection of points of detail on land would seldom be usable, since the sea floor is often covered by sediment which obscures minor detail, as may be observed at low tide at the sea shore especially near a river estuary.
Another type of sea floor may be likened to the Scottish Highlands in which outcropping rocks provide detailed features, although they will often not be recognisable, even when they are visible, from different directions. Such features, when they exist on the sea floor to one side or other of the ship, will be detected, within similar limitations, by Asdics. The Asdic method, which was originally developed for submarine warfare, has, like radar, a beam which is trained in azimuth to give a bearing and distance of an object, provided that it has a surface which will reflect hack a sufficient part of the transmission directed at it. At still shorter ranges there is the new development of under-water television; but these methods have considerable limitations in many of the different conditions encountered under water.
Such a preamble seems unavoidable in any discussion of hydrographic surveying and is particularly important to the present aspect of it. It will sufficiently show why the accepted method of determining the topographical features of the sea floor is by traversing the area with parallel lines of soundings whose distance apart will determine how much is learnt and how much is overlooked. That some detail will be overlooked is inevitable, but it will be the less for the natural processes of smoothing over by sedimentation and the swallowing up of objects in soft sand or mud, or alternatively as a result of the use of Asdics and other methods in addition to systematic sounding.
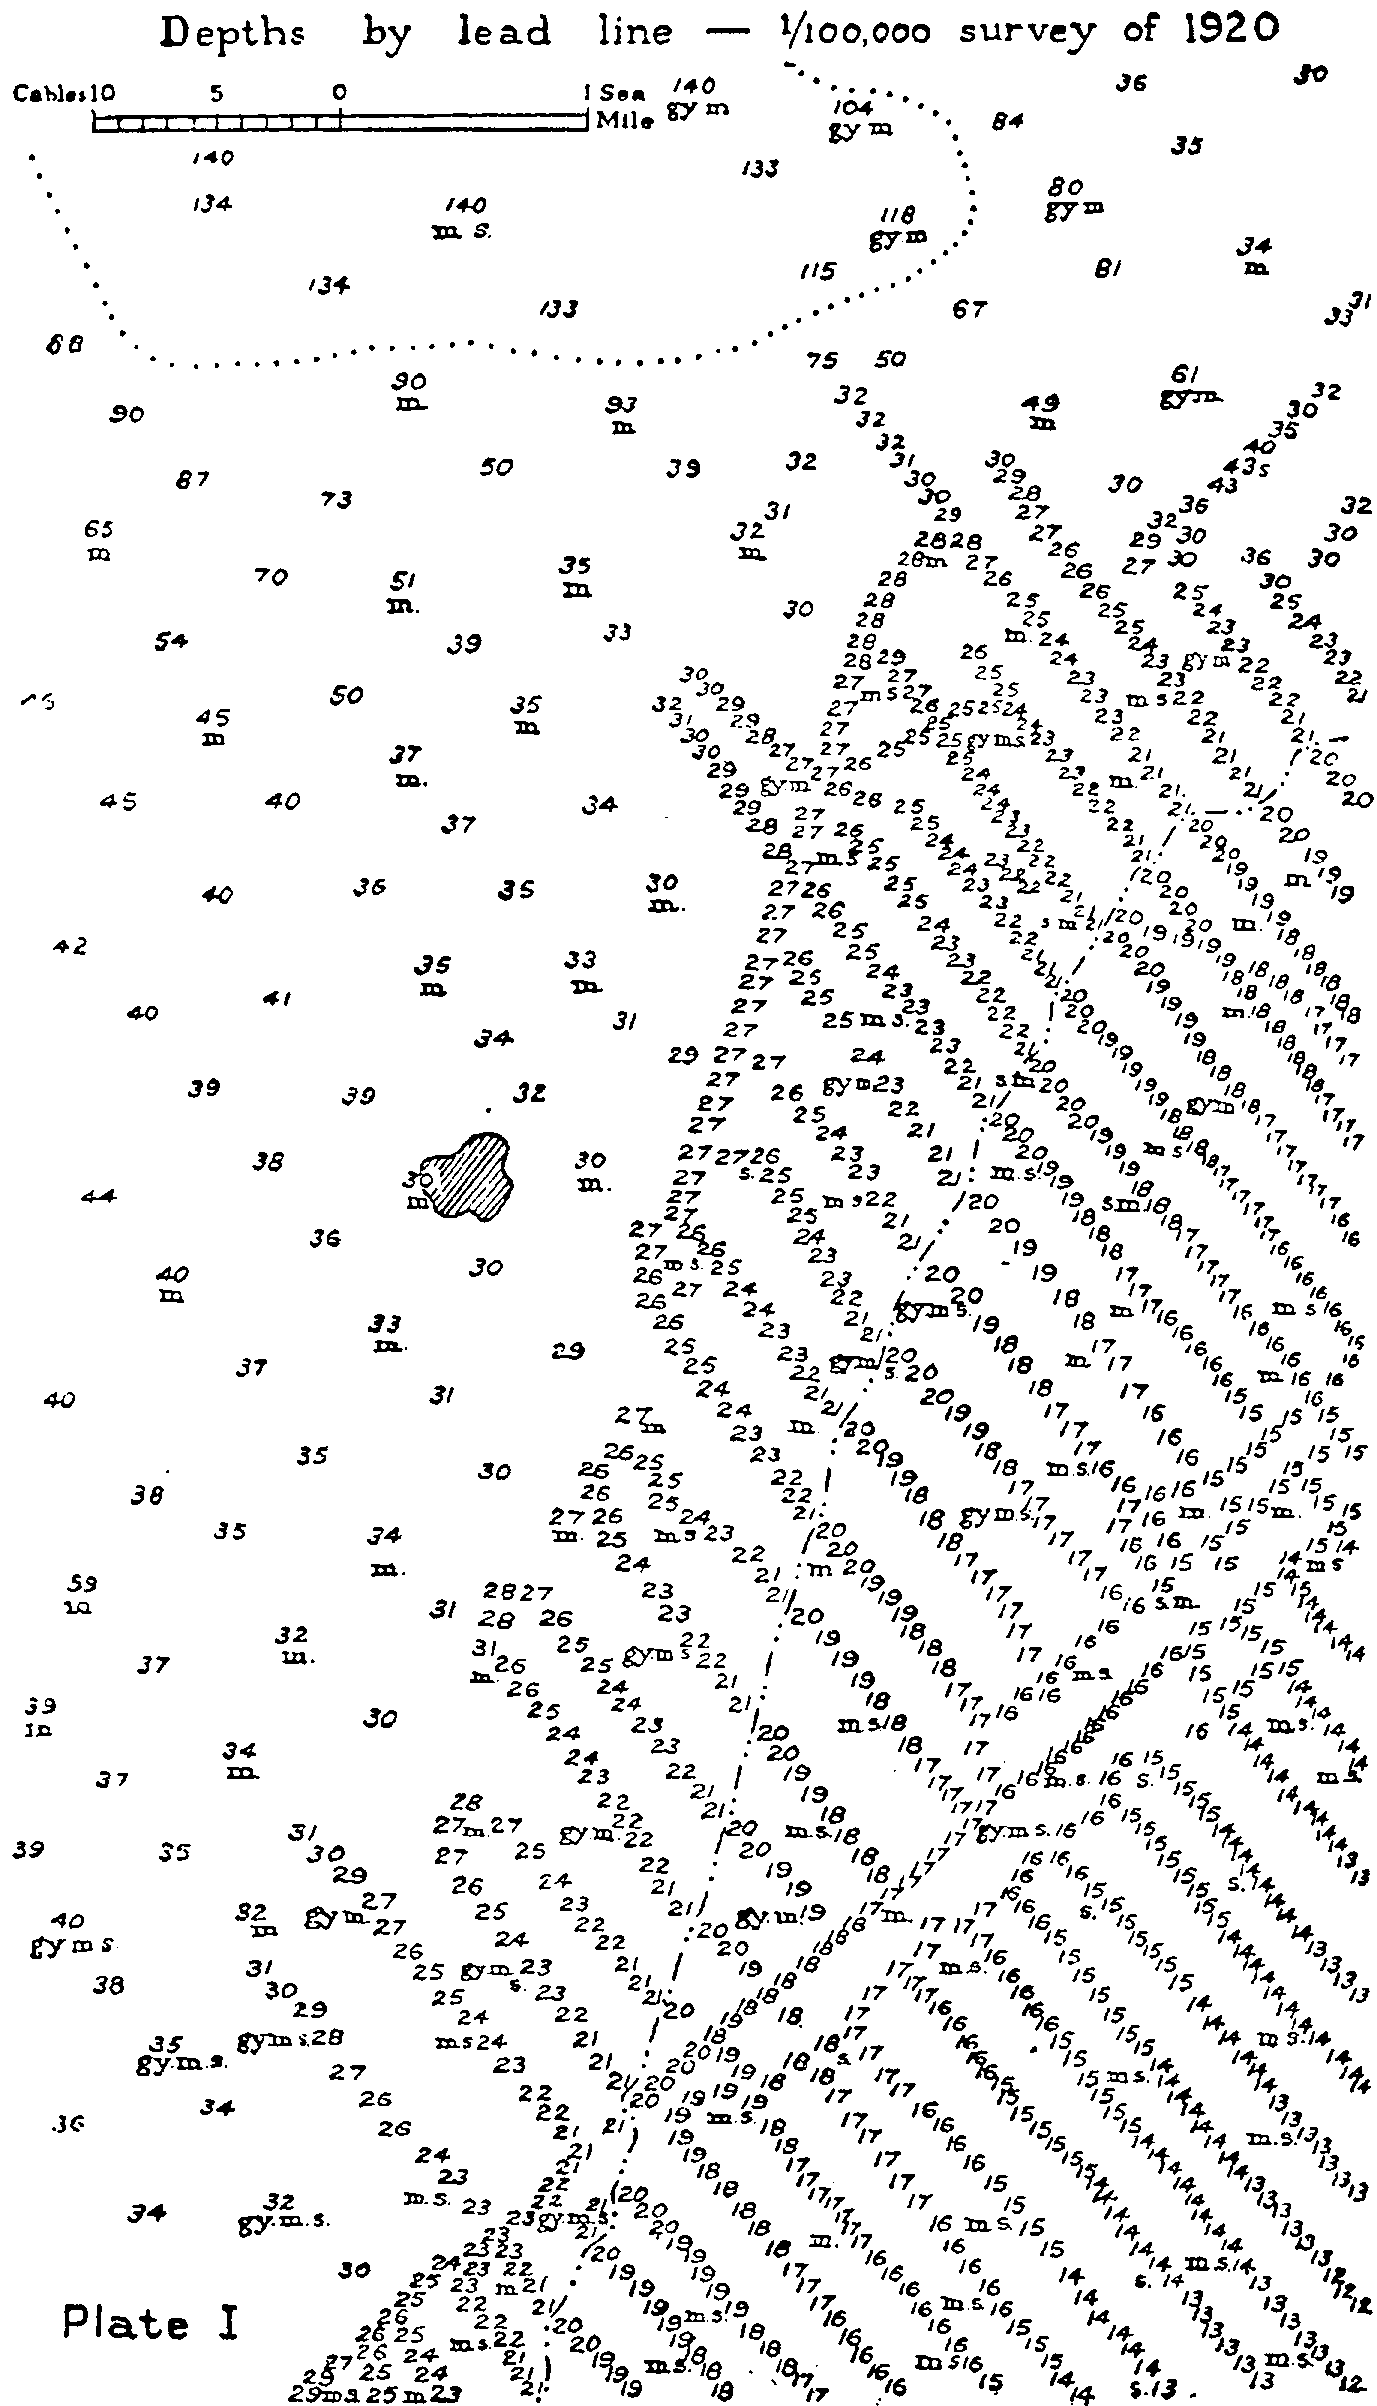
In the naval surveying service it is standard practice to run the lines of soundings 0.2” apart on paper, as is shown in the bottom right-hand part of Plate I (Fig. 1). This spacing has been adopted since it is convenient for plotting and numbering the fixes of the soundings that have been taken. It is the variation in the distance represented by 0.2” on different scales which is important.
It will be well next to look at the user’s need for varying scales in the charts, which are the end product of the surveys, but it cannot be emphasized too strongly that the purpose of the survey is to find out about the sea floor, whereas the object of the chart is to portray it. The range of scales can be separated into four main divisions of navigation, i.e., ocean, 1/1M to 1/5M or still smaller; offshore, 1/150,000 to 1/500,000; coastal, 1/50,000 to 1/100,000; harbour and approaches, 1/6,000 to 1/25,000. Generally speaking, the closer that a navigator wishes to take his ship to the land, whether below the keel or to one side of the hull, the larger must be the scale of the chart. ln harbour work, the outline of the ship, the wharves and the ground tackle of moorings have to be of a size on paper that permits their proper appreciation and a larger scale than 1/6,000 may be needed exceptionally. Large scales are also required when an area has to be dredged and the amount of spoil to be calculated, although such surveys are more for use .by harbour authorities than the navigator with whom this discussion is more concerned.
Clearly a limit to the largeness of the scale is simply and directly set by the size of instruments and chart tables; and a prospective customer may even have to be warned that the advantage of using a blunter pencil on a larger scale may be offset by the need to use a longer parallel ruler with which to lay off his bearings. It must also not be overlooked that the headlands and shore objects which should be included on the chart to give good fixing on it may, on too large a scale, lie outside the limits of the chart table, to which the British standard size of charts, 38” × 25”, is conditioned. For example, when the scale is one inch to one mile and the standard dimensions become sea miles, the lengthwise two-thirds of a coastal chart which is likely to be sea area is readily worked with a parallel ruler having a convenient length of 18”. Such a ruler will comfortably cover ranges of 12 to 15 miles at which objects at sea are often used.
Having stated that the purpose of the chart and the object of the survey are different, it is necessary to point out that the scale of the survey must not be smaller than that of the chart. By this arrangement, a first principle of chart compilation, which is to work from larger to smaller scales, will be maintained. This could mean that the survey is on an unnecessarily large scale for its main purpose of learning about the sea floor, but on the other hand it will satisfy the need to plot the positions of the under water features with the greater accuracy which the larger scale chart demands. In no other way should the needs of the chart maker, with a projected chart in view, dictate the scale of the survey, nor should they set the limits of the survey, since that might mean stopping short in the delineation of an important feature which extends beyond the limits of the chart. And a last word on charts would be to note that the coastal and larger scales are likely to be directly from surveys, whilst the offshore and ocean scales can be compiled from larger scale charts.
Turning to surveys, it is convenient to discuss first the effect of instrument and paper sizes on the scale to be used, since this has been referred to in relation to the scale of charts. It will be appreciated that the detail of a survey or, in other words, the position of the surveying ship at frequent intervals along her line of soundings, is plotted by station pointer from sextant angles. The three legs of a station pointer express the two horizontal angles which are observed simultaneously with sextants from the bridge of the moving ship, and the legs are laid alongside the three objects on the plot, a comparable but infinitely quicker operation to that of resection on a plane table ashore by drawing in three lines of sight. The largest station pointer made has a graduated circle 12” in diameter and legs which !have an extended length of 48”. It takes two men and a boy to work it, and the length of the rays involved does not make for accuracy unless extreme care is taken. That may be practicable when laying down additional sounding marks on the plot in the quiet of the chart room, but is hardly so on the bridge; where rapid plotting is required so that the ship’s course may be adjusted in good time. Consequently the stations pointers more commonly used have either a 6” or 8” circle, and legs from 24” to 32” in length.
It will be patently obvious that it is more accurate to fix on shore marks than on beacons in the sea which are swinging round or between anchors, and a coastal survey can be well within visibility distance of marks on shore when extending only 15 miles to seaward. A survey scale of 3” to a mile may be desirable and it is aggravating to be unable to use shore marks just because rays of 45” on paper cannot be handled. One solution is prior computation and plotting of circles of equal horizontal angle, but this means accepting the use of very few objects when in fact, if others were available, delays owing to the difficulty of taking sextant angles into the sun or a rain squall would be avoided. At the present time a fine radio solution to this problem is in prospect with the continuous wave distance-measuring system of «two range Decca», provided that the trials recently carried out confirm the theoretical accuracy. Any area within its maximum range, which may be as much as 70 miles, can be readily prepared for plotting fixes by drawing, at whatever scale is required, the arcs of distance circles from the two shore transmitting stations; and the latter need not appear on the field plot.
Another factor which must directly exercise some control on the scale is that the smaller the scale, the more space will be taken up by each figure representing a depth; and the more difficult does it become to arrive at the true delineation of an under-water feature. An old textbook used to put it thus:
«If the scale be one inch to a nautical mile and a square inch be divided into a hundred equal areas (suitable for a hundred figures) each sounding will occupy a space equal to about eight acres, i.e., an area a little larger than the Horse Guards Parade and about twice the area of Trafalgar Square.»
Similar reasons will demand that the scale must be large enough to plot clearly the results of Asdic or wire sweeping operations.
Having disposed of considerations which, to say the least, should not be allowed to have too much bearing on the scale of the survey, attention may be turned to the main purpose of the majority of surveys, which is the delineation of the sea floor, having particular regard to features that may provide danger to navigation. To surface navigation a depth of 45 feet on an individual shoal or obstruction is regarded as potentially dangerous, whilst to submarine navigation it is difficult to set any limit. It is, however, reasonable to think in terms of carrying out detailed surveys to include the 100 fathom line. This is often the edge of the Continental Shelf, beyond which there are steep gradients to oceanic depths that are of much less concern either to under-water warfare or surface navigation.
What kinds of feature must be catered for in the, so to speak, blindfold search? What gradients may be expected? How far apart can the lines of soundings be and yet be sum of drawing attention to a need to look more closely? To what extent will this vary with the depth?
Some knowledge of geology will clearly be a help, but there is the usual difficulty of finding the time to acquire it; a hydrographic surveyor must necessarily also be a seaman, and will have a role to fill as a naval officer or alternatively as a harbour master or engineer. Fortunately, it is probably true to say that he can get by if he makes a common-sense appraisal of what he sees of neighbouring land features, especially the run of the valleys or faults. Alternatively, he may use his experience of previous surveys in comparable soundings, and in the fortunate case of the British Naval Surveyor this experience may be of world-wide extent.
He will seldom have found gradients under water to match those on land because there will have been deposits or sediments brought by currents which will have settled in the valleys and at the foot of cliffs, thus smoothing out the original form of such under water features. He will be alive to the effect of tidal streams elongating and maintaining the general shape of sandbanks and the deep channels between them. He is also likely to have encountered coral formation and be able to learn what to expect of them from a study of neighbouring areas.
If precise figures for gradients under water are sought, knowledge seems to be incomplete. In the case of unconsolidated material, the angle of rest may be as little as 5° or as much as 15° depending on whether it is mud, sand, gravel or shingle. If there is clay, gradients may increase to 30° although the latter is not commonly met. Bare rock is encountered comparatively seldom, but when it is, there will be no rules. Canyons with sides nearly vertical or with slopes of at least 60° and a smooth floor running down into deeper water may have held no sediment over the years and thus remain true to original shape. So do steep rocky shores or off-lying rocks, more especially when strong tidal streams keep them washed clean of sediment. Coral atolls in the later centuries of their growth may give gradients near the surface as steep as 40° to 45°, and this gradient may apply to submerged coral heads that are found standing solitarily within the 50 fathom line, meaning that their bases will be of comparatively small extent.
On the one hand then, slopes up to 30° will seem less than might be expected and on the other, coral heads and rocky outcrops present a special problem. In the case of the latter, however, their probable presence may often be suspected. Moreover, rocky formations at any appreciable height above the sea floor, are likely to be part of a large feature with slopes of 15° to 20° up to a summit above which there may be outcrops protruding for a few additional feet. Such features are most likely to be ridges having considerable length extending seawards perhaps from an above water headland, and an example is St David’s Head in Pembrokeshire which runs out to the Smalls and beyond. Indeed, along this line there is a recent report of an under-water feature which was not found in the previous survey. That survey, however, was nearly 100 years ago and by modem standards would be dubbed as exploratory.
If exceptional cases of needle rocks rising to the surface were to be quoted, there would be Cook Rock in the deep waters of Cook Strait between the North and South islands of New Zealand; Avocet Rock standing in 40 fathoms in the Southern Red Sea; and on the extension of the Peninsula south of Reykjavik in Iceland where the above-water islets are spectacularly sheer, there is a rock found during the last war by a ship which passed so close that the return from the weak sideways transmissions of the echo machine showed more strongly than that from the transmissions directed downwards. Its top is about the size of a card table and it is 11 feet below the surface. Its sides are sheer for at least JOO feet, and thereafter the gradients are very steep for another 80 feet to the sea floor. The venomous picture is completed by the fact that, rather exceptionally, no tide rips, breakers or discoloration betray its presence. However, such rocks provide particularly good Asdic targets and Asdics are being used with very good effect on a current survey off the Borneo Coast where many coral heads are being found.
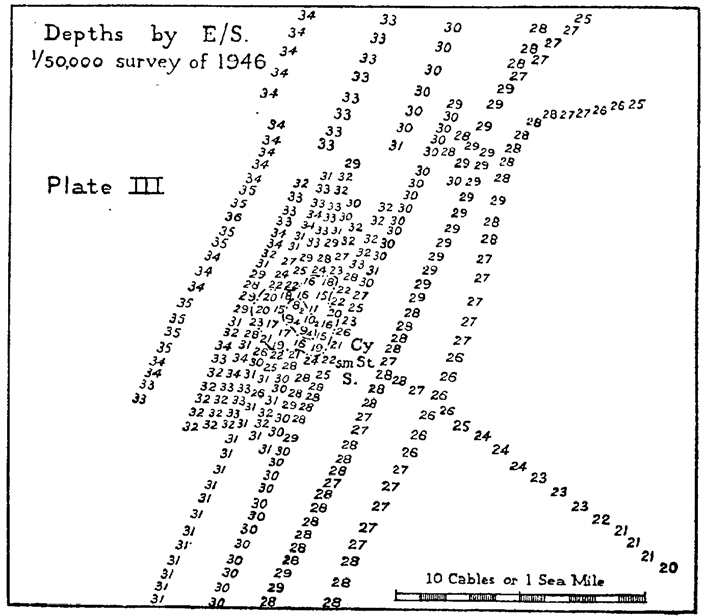
Having shown reasons why under-water features may, on account of their gradients and shapes as well as their geological likelihood’, be less difficult to find than might be supposed, attention is drawn to the illustration in Plates I to III (Fig. 1–3) of a shoal which is totally unexpected geologically and is circular rather than part of a ridge.
Plate I (Fig. 1) shows the method of covering an area by parallel lines of soundings. It will be seen how a spacing of five to the inch became four to the inch, and finally, two to the inch as the depths increase. This will have been on the principle that a feature rising to a dangerous height will be wider at its base as the general depth of the sea floor increases. In those days, sounding up to 18 fathoms was done by a mechanical contrivance for heaving an especially heavy lead so that it was let go forward and the depth line read aft when it came up and down, but the ship’s speed had to be greatly reduced. In deeper water there was nothing for it but to stop the ship, and this will have been necessary for every one of the spaced-out depths on Plate I (Fig. 1). Nowadays echo sounding, first adopted in 1928, gives a continuous record of depth at high speed, and a closer spacing of lines in deeper water is practicable.
Although no example of it is shown, it will be opportune to add here that additional lines are run whenever the presence of a feature is suspected. It is customary first to run one interline and, at half the standard interval of 0.2”, it is possible to show legibly the additional soundings obtained. Thereafter, if the interval is again halved, there is room to plot the ship’s track, but depth figures can only be inserted at the expense of previous observations. A further point is that lines of soundings are always oriented so that the general direction of the fathom lines is crossed at right angles and thereby there is less chance of missing the ridge formations which are so commonly encountered.
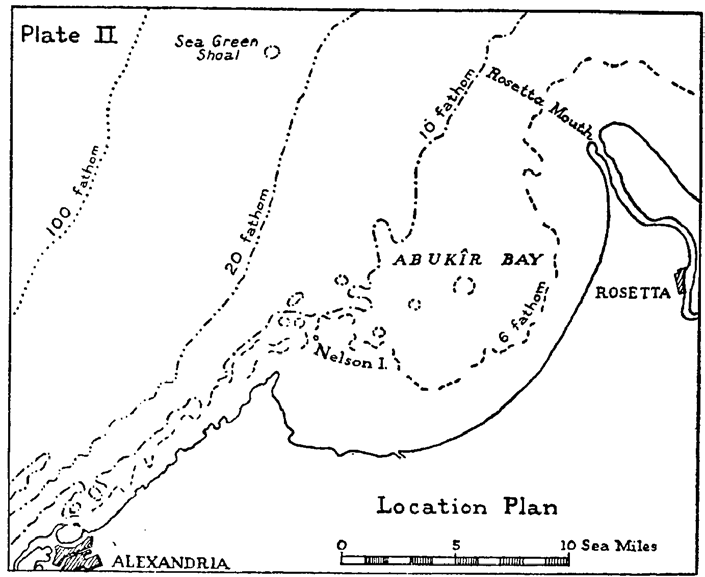
Plate II (Fig. 2) shows the location of Sea Green Shoal which was reported by a minesweeper fouling her sweeps on it during the war, and which was made the object of an investigation when an opportunity arose in 1946. Using echo sounding, a shoal was quickly found and indeed with the sun high up behind the observer, it could be seen at a distance of a quarter of a mile because of a green discoloration of the blue sea, hence the name. It was half a mile in diameter at its base and rose 120 feet to a rounded top, a tenth of a mile across at a depth of 50 feet below the surface. There is no geological reason for a shoal in such a position as for example there might be along the extension of the promontory on which Nelson Island stands, as shown in Plate II (Fig. 2). It accordingly smacks of being wise after the event to draw attention to the seaward of two soundings of 30 fathoms shown in Plate I (Fig. 1) to lie on the edge of the shoal area as shaded in from Plate II (Fig. 2). This sounding would have been 35 fathoms had the slope seawards been uninterrupted, and it may be said with some certainty that had echo sounding been in use in 1920, its continuous trace would have given sufficient indication of a feature to cause its discovery by an interline. Quite probably the trace would in addition have shown the harder material of the shoal extending under the softer mud of the sea floor round its base, thereby demonstrating another advantage of echo sounding.
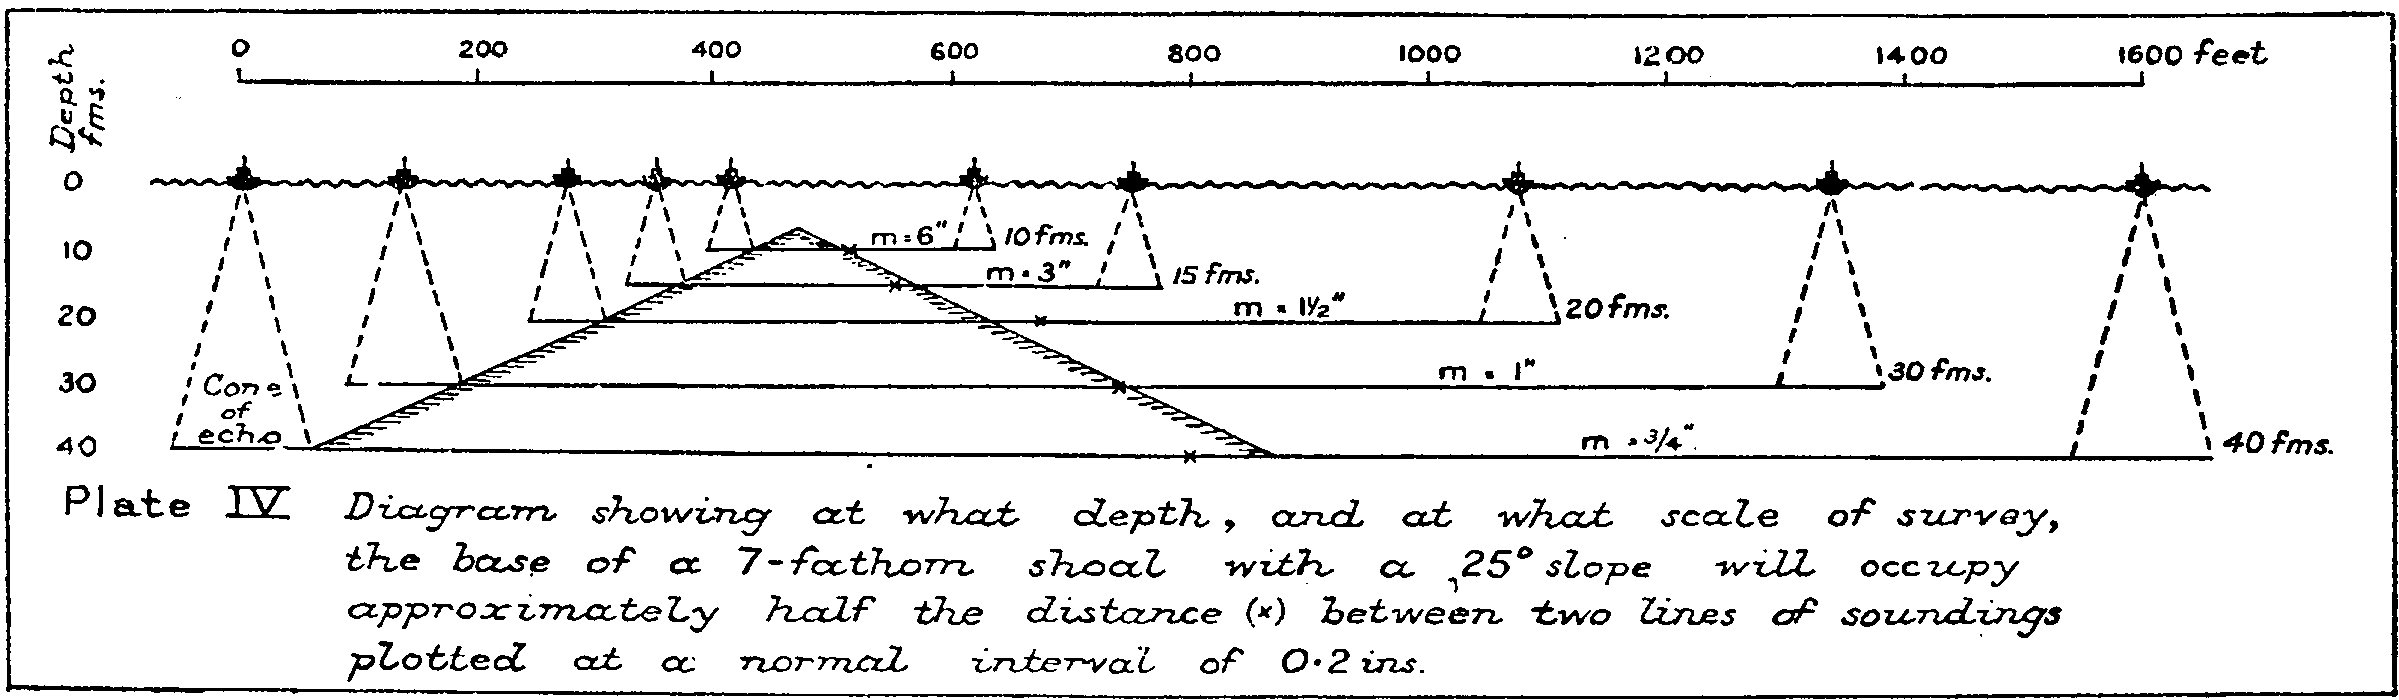
Using standard methods on a scale of 1/100,000, therefore, an indication of Sea Green Shoal was obtained. That shoal had slopes of only 10°, whereas 25° may be encountered, and accordingly on Plate IV (Fig. 4), an illustration in elevation to show the efficiencies of different survey scales, a shoal with 25° slopes and a least depth of 42 feet has been used.
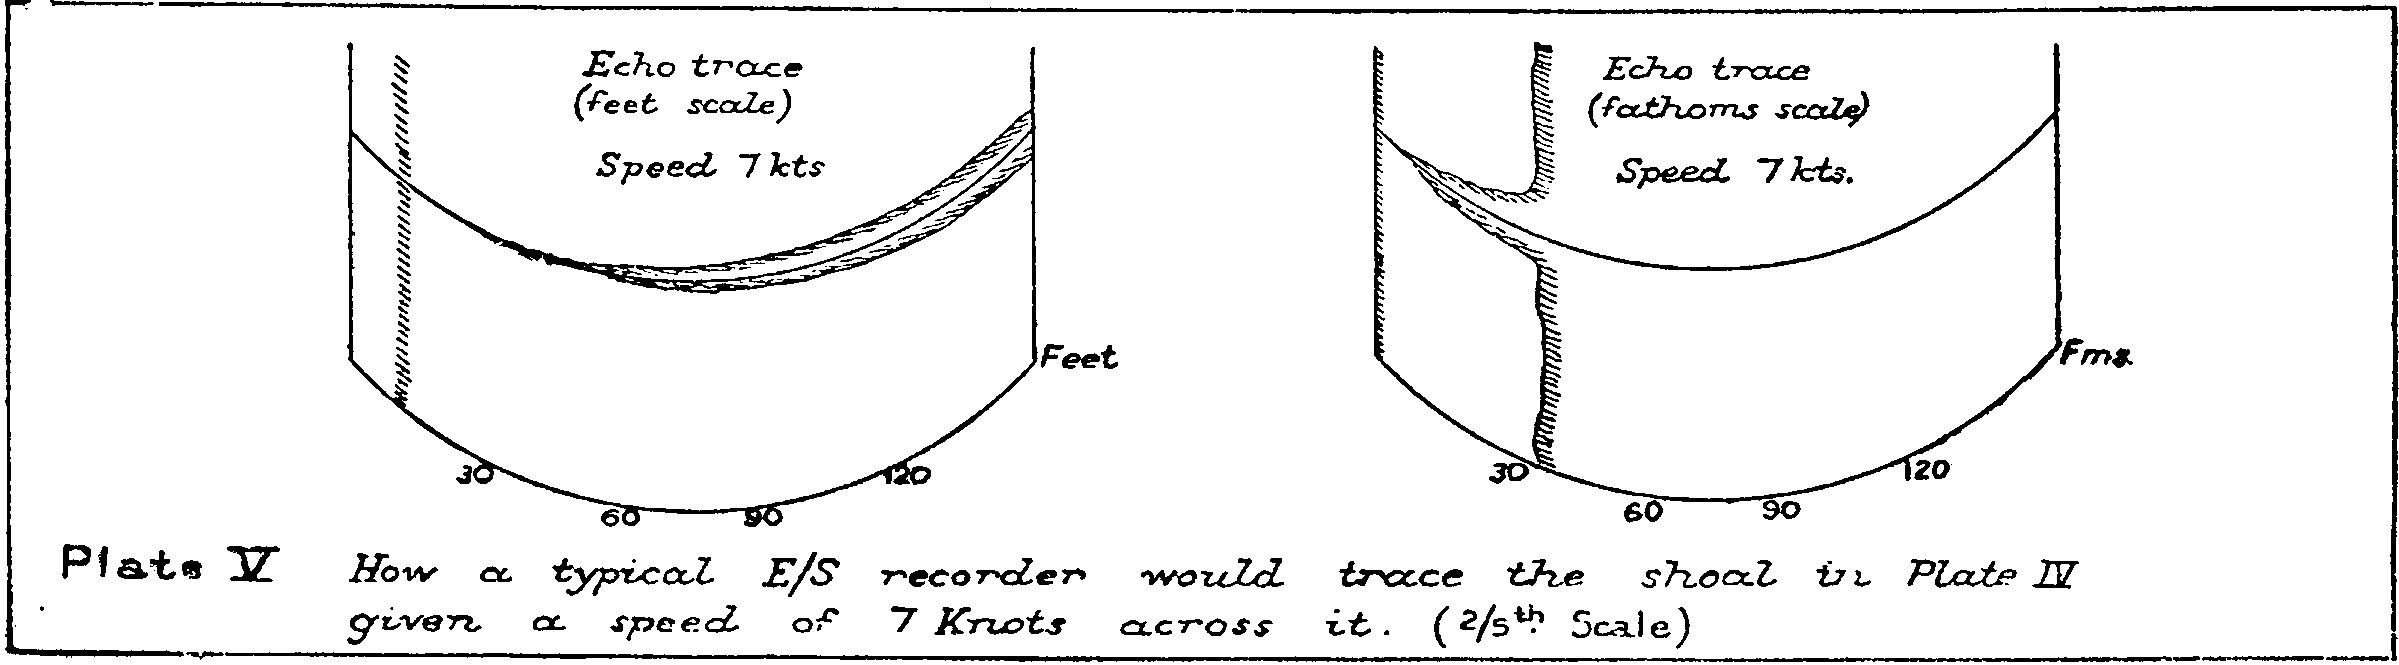
The illustration draws attention to the cone into which the echo transmissions are focussed, so that a line of echo soundings is advantageously a great deal wider than the base of the superseded soundings lead, which was but a few inches across. The advantage is however lessened in deeper water when the cone tends to become pear-shaped. Plate V (Fig. 5) has been added to show that the echo trace can be misleading to the uninitiated in its distortion of the slope, and indeed the writer had not formerly appreciated the extent of the distortion.
In studying Plate IV (Fig. 4) it must be remembered that shoals are more likely to be ridged than circular; that interlines at 0.1” intervals are run in suspect areas; that there are considerable odds against a shoal lying exactly between lines of soundings; and that 25° is a steep slope.
It will be seen, however, that in areas where the sea floor is less than 10 to 12 fathoms down, something quite small rising only, as one might say, a handful of feet off the bottom, can be of importance and likely to escape notice under ordinary methods. If they are infrequent. Asdics find them, but if the floor is generally rugged, Asdics will be insufficiently discriminating. Then, recourse is had to sweeping or dragging a horizontally stretched wire across the area. This is a laborious business, costly in time, and is only used for such a purpose along a channel which valuable ships must navigate with but little water under their keels.
Having mentioned costs – and time is money – they can at once be dismissed with the accepted conclusion that since scamped work cannot be checked and may lead to disaster, surveys must not be costed at so much a mile, and a hydrographic surveyor’s promotion must not be directly related to the number of square miles he covers. Experience shows that there is more than enough incentive to get results, and it is more likely that one of the responsibilities and’ anxieties of the surveyor in charge will be to ensure thoroughness.
Nevertheless there are opportunities to save time at the other extreme of surveys; i.e., those covering smooth estuarial sea floors, which moreover may be subject to rapid changes. The Edinburgh Channel is an example and is at present being surveyed twice a year. Because it is narrow, the chart is on a scale of 1/12,500 and so the survey must be to that scale, although 1/24,000 would suffice to delineate the sandbanks. In such case the lines may be run at double the normal interval.
Reverting to the general from the particular, it can be held that surveys of 3” to the mile and larger scales will, in the majority of cases, teach all that matters navigationally about the sea floor by ordinary methods and will be executed to meet a need for a chart of a harbour or its approaches.
Choosing the scale, therefore, becomes the greatest problem in the case of coastal surveys which may have to extend many miles to seaward in order to include the 100 fathom line. There is an immense amount to be done if the old lead line surveys are to be replaced, as they should be, and if sparsely sounded areas are to be covered. The smaller the scale the quicker will the work be done, but the purpose of the survey must be satisfied. In a task of such magnitude priorities must be taken into account, and first will come the safety of shipping wherever it may reasonably expect to navigate. Sometimes it will be economical to include the inshore areas or the shallower parts through which in fact the survey may find safe routes. A t other times, when such secondary areas have been covered by a previous lead line survey, those results may be allowed to suffice for the time being. Taking all things into consideration a scale of 1/72,000 seems most suitable and anything smaller is likely to be inadequate. But if charts on a larger scale than 1” to 1 mile are a navigational requirement, it will usually be wise to go to a yet larger scale for the survey, and especially so in rockbound or coral waters, in order to be sure of matching up to the confidence which users of all kinds will place on the large-scale chart.
And so, references to the chart conclude, as they began, this discussion of scales of surveys, but it is necessary to bring in the surveyor once more, particularly the surveyor-in-charge. He accepts responsibility for the results of his survey. He must have latitude to enlarge the scale which has been ordered should he think it necessary, or report if this is deliberately not done for some reason that he will advance. Alternatively he may open out the lines to save time whenever it can safely be done. If he employs Asdics he has to assess the degree of reliability basing it on the operating conditions and the type of target.
On the surveyor’s reports the chart maker is ready to insert explanatory notes for the benefit of the chart users. Chart users are advised in various ways and places how to assess a chart and stress is laid on the date of the survey quoted in its title. This is sound but it increases the responsibility of the chart maker as advised by the surveyor to say so, when, for example, an insufficiently large scale has been used for parts of a modern survey on which the modern chart is based. Captions are then used, as «Unexamined», «Less water may be encountered», etc. On the other hand, a chart may show an important channel through dangerous waters which has been surveyed on a larger scale than that of the chart, and also perhaps than that used for surveying the surrounding waters. In such a case, and there is an example in recent surveys and charts of the Persian Gulf, then an appropriate caption will rightly increase the confidence of the mariner.
Mariners must see a good deal of evidence of out-of-date surveys on their charts, but they may take comfort from the care and devotion brought to their task by the surveyors of the last century. Their soundings were sparse so that their work would be classed as exploratory by modern standards, but their keen powers of observation, supported by masthead lookouts and the cross-examination of local seamen has meant that, on the many coasts they covered, they missed but few shoals dangerous to surface navigation.
My tribute to them I will follow up with my thanks to all those, mostly in the Hydrographic Department, who have helped me in the preparation of this Paper.