


Abstract
1 Introduction
The properties of light are extraordinary. It oscillates about 1014 times per second – that is about one oscillation every micrometer while propagating at approximately 300,000 km/s. As resolution and wavelength are fundamentally linked together, these light properties offer outstanding performance when it comes to geometrical measurements. Therefore, light has become a working horse for acquiring geospatial data: e.g., laser scanners, tachymeters, and laser trackers all owe their capabilities to the properties of light. This is at least true in the terrestrial domain. However, the underwater environment poses challenges for using light waves for acquiring bathymetric data, that increases with depth. Water is an excellent absorber for most electromagnetic waves and natural water bodies are often mixed with scattering particles rendering the water turbid. Consequently, sonar-based systems are predominantly used for measurements in the subsea environment as acoustic waves are less affected than light by floating particles, with much less absorption and scattering. Measurement ranges exceeding many kilometers are easily achievable by acoustic waves. But there are numerous situations and tasks where sonar systems fail to provide sufficient performance or practicability. For example, when high resolution and precision is key, e.g., for underwater infrastructure inspection. Or when mapping very shallow waters which are inaccessible for sonar survey vessels. This is especially true in areas such as offshore wind energy, the oil and gas industry, coastal mapping, and port security. However, these applications are becoming increasingly important. Rising sea levels will alter coastal topography and already start to pose a potential hazard to coastal residents due to increased flood risk (IPCC, 2022). Accurate bathymetric data can help track these changes, thus aiding in understanding and mitigating their consequences.
At Fraunhofer IPM (Freiburg, Germany), we have a long history of designing and building laser-based measurement systems that address numerous terrestrial mobile mapping demands. We now aim to build a platform that also widely establishes laser-based measurements in the underwater world. This is achieved by specially adapting laser scanners for the rough and challenging underwater conditions. The goal is to create a technological toolkit that forms the foundation for building specific, customized measurement systems for several use cases. In this regard, a compact design to enable the systems to be easily deployed without significant technical barriers is of particular importance.
We have designed and built two demonstrators, that we introduce here. The first one is a very compact and lightweight UAV (Unmanned Aerial Vehicle)-borne bathymetry scanner for shallow waters. The second one is a laser scanner designed for direct underwater application, addressing the inspection and measurement of technical underwater infrastructure with its high resolution.
2 Background
The biggest challenge in optical underwater measurements is the absorption and scattering of light by water and particles suspended in it. Underwater imaging, in particular, is highly sensitive to these factors. Especially when combined with active illumination. Scattering from floating particles can quickly lead to camera glare, and even with increased illumination, higher working range cannot be achieved. Therefore, common measurement principles of existing laser scanners cannot be directly applied in the underwater environment. For example, many terrestrial laser scanners use high-frequency intensity modulated light to determine distance from phase information. However, scattering leads to mixed phases, rendering measurement impossible. Additionally, terrestria LiDAR systems often use infrared light, which offers several advantages due to availability of detector and lasers, and laser safety regulations. However, water has a very limited spectral transparency window. Only the blue-green spectral region is sufficiently transparent with absorption coefficients of less than 0.1 m-1. To accommodate these challenges and still achieve good measurement performance, we employ a pulsed Time-of-Flight (ToF) method, which is also used in many large airborne laser bathymetry systems (Leica, 2022a) and recently also in some more compact UAV-carried systems (RIEGL, 2023). Fig. 1 gives an illustration of this measurement principle.
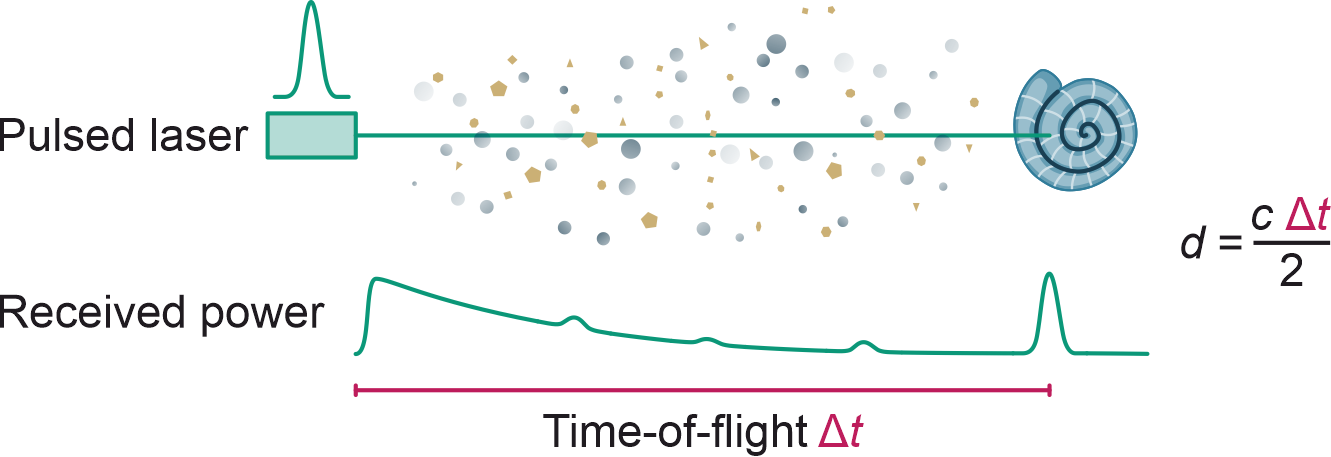
A laser emits short light pulses that propagate at the speed of light c and may hit an object, from which they are then backscattered. A fast detector records the full signal waveform of the received power of the backscattered light. From the round-trip time Δt between sending and receiving the light pulse, one can easily calculate the object distance d. In addition to the actual backscattered light-pulse from the object, there is also scattering caused by the water column and particulate matter. This unwanted stray light typically decays exponentially with increasing distance and would cause a regular camera to be blinded. An object further away as in the illustrated example would be masked by the stray light. In the presented devices, however, we capture the complete time-resolved signal. The individual signal contributions can thus still be separated from each other. This allows us to detect objects which would normally be hidden behind the stray cloud and achieve measurement ranges that significantly exceed the visibility range.
Of course, while this approach can increase the detection range, it cannot be extended indefinitely. Light extinction (which is the combined effect of absorption and scattering) is usually the limiting factor. To gain an intuition for this limitation, the received power Preceived can be estimated using the following approximation which accounts for geometric losses and extinction losses:
| (1) |
Preceived depends on the emitted laser light power Pemitted, the target albedo ρ, the aperture radius of the receiving lens rlens, the extinction coefficient µ of the water, the target distance d0 and the distance between sensor and water surface do . The distance d0 is only relevant for airborne sensors where there is a gap between sensor and water surface. For an underwater scanner it can be set to zero.
It is evident from this approximation that only three parameters (Pemitted, rlens and d0) can be optimized to increase the received power as water turbidity and albedo usually cannot be altered. If we isolate the distance dependent part
| (2) |
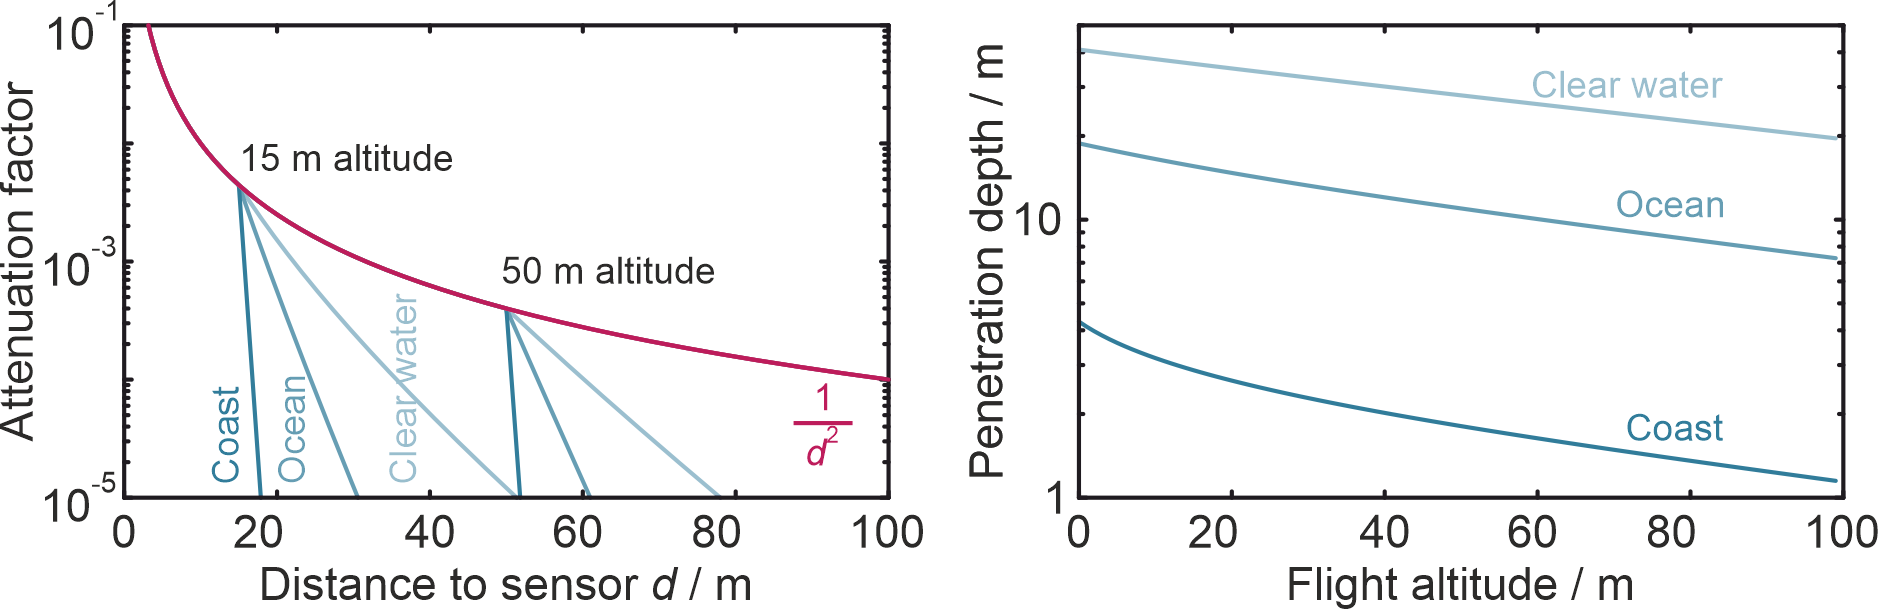
of the approximation formula and interpret it as an attenuation factor which tells us how much light power is lost during the propagation path of the light pulse, we can calculate this factor for different scenarios (see Fig. 2 left). In these scenarios, coastal water is assumed to have an extinction coefficient of 1.0 m-1, ocean water 0.15 m-1 and clear water 0.05 m-1. Using a common conversion relation (ISO, 2019), the visibility range equals 1.7/µ. The scenarios therefore correspond to 1.7 m, 11.3 m, and 34 m visibility range, respectively. The shown attenuation factor spans four orders of magnitude and goes down to 10-5 which can serve as a rough estimate for a detection threshold of our compact airborne bathymetric system. Of course, this threshold can vary significantly depending on the actual scanner implementation, but the fundamental relations hold true. For all scenarios it is obvious that as soon as the light passes the water surface, the extinction is the dominant loss mechanism. Fig. 2 (right) shows this water penetration depth for the scenarios. Although the extinction due to absorption and scattering is dominating, the flight altitude still has a major impact: In case of ocean water, the estimated measurement range drops from 19 m for a submerged sensor to 15 m for a sensor at 20 m altitude and further down to only 7 m when flying at 100 m.
To illustrate what this means in terms of absolute received power, let us assume realistic values for a compact device: 1000 W peak optical power, 25 mm lens radius, and 5 % target albedo. With an attenuation factor of 10-5, the received power is approximately 313 nW. With a pulse duration of one nanosecond, this corresponds to less than 1,000 photons. For comparison, a green light pulse with 1 µJ pulse energy contains about 300 billion photons.
Another aspect that can limit the performance is ambient light, especially from the sun. The solar power received by the detector Pambient can be estimated using the following relation:
| (3) |
Hereby, the relevant solar irradiance Esolar depends on the spectral sensitivity range of the receiver. The spectral solar irradiance on the earth reaches values of up to 1.3 W/m2/nm in the blue-green spectral region (Pope and Fry, 1997). The active detector area (radius rdetector) and the focal length f of the receiving lens define the acceptance angle of the sensor. For small opening angles the ratio rlens/f equals the light acceptance angle in radians. It must be larger than the beam divergence of the measurement laser beam to completely capture the emitted light. A value of 6 mrad is not uncommon for bathymetric scanners. Further assuming 30 nm spectral sensitivity window and a bright surface with 50 % albedo, we can estimate a received ambient power of 1.4 µW. Which is well above the aforementioned minimal signal power. Fortunately, through clever optical design, such as limiting the spectral detection bandwidth and reducing the laser beam divergence, it is possible to significantly reduce the solar influence.
3 System design
A key consideration in the construction and design of our measurement systems is the platform concept. The sensors should be adaptable for many use cases. This affects factors like the type of lasers used, which may vary in pulse energy, pulse duration, and repetition rate, as well as the beam steering units, which may need different configurations depending on the application. At its core, this approach relies on a highly flexible and capable custom-made electronic foundation. The electronic block diagram which is almost constant across our systems is depicted in Fig. 3. An essential centerpiece is a multi-channel radio-frequency analog-to-digital converter (RF-ADC) which samples and digitizes the full analog waveforms of the optical receiver at 5 Giga Sample per Second (GSPS) sample rate. A powerful combined CPU/FPGA (Central Processing Unit, Field Programmable Gate Array) chip processes the signals and can store the raw data on an SSD (solid state drive). The processing unit also controls numerous auxiliary tasks such as motors, switches, Wi-Fi-interfaces, and shutters. It provides ethernet interfaces for data and command transfer as well as synchronization interfaces like NMEA 0183, PPS (Pulse Per Second) and PTP (Precision Time Protocol) which are commonly used in satellite-based positioning solutions. A major part of the processing unit is left unoccupied and is reserved for use-case specific processing needs which could also be implemented by the end user to enable real-time processing capabilities. E.g., steering an autonomous underwater vehicle could require such live information for obstacle avoidance or detection.
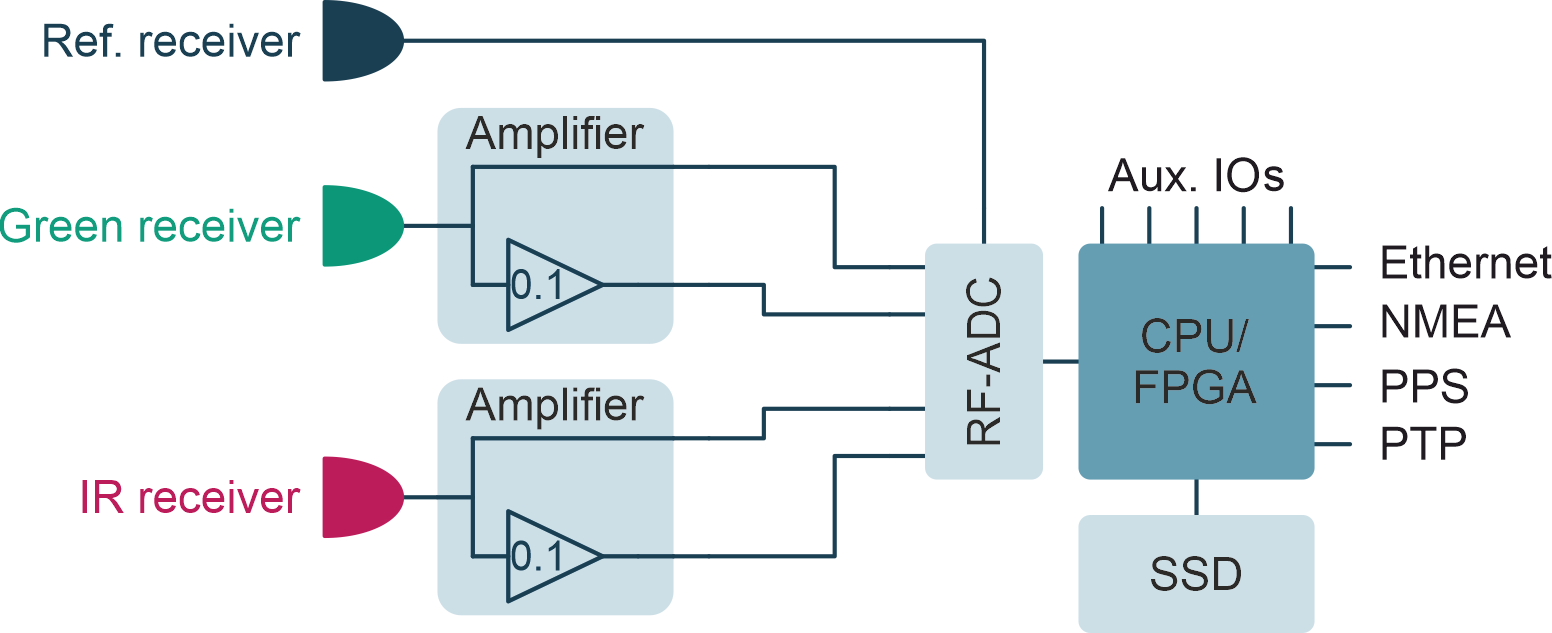
In our systems, we use up to three individual optical receiver units. One receiver serves as an internal reference which records the laser pulse shape before the light exits the housing. It defines the “start” point for the time-of-flight measurement. Also, it allows us to employ free-running lasers which cannot be actively triggered. The other two optical receivers are intended to detect the actual measurement light. To again address multiple use-cases, we have designed multiple receivers with matching interfaces. They are all based on either avalanche photodiodes (APDs) or photomultiplier tubes (PMTs). Each receiver comes with a closely integrated amplifier circuit that provides two different amplification stages on two channels. Each channel is then connected two the RF-ADC and digitized. This serves the purpose to maximize the useable dynamic range beyond the capabilities of the bare ADC. Especially for topographic-bathymetric measurements where the topographic signal amplitudes can be many orders of magnitudes larger than bathymetric ones benefit from such a design.
To achieve precise measurements, timing and clocking stability is paramount. Therefore, great care has been taken to provide the RF-ADC with a stable clocking source with minimal jitter. All three channels have been carefully designed to maintain a precise and constant inter-channel synchronization. For reference, to achieve one millimeter precision, a timing accuracy of only 6.7 picoseconds is necessary.
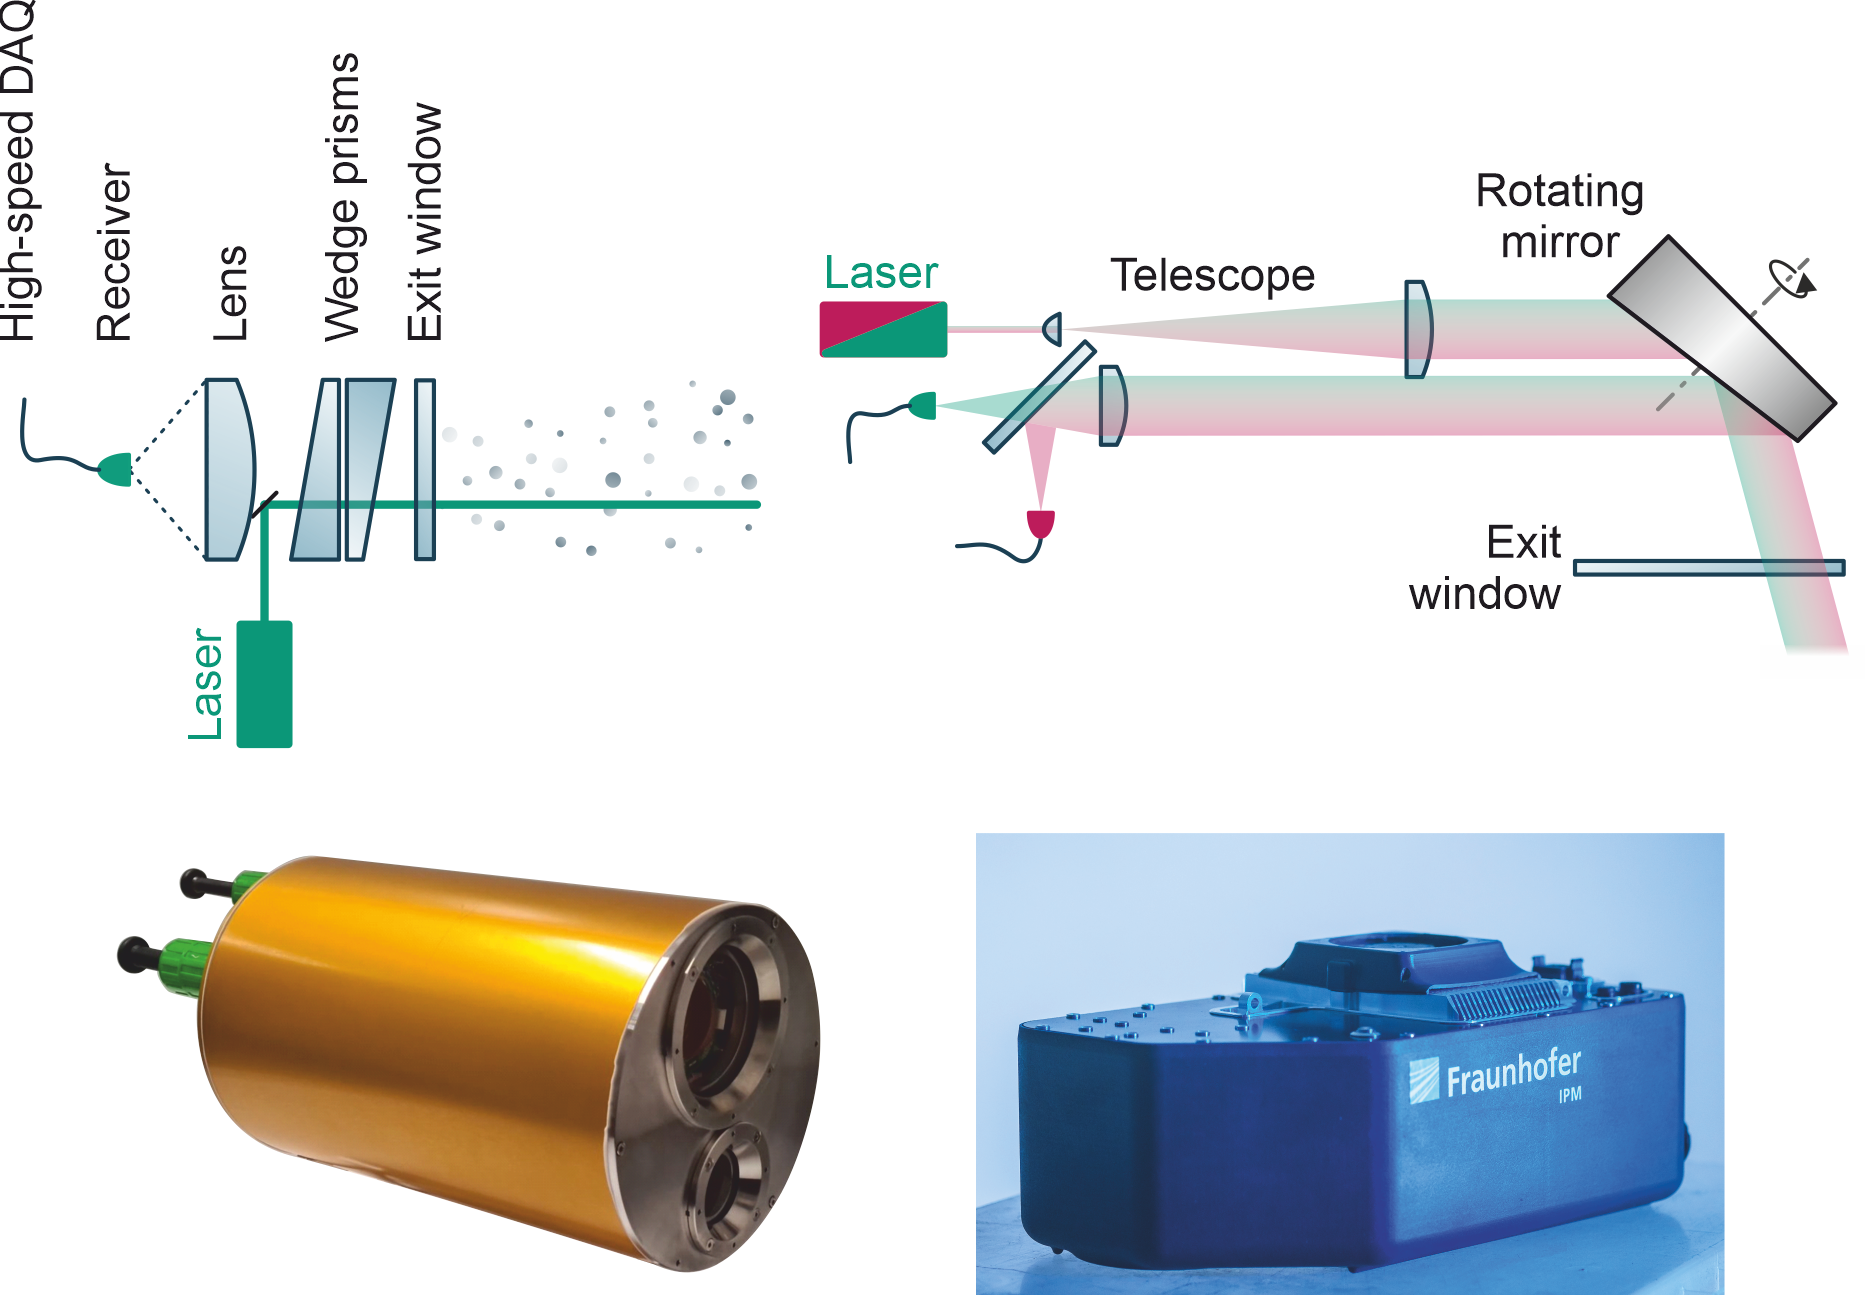
This electronic framework was used to build the two practical sensor prototypes, shown in Fig. 4.
The Underwater LiDAR (ULi) system is designed for measurements below the water surface. The system is housed in a pressure-resistant aluminum enclosure. As illustrated, a single APD-based receiver is used in the optical setup. From our experience, APDs achieve a superior transition time stability, which affects the achievable precision, compared to PMT designs. Additionally, the overexposure tolerance is better. This aligns better with the intended inspection use-case of this device where a high precision is required. A pulsed laser emits approximately 2 ns long light pulses in the green spectral region with a repetition rate of 40 kHz. In newer designs, we incorporate a laser with a shorter pulse duration and higher repetition rate. Two custom build rotating wedge prisms, commonly known as Risley prism pairs, act as a beam deflector. They combine a large clear aperture of 4.5 cm with a decent full scan angle of 44° (in water) and a very compact footprint as they can be aligned on axis with the laser beam. But their major benefit is the ability to configure the scan pattern from line-shaped to circular. This two-dimensional beam deflection also allows to capture the full scan area without moving the device. The desired lateral resolution can be adjusted over a wide range by adapting the motor speeds or speed differentials. This allows the creation of highly detailed point clouds with an acquisition time on the order of one minute. If only a coarse grid is needed, it can be achieved in just a few seconds. This accommodates use-case scenarios where the scanner is operated stationary on a tripod as well as mobile deployment on a ROV (Remotely Operated Vehicle). The motors achieve a rotation rate of up to 25 Hz. The final device has a circular diameter of 22 cm and approximately 38 cm in length. It is rated for up to 300 m depth and weighs about 18.5 kg (in air). A sapphire window provides a scratch resistant optical interface.
The second device, the Airborne Bathymetric Scanner (ABS), is a very compact sensor for topographic and bathymetric measurements while being carried from an UAV. A distinct feature of this device is the simultaneous operation with green and infrared light which is unique for such compact systems. As infrared light gets highly absorbed by water, it is intended to provide a precise water surface estimation. Further, vegetation also offers a unique spectral reflectivity change between green and infrared light which can aid in the automatic segmentation and detection of vegetation in near coastal areas. The scanner uses a Nd:YAG laser as a light source with 35 kHz repetition rate. The fundamental emission wavelength of these lasers is 1064 nm, which is infrared light. A special crystal inside the laser converts the wavelength to 532 nm, which is green light. Normally, a filter blocks the remaining infrared portion of the light. But our laser is modified to emit both waves simultaneously. As both waves are generated through the same laser process, their pulses align near perfectly in space and in time. This means that the infrared and the green pulse basically hit the exact same position on the target at the same time. For laser safety (DIN, 2015) reasons, our scanner uses a measurement beam diameter of about 5 cm, which is achieved by expanding the laser beam via a telescope. This telescope is designed to minimize chromatic aberrations so that both beams coincide. It is further aligned to collimate the measurement beam. This means that the beam divergence is close to zero and the laser footprint on the ground is constant over the whole measurement range unlike most other systems which provides a superior resolution. Of course, the collimated beam and compact design come at the price of reduced laser energy as the light power only spreads across a smaller area, limiting the allowable pulse energy. This can be partially compensated by reducing the receiving optics acceptance angle (see reasoning in the Background chapter) which reduces the ambient light influence and choosing a lower flight altitude between 15 m and 50 m.
On the receiving side of the ABS, two detectors are used which are separated by a dichroic mirror. For the green light a PMT-based receiver is selected. It provides a better intrinsic gain and sensitivity. The better measurement precision we achieve with the APD sensors can be neglected in UAV-borne bathymetric measurements as waves and GNSS-positioning are limiting the achievable performance anyhow. For the infrared channel, an APD is used due to the lack of infrared light sensitive PMTs. For beam deflection, a rotating mirror with a 7.5° tilted surface is used. This Palmer scanner creates a downward facing elliptical scan pattern with a maximal opening angle of 30° (15° off-nadir). It achieves 50 Hz rotation speed. Since a full ellipse is captured with each rotation, this corresponds to 100 cross-profiles per second. With a typical UAV flight speed of 5 m/s, the profile spacing is approximately 5 cm, which is roughly equivalent to the laser footprint. At a flight altitude of twenty meters, the captured strip width is approximately ten meters. Consequently, with each rotation, about 30 meters of profile length are scanned. At a pulse rate of 35 kHz, this corresponds to a point spacing of approximately 4.5 cm, which again is roughly equivalent to the laser footprint. With these settings, a very homogeneous point distribution on the ground can be achieved, effectively utilizing the high resolution which is possible through the small and constant beam diameter.
The final bare device weighs 2.5 kg without battery and without GNSS/IMU (Global Navigation Satellite System/Inertial Measurement Unit). This allows it to be easily carried by UAVs with less than 25 kg takeoff mass which are less restricted by avionic regulations (EU, 2019).
4 Results
4.1 ABS – Airborne Bathymetric System
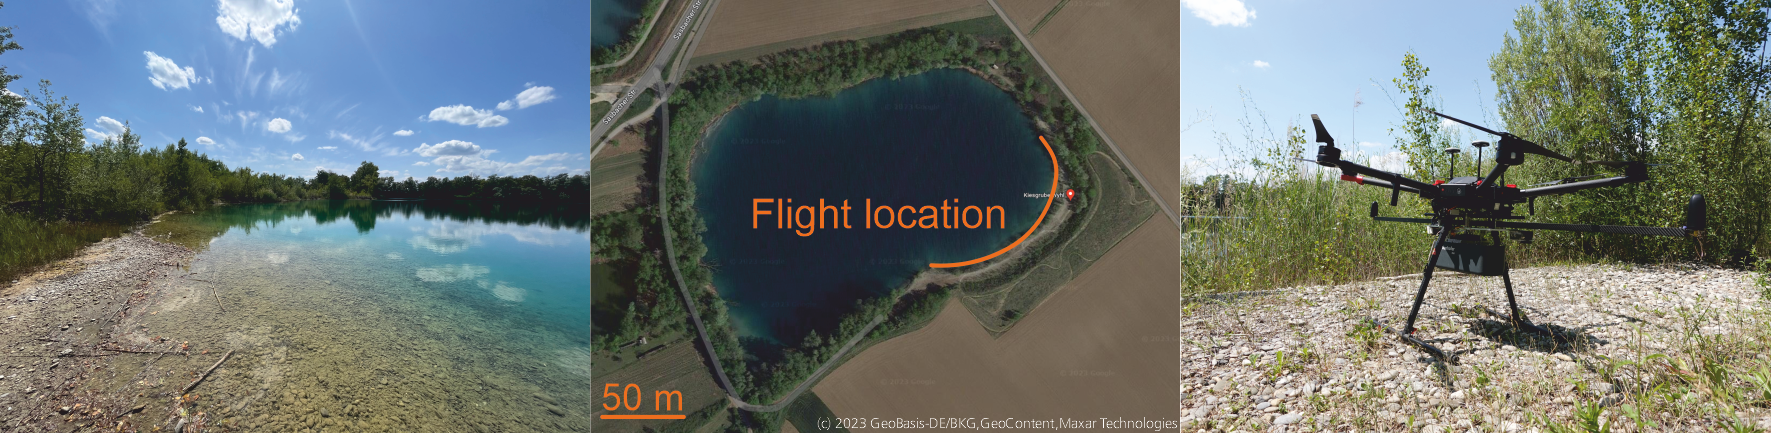
The first test flights with the bathymetry scanner were conducted near our institute. We selected a disused excavation pond in Wyhl am Kaiserstuhl (Lat: 48.154N, Lon: 7.640E). Fig. 5 shows a photograph of the surveyed area, as well as a satellite image indicating the approximate flight route. Since the local conditions were still unknown, the UAV was manually controlled. The flight altitude varied between 10 meters and 30 meters above the ground, with most of the recorded data occurring at 30 meters altitude.
A UAV from DJI (Matrice M600 Pro) served as the carrier platform. The mounted scanner is also depicted in Fig. 5. For georeferencing and flight trajectory recording, the scanner was connected to a GNSS/ IMU positioning system from Trimble (APX-18 UAV), which was mounted externally to the scanner. This system includes a two-channel GNSS receiver. Two helix antennas were mounted with approximately 1.6 meters of separation from each other, positioned perpendicular to the flight direction. The precise flight trajectory was calculated in post-processing using GNSS correction data from SAPOS.
All raw data has been stored on the internal memory and has been post processed using our proprietary software. Prior to the flight, a calibration measurement was conducted on reference surfaces. A specialized optimization algorithm can then automatically determine all relevant geometric parameters from these measurements. These parameters are subsequently used in a ray-tracing model to precisely determine the beam direction. The parameters to transform the scanner reference frame to the GNSS/IMU reference frame were initially taken from the design values. Residual errors are then evident in the resulting point cloud as duplicates in areas that were acquired multiple times with different UAV orientations. We have adjusted the transformation parameters to minimize these duplicates and consequently obtain a good scanner-to-GNSS/IMU calibration. Our data processing algorithm filters the raw data using the expected pulse shape and then extracts and interpolates the flight time of the laser light pulses. We employ this interpolation to counteract the effects of digitization. By utilizing the known pulse shape, we can estimate the peak position with a resolution superior to the sample spacing offered by the ADC. In this demonstration we have not used any averaging methods which could be used to increase the achievable measurement range. Every point of the point cloud is obtained from a single laser pulse. Along with the ray-tracing model and the flight trajectory, this allows us to calculate the measurement points in georeferenced coordinates. Due to the refraction of light at the water’s surface, the point cloud initially appears distorted, and the bottom may seem deeper than it actually is. To address this, we apply an additional processing step to correct this refraction effect: using the infrared data points, we manually determine the precise position of the water surface and model it as a flat plane. For each measurement point below the water surface, we now determine the intersection point with the modeled water surface and the angle of incidence, thus compensating for the refraction effect. Our objective is to implement an automated approach to identify the water surface using the infrared measurement channel.
The point cloud obtained in this manner is depicted in Fig. 6. The displayed section of the point cloud contains approximately 6.4 million points and represents the result of approximately 3 minutes of net flight time. The flight path was roughly curved and flown in both directions, with the UAV making a 180-degree turn. The flight distance was approximately 2 times 150 meters. The point cloud is color-coded in a false-color representation. Points below the water surface are depicted with a blue gradient, representing the depth below the water surface. All points below the water surface were calculated using the green laser beam. Points above the water surface are colored with a brown-green gradient, also based on the z-coordinate. There is a path around the lake, which is heavily vegetated. The color scale is chosen so that trees appear predominantly green, and the ground appears brown. All the points shown above the water surface are derived from the infrared channel. The green channel also captures points above the water surface, which are geometrically nearly identical to the infrared points. However, for the sake of illustrating the multi-wavelength capability, these points were intentionally removed.
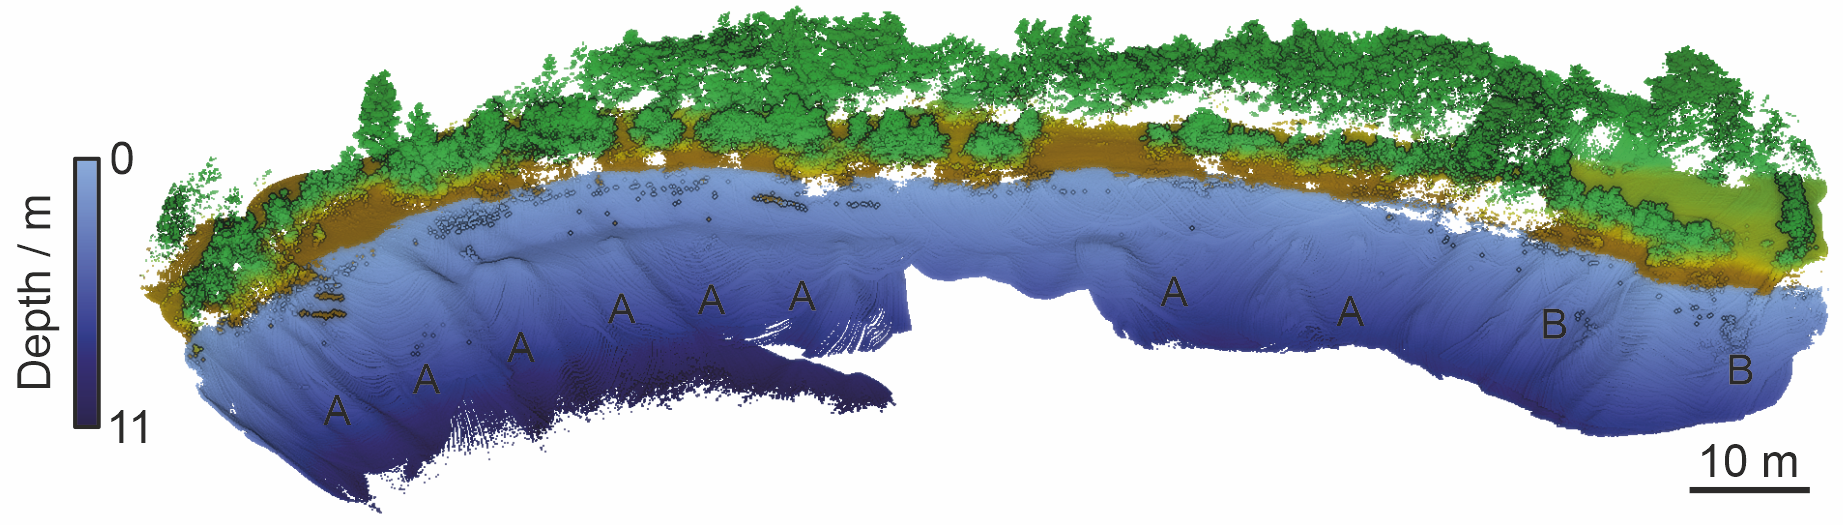
The underwater points provide a high-resolution representation of the bathymetry of the pond. The likely ruts resulting from dredging are clearly visible (labelled A). On the right side, two dead tree stumps can also be identified (labelled B). One limiting factor we observed is the not-yet-perfect calibration between the scanner and GNSS/IMU, which limits the resolution and causes the point cloud to appear somewhat blurred. We were able to reliably extract points up to a depth of approximately 11 meters. While individual points could be obtained beyond that depth, since no coherent surfaces were recognizable, we considered them as outliers.
By analyzing the brightness distribution of some measurement points and their depth, we attempted to derive an extinction coefficient. This method assumes, for example, that the bottom reflects light homogeneously and has no angular dependence, which is not fulfilled under real conditions. Therefore, such an estimation can only serve as a very rough guideline. We obtained an extinction coefficient of approximately 0.25 m-1 to 0.3 m-1. With the conversion visibility equals 1.7/µ, we have a visibility range between 5.5 m and 6.8 m for this excavation pond. The measurement range is thus close to twice the visibility range in this scenario. The extinction value lies in between ocean and coastal water and therefore, the measurement range reasonably aligns with the estimates from Fig. 2.
4.2 ULi – Underwater LiDAR
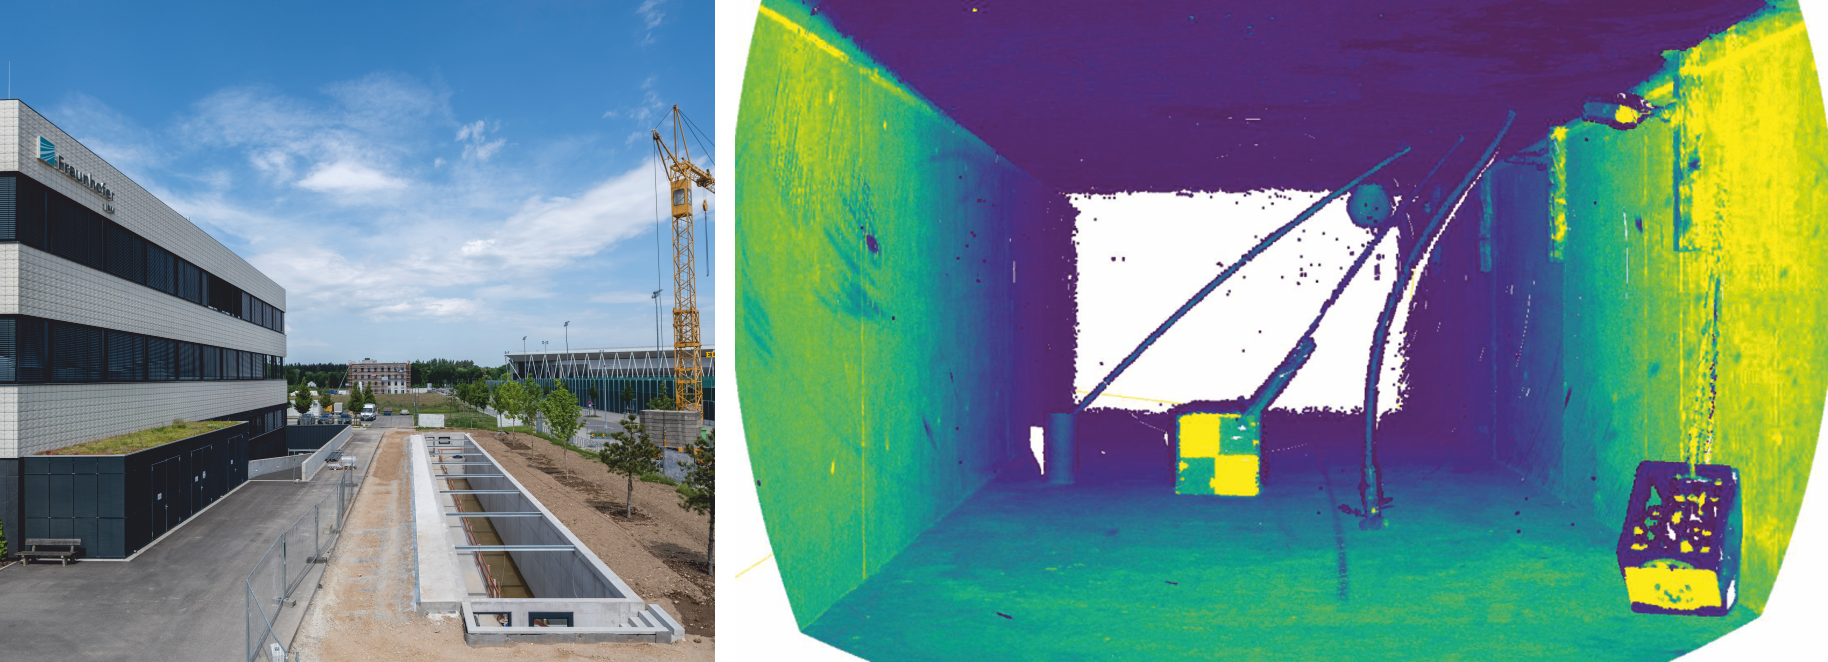
We have not yet been able to test the underwater laser scanner under practical conditions. For testing, we use a specially built underwater test facility at our institute. It is still in the final stages of construction and can be seen in Fig. 7 (left) during the construction phase. This test facility is an approximately 40 m long, 3 m wide, and 2 m deep water basin. It will be equipped with a movable platform for reference measurements. Still during the construction phase, we placed some test objects (beverage crate, checkerboard pattern, sphere, empty pipes, and 160 mm diameter drainage pipe) inside and conducted a static measurement with the ULi scanner, which was placed at the start of the basin about 1 m above the ground.
The resulting point cloud is shown in Fig. 7 (right) with a false-color representation of the received intensity. It has been recorded within approximately two minutes using a spiral scan pattern. We applied a similar data processing pipeline as described before. Also, the scanner has been calibrated with reference measurements and geometrically modelled for a raytracing algorithm. The distance of the test objects ranges from about 5 m (beverage crate) to about 15 m (sphere). All objects are well captured and resolved in high detail. The backside of the basin is not visible as its distance of 40 m is outside the measurement range. Due to the dusty environment around the test facility, a significant amount of dust floated on the water surface, causing the water surface to be detected as a closed layer on top.
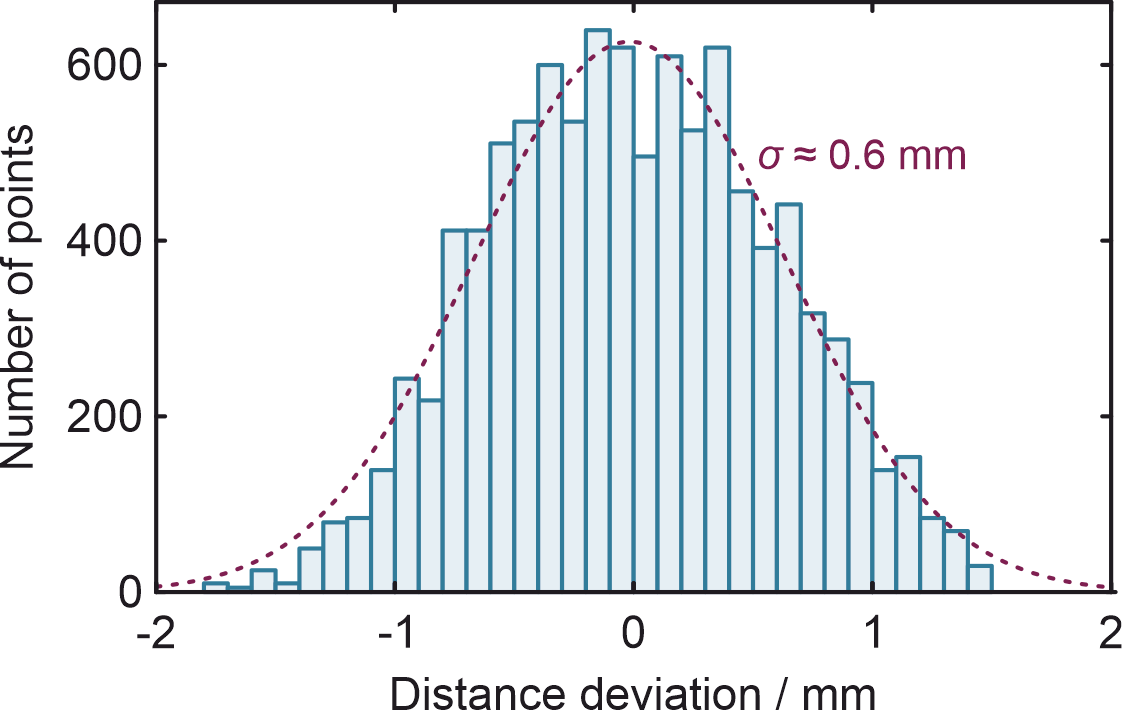
To determine the distance measurement precision, we fitted a plane into one of the bright squares of the checkerboard pattern and determined the signed distances of the points to this plane. This allowed us to create a histogram of the distance deviations (Fig. 8). The standard deviation of the distribution shown is approximately 0.6 mm. If we compare it to the specification of 0.4 mm distance noise of a state-of-the-art terrestrial laser scanner like the Leica RTC360 (Leica, 2022b), it highlights the enormous resolving capability of this underwater scanner.
5 Future work
Up to now, we have tested the prototypes, especially the underwater laser scanner, predominantly in lab settings and not fully specified the performance in real application scenarios. These are the next steps on our agenda. We are also currently revising the underwater scanner to make it significantly more compact and lighter, simplifying field tests and increasing its usability. Another aspect we are currently working on is the data processing software. In particular, to handle the enormous data rates of several hundred megabytes per second, we aim to implement a major portion of the processing directly on the device. This will be a significant improvement for end-users.
6 Conclusion
We have presented a versatile platform for laser based pulsed time-of-flight geometrical measurements in subsea environments. Based on this platform, we showcased two prototypes: a very compact airborne bathymetric system (ABS) and an underwater LiDAR system (ULi). Both systems provide significant strides in capturing high-resolution data from the air and beneath the water. Tests have been conducted at an excavation pond in Wyhl am Kaiserstuhl, Germany, which underscore the precision and versatility of the ABS, revealing many discernable features below the water surface in combination with an underwater measurement range extending beyond 10 m. Similarly, the first test results of the ULi obtained in a controlled environment hint at its high resolving capability, with a demonstrated precision rivaling some of the leading terrestrial scanners.
However, there are still certain challenges to overcome: The processing software requires further refinement and an increased level of automation to enhance the applicability in the field and broaden user accessibility. Especially the ULi system still awaits practical tests in a real-world setting and a full performance characterization is still pending for both systems. We anticipate that the presented laser scanning systems will provide a significant improvement for many mapping and inspection tasks which cannot be addressed by current sonar or camera-based systems.
References
DIN (2015). Sicherheit von Lasereinrichtungen – Teil 1: Klassifizierung von Anlagen und Anforderungen. DIN EN 60825-1.
EU (2019). Commission Implementing Regualation (EU) 2019/947. Official Journal of the European Union, 152(45).
ISO (2019). Water quality – Determination of turbidity – Part 2: Semi-quantitative methods for the assessment of transparency of waters. ISO 7027-2:2019.
Intergovernmental Panel on Climate Change (IPCC) (2022). Sea Level Rise and Implications for Low-Lying Islands, Coasts and Communities. In The Ocean and Cryosphere in a Changing Climate: Special Report of the Intergovernmental Panel on Climate Change (pp. 321-446). Cambridge: Cambridge University Press. doi:10.1017/9781009157964.006
Leica (2022a). Leica Chiroptera-5 product specifications. Leica Geosystems AG, Heerbrugg.
Leica (2022b). Leica RTC360 Product Specifications. Leica Geosystems AG, Heerbrugg.
Pope, R. M. and Fry, E. S. (1997). Absorption spectrum (380-700 nm) of pure water. II. Integrating cavity measurements. Appl. Opt., 36, 8710–8723.
RIEGL (2023). Data Sheet, RIEGL VQ-840-G. RIEGL Laser Measurement Systems GmbH, Horn.
- Google Maps, https://maps.app.goo.gl/dYcs6NV3zbF9aLcU8 (accessed 7 Aug. 2023).