
Abstract
1 Introduction
The ability of humans to think has set them apart from other creatures. Initially, their explorations focused on studying land, and later they extended their investigations to water environments. However, the progress in ocean studies was hindered by limited knowledge and resources. A significant breakthrough came with the discovery that sound serves as the most effective medium for energy transfer in water. In the quest for better understanding the underwater world, human-kind invented various technologies, including single beam echo sounders, side scan sonars, multibeam echosounders, and water column imaging. These advancements have played a crucial role in unlocking the secrets of the ocean’s depths and enhancing our understanding of marine environments.
Multibeam echo sounders (MBES) have witnessed rapid advancements over the past few decades and currently stand as the sophisticated and efficient tools for remotely observing and mapping the seafloor. The primary advantage of a modern MBES lies in its ability to provide both high-resolution bathymetry maps and backscatter images of the surveyed area simultaneously. Recent seafloor investigation techniques have relied on a combined analysis of bathymetry and backscatter data, utilizing specific characteristics of seafloor roughness and backscatter strength (Gaida et al., 2020). Over the past two decades, INHD (Indian Naval Hydrographic Department) has effectively employed multibeam systems, capitalizing on the enumerated advantages.
Understanding the underwater imaging of wrecks or features holds significant importance. This understanding raises the question whether multibeam echosounder backscatter produces better results than side scan sonar (SSS). Moreover, does the obtained outcome hold true for all wrecks and features at varying depths and seafloor conditions? Can ship-fitted MBES backscatter adequately serve all wreck investigations? And does the side scan sonar image still stand as the optimum solution for under- water imagery? To address these inquiries, an in-depth analysis was conducted of two data sets obtained from wreck investigations utilizing MBES and SSS at different depths: 105 m (Case 1) and 30 m (Case 2). Through this comparative study, valuable insights are offered into the efficacy and versatility of these imaging techniques in diverse underwater scenarios.
2 Methodology
MBES operate at varying frequencies depending on the depth of the water being surveyed. For deep sea systems, the frequency is typically low, ranging from 12 kHz to 30 kHz, while shallow-water systems utilize higher frequencies, ranging from 200 kHz to 500 kHz. The EM 710 operates within the frequency range of 75–100 kHz, while the EM 3002 operates at 300 kHz (Kongsberg, 2022). Lower frequencies in MBES result in less attenuation by the water column, enabling the system to reach greater water depths. Typically, the transducer in deep-water systems consists of two arrays: one for transmitting the acoustic signal and the other for receiving it. The transmitting unit is oriented along the ship’s axis, responsible for achieving along-track resolution. In contrast, the receiving unit is oriented across the ship’s axis, contributing to a high across-track resolution. This arrangement of the transmitter and receiver arrays is known as the Mill’s cross technique. The final point density of the surveyed surface is determined by the product of individual beams with low along track beam width and a narrow across-track aperture, resulting in detailed data.
3 Description of Case 1
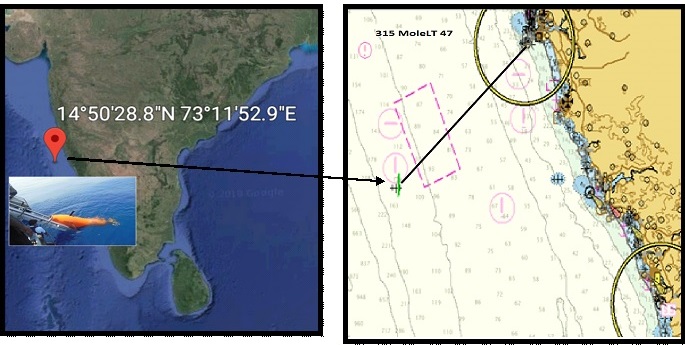
The data analysis for Case 1 in this study utilized information collected by INS Makar. For data acquisition, the ship employed a hull-mounted EM 710 MBES and an EM 3002 installed on an Autonomous Underwater Vehicle (AUV). To ensure accurate underwater positioning of the AUV during data acquisition, the USBL technique was employed, employing the HiPAP 501 series USBL system, which provided sub-meter positional accuracy to the AUV. Multibeam data acquisition occurred on the 19th and 20th of April 2015 using the AUV, while the ship conducted data acquisition on the 22nd and 23rd of April 2015. Additionally, the AUV equipped with side-scan sonar collected data on the 9th of June 2015. The operation took place off the West Coast of India, approximately 54 nautical miles west of Karwar (Fig. 1). The target feature for this investigation was a shipwreck located on ENC IN3257MC at coordinates 14° 50′ 28.8″ N, 73° 11′ 52.9” E (WGS84). During the data acquisition, the AUV was submerged at a depth of 80 m in supervised mode, while the average depth in the survey area was approximately 105 m. For effective communication during the mission, a comprehensive communication system comprising an Acoustic Communication Link (ACL), and Acoustic Data Link (ADL) was utilized.
The same wreck was also investigated using hull-mounted Multibeam echosounder EM 710, operating at frequencies between 75–100 kHz. The positioning system consisted of Seapath 200 with MRU5, utilizing GPS positioning with GAGAN correction from Hemisphere DGPS for enhanced accuracy. The surface sound velocity (SV) profile data was collected using the AML Micro X sensor. Prior to data collection, the SV data was uploaded to the Kongsberg SIS acquisition software and applied to the system for calibration. Fig. 1 shows the area of operation.
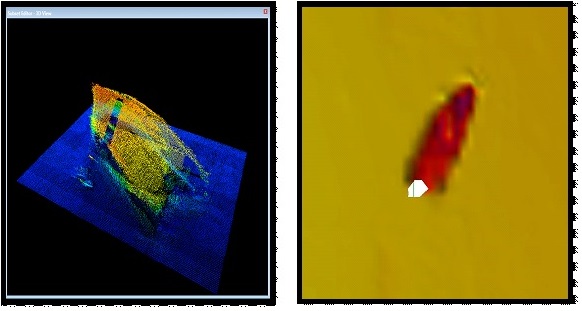
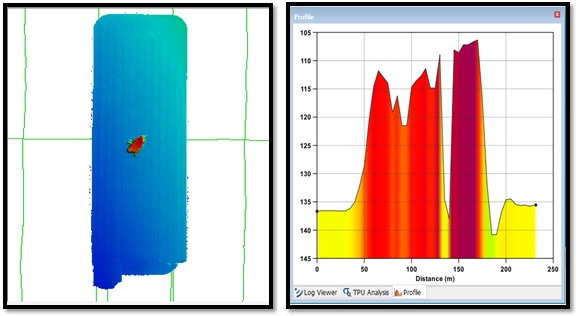
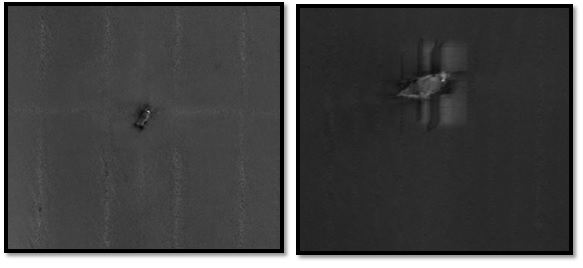
The data for the wreck depicted in position was collected by both the AUV and INS Makar. Subsequently, the data was imported into CARIS HIPS 11.3.16 for further processing. Fig. 2 and 3 showcase the surfaces generated from the bathymetric data obtained using the ship-fitted MBES and the AUV-mounted MBES, respectively.
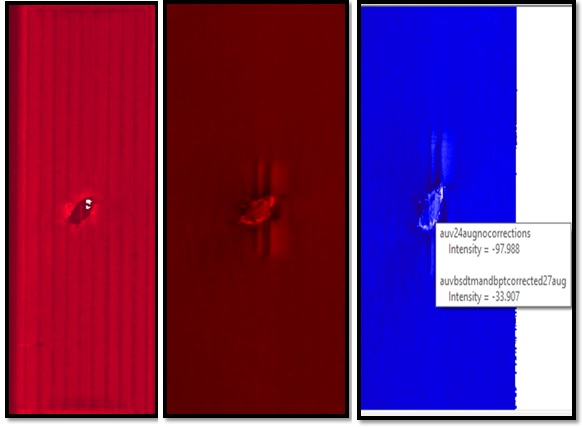
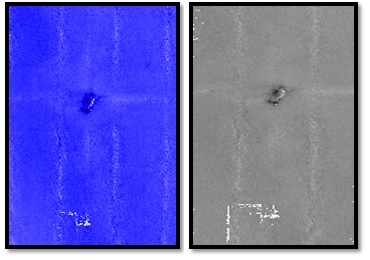
The processing of all MBES data was consistent until the creation of a surface, with a flowchart detailing various editors and steps involved (Fig. 4). The data filtering process was carried out through three steps: the attitude editing, navigation editing, and subset editing. Once the data underwent filtering, the surface was generated. For a clear comparison between the mosaics, the resolution remained the same. To create the backscatter mosaic, a beam pattern file was necessary. In the mosaic without correction, track lines displayed maximum intensity values from the nadir area. However, in the mosaic corrected for beam pattern, the seafloor appeared even, and artifacts stemming from incorrect intensity values were normalized. Notably, a change in intensity was observed after the correction, as depicted in Fig. 5.
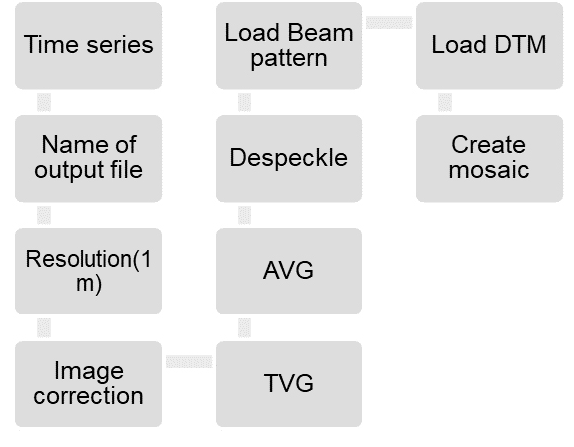
After generating the beam pattern file for both ship and AUV MBES data, the backscatter mosaic was created. The process for creating the mosaic is illustrated in Fig. 6. The Geocoder engine was employed for the mosaic creation. To facilitate analysis, the pixel size of the mosaics was kept the same. However, by using the same data set, different mosaics were created with varying resolution values, as depicted in Fig. 5.
The Geocoder engine provided two options for mosaic creation: time series of data and beam average (MacDonald & Collins, 2008). For this study, the time series data option was chosen due to its high density, as it provided intensity values for discrete time slices, unlike the beam average mode, which offered only one average intensity value per beam. Given the high-density nature of time series data resulting from the frequent time slicing by MBES, it was more suitable for mosaicing purposes. The resolution of the mosaic was set to 1 meter to ensure detailed representation. During the image correction process, various options for Time Varied Gain (TVG), Auto Varied Gain (AVG) and despeckle were applied to enhance the quality of the mosaic. Moreover, loading the beam pattern played a crucial role in creating a homogenous mosaic for the entire survey area. By employing this process, the resulting mosaic represented a consistent and uniform backscatter intensity across the entire surveyed region see Fig. 8.
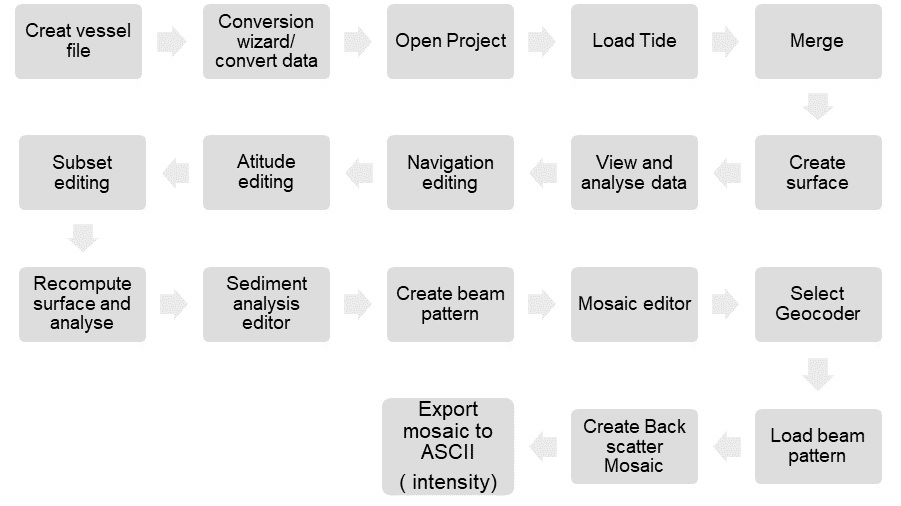
Fig. 6 Mosaic generation.
4 Description of Case 2
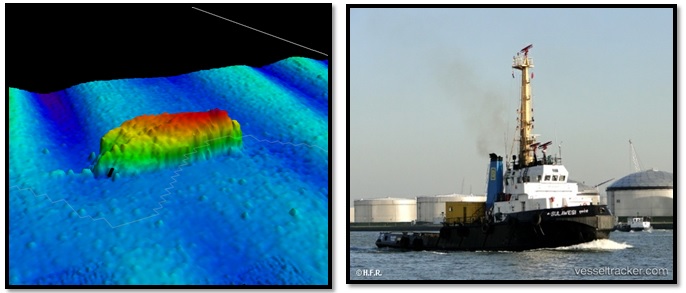
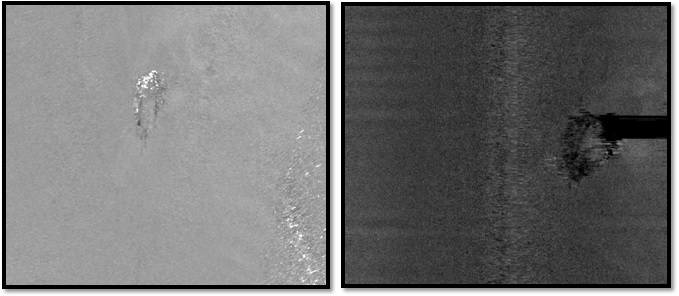
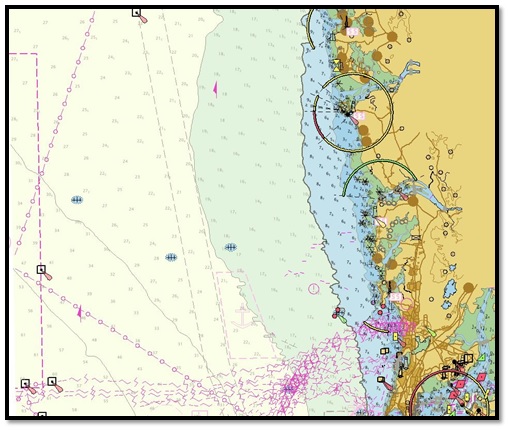
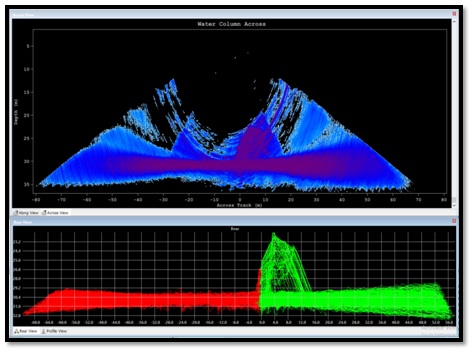
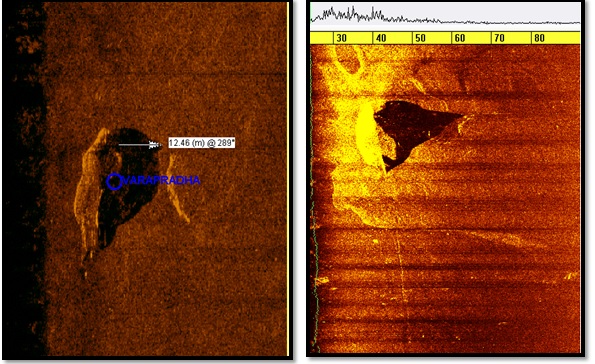
The second data set pertained to the tug boat Varapradha (Fig. 9), which sank off Mumbai in May 2021. For data collection, INS Makar used the EM 710 hull-mounted MBES (Fig. 9), along with the ET 4200 FS side scan sonar (Fig. 10). The depths in the area ranged from 28–34 m, and the achievable swath width was 100 m. The wreckage’s approximate position was available, as the vessel sank during a cyclone, and it was plotted on ENC IN3211 (Fig. 11). Initially, MBES lines were planned at 100 m apart along the TSS (Traffic Separation Scheme) and were later extended northward. Considering the need for speed advantages, the decision was made to focus on MBES sounding with an emphasis on backscatter imaging (Fig. 12) in the SIS (Seafloor Information System). During the data acquisition, the contact was detected in real-time through the SIS’s seabed image window. To validate the target, a reverse line was run. Additionally, water column data was logged for further analysis. The data underwent processing, and mosaicing was carried out in a manner similar to that of Case 1. Subsequently, the side scan sonar ET 4200 FS was also deployed from the ship to gather additional information. Moreover, water column data was acquired on top of the wreck (Fig. 13).
5 Discussion
Wreck investigation involves a series of essential steps to locate and assess the safe depth above the wreck. The primary step in this process is locating the wreck, particularly if information about the type or dimensions of the submerged vessel is known. In Case 1, where the submerged vessel was a merchant ship with a length exceeding 150 m, locating the wreck with the approximate position known was relatively easy. Once the wreck is positively detected and its location is determined, the next step is to ascertain the vertical clearance or safe depth above it. Traditionally, side scanning has been used for wreck detection, and various techniques like wire sweeping, diver inspections, or MBES soundings were employed to determine the safe depth. In Case 2, the submerged vessel was a tug with a length of 45 m, and with an approximate position available, a systematic search was required to find the wreck. However, the ship utilized an innovative approach by leveraging backscatter imagery, which resulted in faster and more efficient detection. By analysing backscatter images in conjunction with water column data, the precise location and safe depth above the wreck were determined. This resource-optimized approach demonstrated the full potential of the MBES system and achieved the desired results in a time-bound manner. By adopting this innovative strategy, the ship’s wreck investigation process had a successful outcome.
The available datasets have demonstrated that conducting multibeam sounding with sufficient overlap, while acquiring water column and backscatter data simultaneously, can significantly reduce effort and time in wreck investigation by providing precise location information and safe depth measurements. In MBES systems, the bottom detection algorithm utilizes a combination of amplitude and phase detection, distributing weights to obtain the best results. However, side scan sonar poses some challenges as it assumes a flat seafloor and stretches or compresses data to fit observations on sloping areas. This process can introduce artifacts. Additionally, near nadir data from side scan sonar may not be as accurate as the data obtained from the outer sides, where the sonar is looking more sideways. Height evaluation of shadows can be accomplished using the backscatter data from MBES when draped onto the bathymetric surface. Overall, the integrated approach of multibeam sounding with simultaneous acquisition of water column and backscatter data has proven to be a more effective and efficient method for wreck investigation than conventional side scan sonar with layback calculation, providing accurate location details and safe depth measurements.
As per the S 44 6th edition, achieving a 100 % feature search can be accomplished with a system that does not directly measure depth. The feature search is conducted using independent bathymetric systems, which means that a system other than the one used for feature detection should be used for measuring safe depth. The use of a non-bathymetric system for feature detection is not mandated; instead, a separate system may be employed for this purpose, allowing flexibility in choosing the most suitable equipment for each task. Furthermore, the S 44 6th edition recommends that, whenever possible, both data sets (i.e., bathymetric data for feature detection and data for measuring safe depth) should be collected in conjunction. This integrated approach ensures that all necessary information is gathered effectively and improves the accuracy and efficiency of the wreck investigation process. The use of multiple systems in this manner allows for comprehensive coverage of the survey area and enhances the reliability of the results obtained during wreck investigations.
As per S 44 6th edition, the exclusive order feature detection refers to identifying cubic features greater than 0.5 m in size, and the feature search is conducted with a coverage of 200 %. The survey standards have become increasingly stringent, and it is crucial to stay up-to-date with modern survey systems to meet these requirements. In the current world of advancing technology and precision, the accuracy of the survey system plays a pivotal role in ensuring the quality of the survey product. The design and conformance of the survey product are heavily influenced by the accuracy that the system can deliver. Therefore, staying informed about the latest survey systems and adopting high-accuracy equipment is essential for meeting the industry’s evolving standards and providing reliable and accurate survey results. Keeping up with the advancements in survey technology enables surveyors to optimize their operations and deliver superior survey products that meet the demands of modern applications and regulations.
Backscatter data refers to the intensity of the signal return from the seabed corresponding to each position measured by the multibeam echosounder. It is a well-known fact that the nadir area (directly beneath the sensor) tends to have a higher intensity return compared to the outer beams (Lurton, 2010). To enhance the quality and accuracy of the backscatter data, various normalization and corrections are applied using third-party software makers such as CARIS, HYPACK, and QPS FMGT. These corrections are implemented behind the scenes and are typically seen by the user through the graphical user inter- face (GUI) of the software. Obtaining more detailed software manuals and descriptions from the software providers would be very beneficial for users to comprehend the computations and algorithms employed during the data processing. The current software manuals often lack information about the different intermediate stages of backscatter corrections, which makes it challenging for users to assess the impact of individual corrections on the final mosaic. Typically, the effectiveness of these corrections can only be evaluated by examining the quality of the final mosaic generated by the software. Having more comprehensive documentation and detailed explanations of the software algorithms would greatly assist users in improving their understanding of the data processing steps and the resulting backscatter mosaics. This, in turn, would lead to better utilization of the software’s capabilities and enhanced data analysis for various applications, including underwater imagery and sea- bed characterization. The results and discussions presented here are based solely on the analysis of the specific data sets described in the context of wreck investigations using multibeam echosounders and related techniques.
6 Conclusions
From the analysis of Case 1 and Case 2, it becomes evident that MBES backscatter can serve as a valuable tool for wreck investigation when properly corrected. This eliminates the need for additional sonar inventory and simplifies the process of conducting a wreck investigation survey. By utilizing MBES backscatter, the positional accuracy of the wreck is significantly improved compared to conventional side scan sonar with layback calculation. The Kongsberg 710 and EM 3002 systems used in the cases have the capability to acquire water column data. Water column data proves to be a more efficient and modern tool for determining the safe depth over the wreck. Combining MBES backscatter and water column data proves to be an effective approach for wreck investigation. MBES backscatter provides detailed imagery of the wreck, while the water column data aids in accurately determining the safe depth. With this combination, the need for side scanning in wreck investigation can be minimized, especially for prominent features or artifacts in shallow waters. Therefore, the conclusion is that MBES can be effectively utilized for wreck investigation in shallow waters, provided all the requisite data types, including MBES backscatter and water column data, are acquired. This integrated approach streamlines the wreck investigation process and enhances its accuracy and efficiency.
References
Gaida, T. C., van Dijk, T. A.G.P., Snellen, M., Vermaas, T., Mesdag, C. and Simons, D. G. (2020). Monitoring underwater nourishments using multibeam bathymetric and backscatter time series. Coastal Engineering, 158. https://doi.org/10.1016/j.coast- aleng.2020.103666
Kongsberg (2022). Autonomous Underwater Vehicle (AUV), Hugin. www.kongsberg.com/maritime/products/marine-robotics/autonomous-underwater-vehicles/AUV-HUGIN/ (accessed 17 Sep. 2023).
Lurton, X. (2010). An introduction to underwater acoustics: principles and application (2nd ed.). Springer.
MacDonald, A.J., and Collins, C. (2008). Taking Geocoder to Work: Making Geocoder part of your Daily Routine. Proceedings of the Shallow Survey Conference, Portsmouth (NH).