


Abstract
1 Introduction
The study of extreme events is one of the major issues in most African countries with large river basins (Panthou, 2013). This issue requires specific approaches and technologies for the purpose of reducing the vulnerability of social systems to natural hazards. Based on this observation, the use of hydraulic simulation models has increased in recent years, particularly in the context of risk studies (Werren & Lasri, 2014; Abidi et al., 2019). These models have allowed significant steps forward in flood management, both for forecasting and for prevention and crisis management (Tanguy, 2012). The results of the hydraulic models used are heavily reliable on the quality of the data provided. These data are generally presented in different forms (topographic, geometric, hydraulic and hydrological). Moreover, Layan et al. (2012) consider that hydrological studies are one of the foundations on which any hydraulic modeling of rivers must be built in order to predict floods and manage hydrological risks in a floodplain. In this context, preliminary studies are necessary to determine some characteristics and indicators related to the physical, hydrological and hydraulic functioning of the watershed of interest. In the specific case of the Bia watershed in Aboisso, few studies addressing these aspects exist and when they do, these studies are very often limited to the Ayamé outlet (EDF, 1955; Meledje, 2015) or further upstream to Bianouan (Fadika et al., 2019). This study would like to address these shortcomings. This will be achieved by determining the morphometric characteristics of Bia watershed upstream Aboisso outlet and estimating the flood flows on the basis of quantiles according to different return periods, namely T5 , T10, T20, T50 and T100.
2 Materials and Methods
2.1 Study area
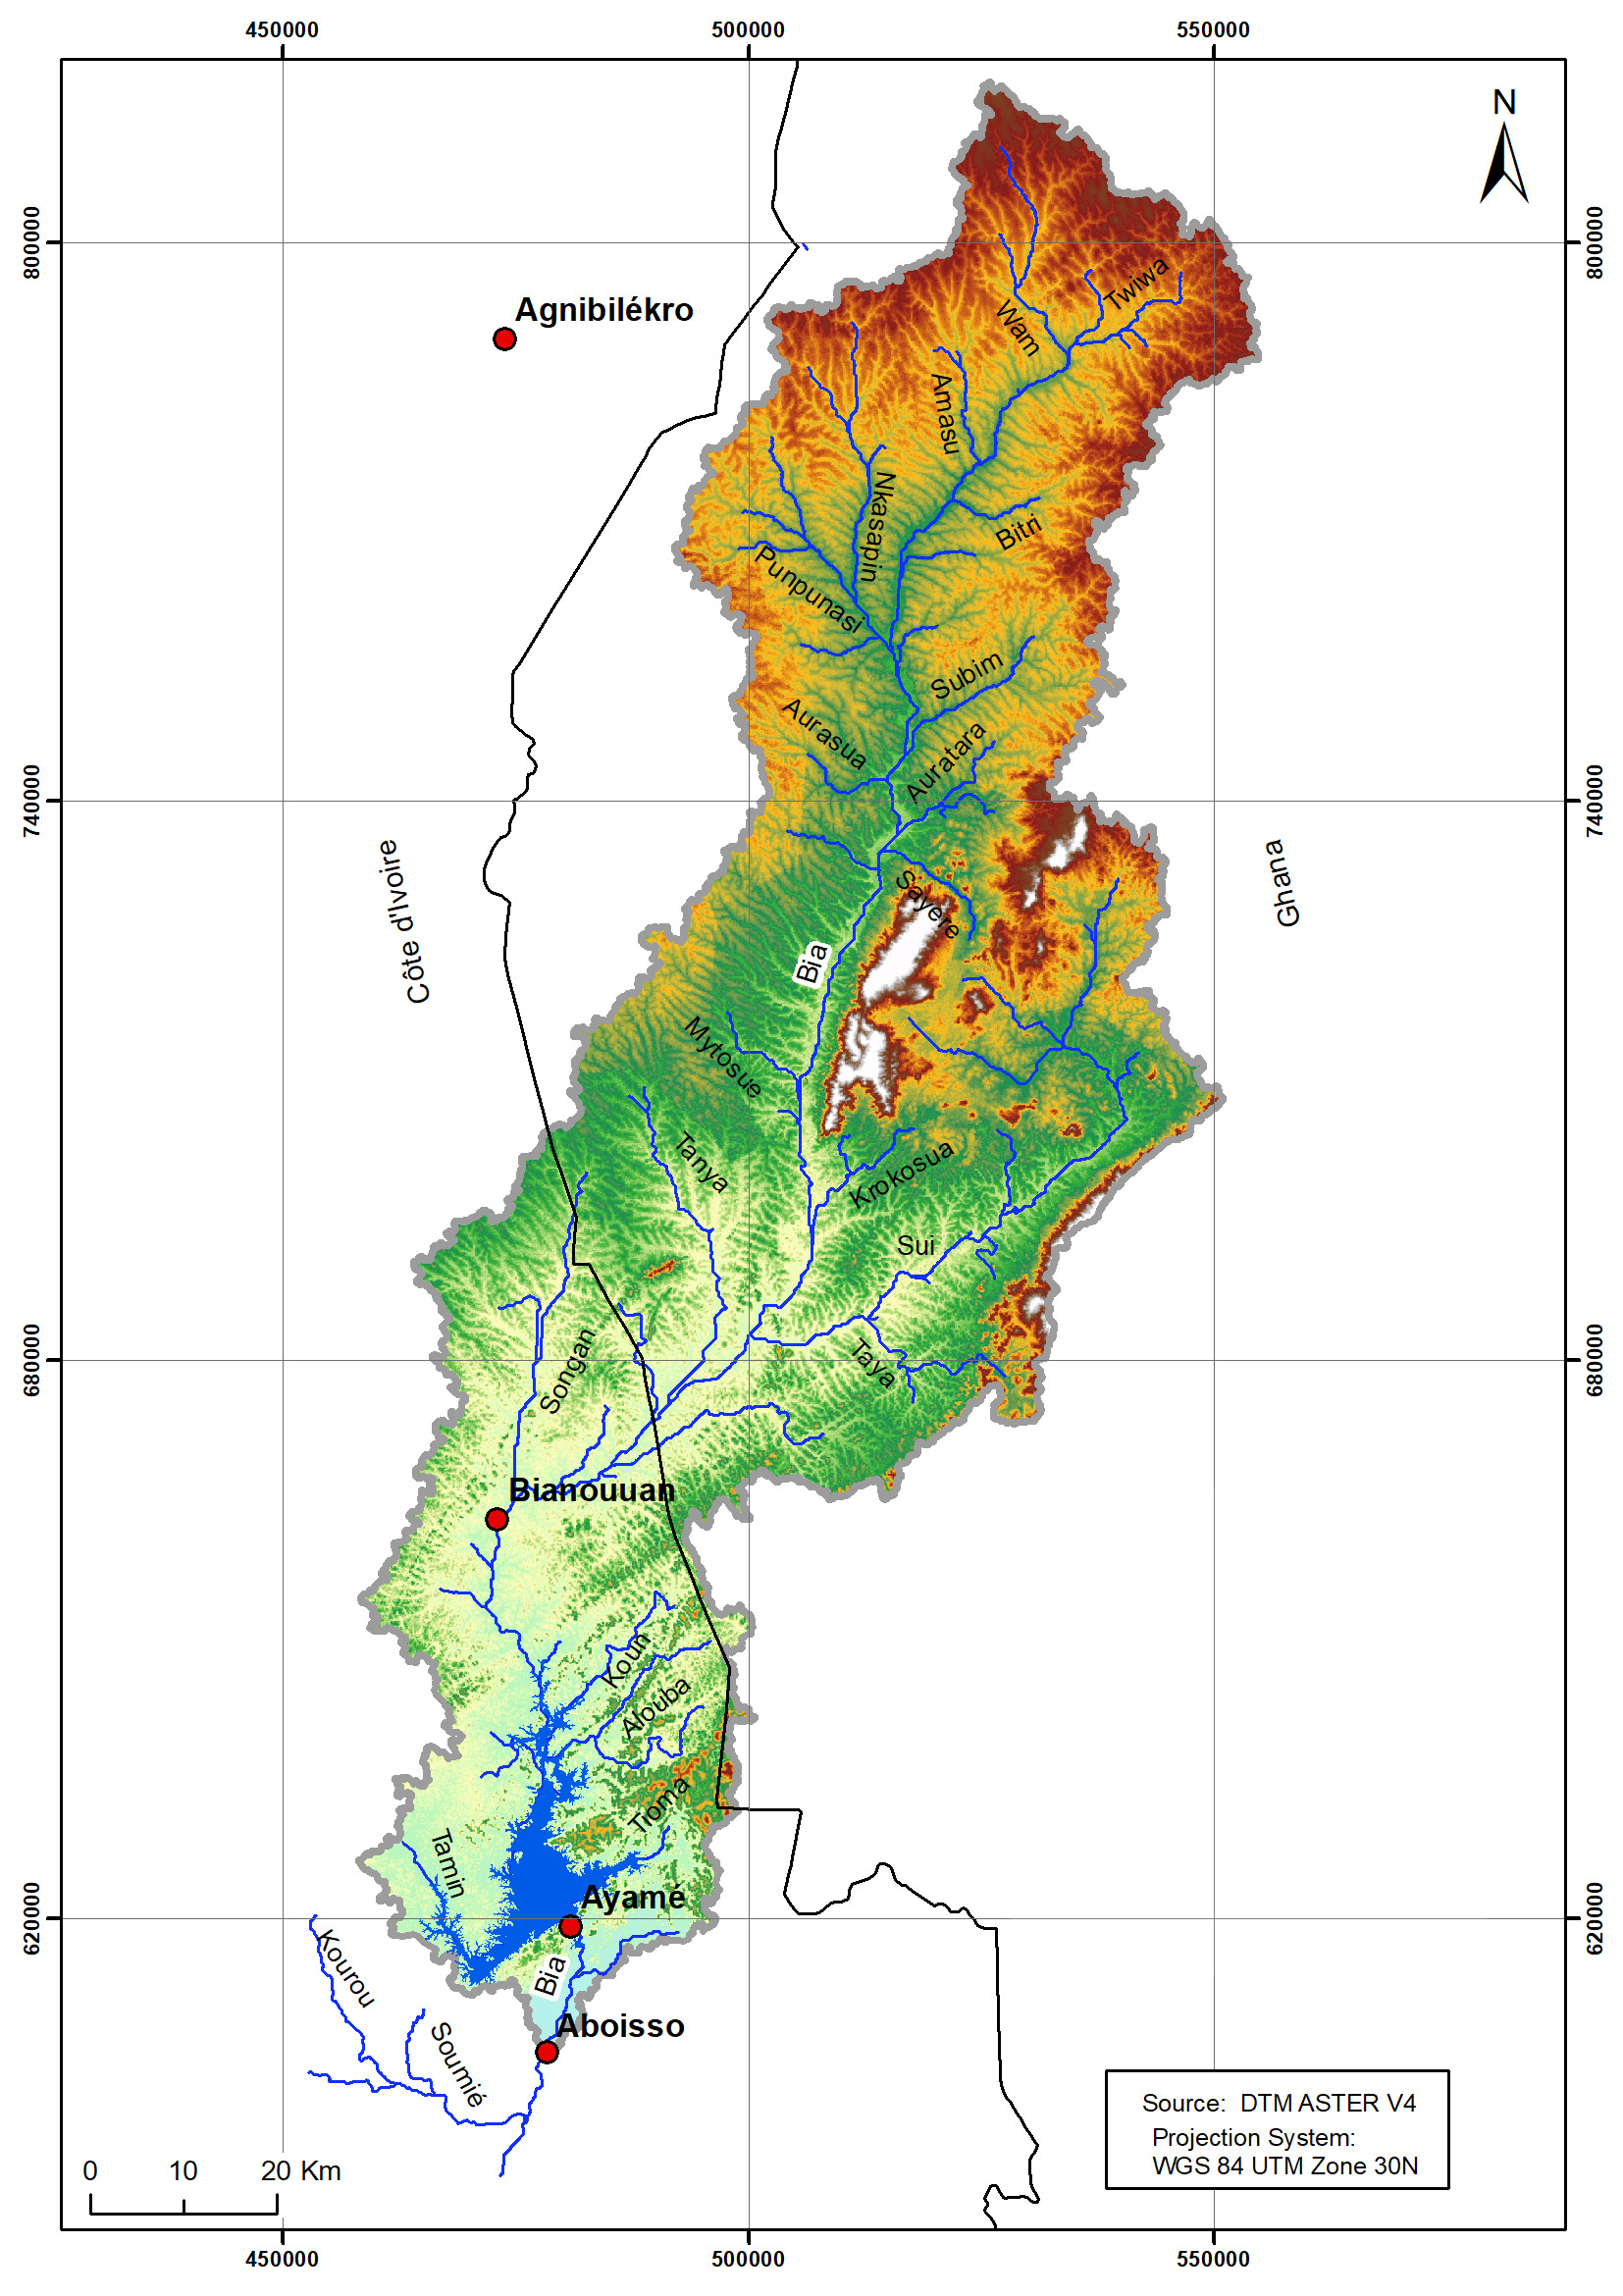
Aboisso is both a district and the capital of the Sud-Comoé region. It is located in the southeast of Côte d’Ivoire between latitudes 5.43° N and 5.52° N and longitudes -3.34° W and -3.17° W. The city’s hydrography is dominated by the Bia, a transboundary river that originates in Ghana at an altitude of about 300 meters. The watershed of the Bia at its outlet in Aboisso lies between latitudes 5°27′ N and 7°23′ N and longitudes -3°24′ W and – 2°31′ W (Fig. 1) and is bounded to the west by the Comoé basin and to the east by the Tanoé basin. In addition, the river flows through the town of Aboisso, separating it into two banks before beginning its final journey to the Aby lagoon (320 km from its source). From a climatic point of view, the rainfall analysis of the basin distinguishes two zones: the humid tropical zone in the north with a single rainy season and further south, a subequatorial zone with two distinct rainy seasons (Meledje, 2015). As for the relief, the watershed generally corresponds to a low relief except in some areas in Ghana where it culminates at elevation not exceeding 650 m (EDF, 1955).
2.2 Data
Two types of data are used in this research:
- Hydrometrical data on annual maximum flows. Those data are derived from the time series of daily average flows recorded on the Bia River at Aboisso hydrometric stations (1950–1983) and Bianouan (1981–2005).
- Cartographic data namely, a Digital Terrain Model (DTM) describing the morphology and topography area study. This DTM which is used to delineate the watershed of interest is derived from a global ASTER V4 image with a spatial resolution of 30 m × 30 m1.
3 Methods
The approach used in this research is twofold. The first one is related to the determination of morphometric watershed parameters and takes advantage of the use of empirical formulas and Geographic Information Systems (GIS). The second one is dedicated to the frequency analysis of hydrometrical variables (Hydrological Frequency Analysis; El Adlouni & Bobee, 2014). It is inspired by several works (Yahiaoui, 1997; Kouider, 2003; Avahounlin et al., 2013; Meddi & Sadeuk, 2014) and also used the implementation made in the Hyfran software.
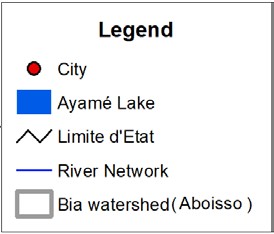
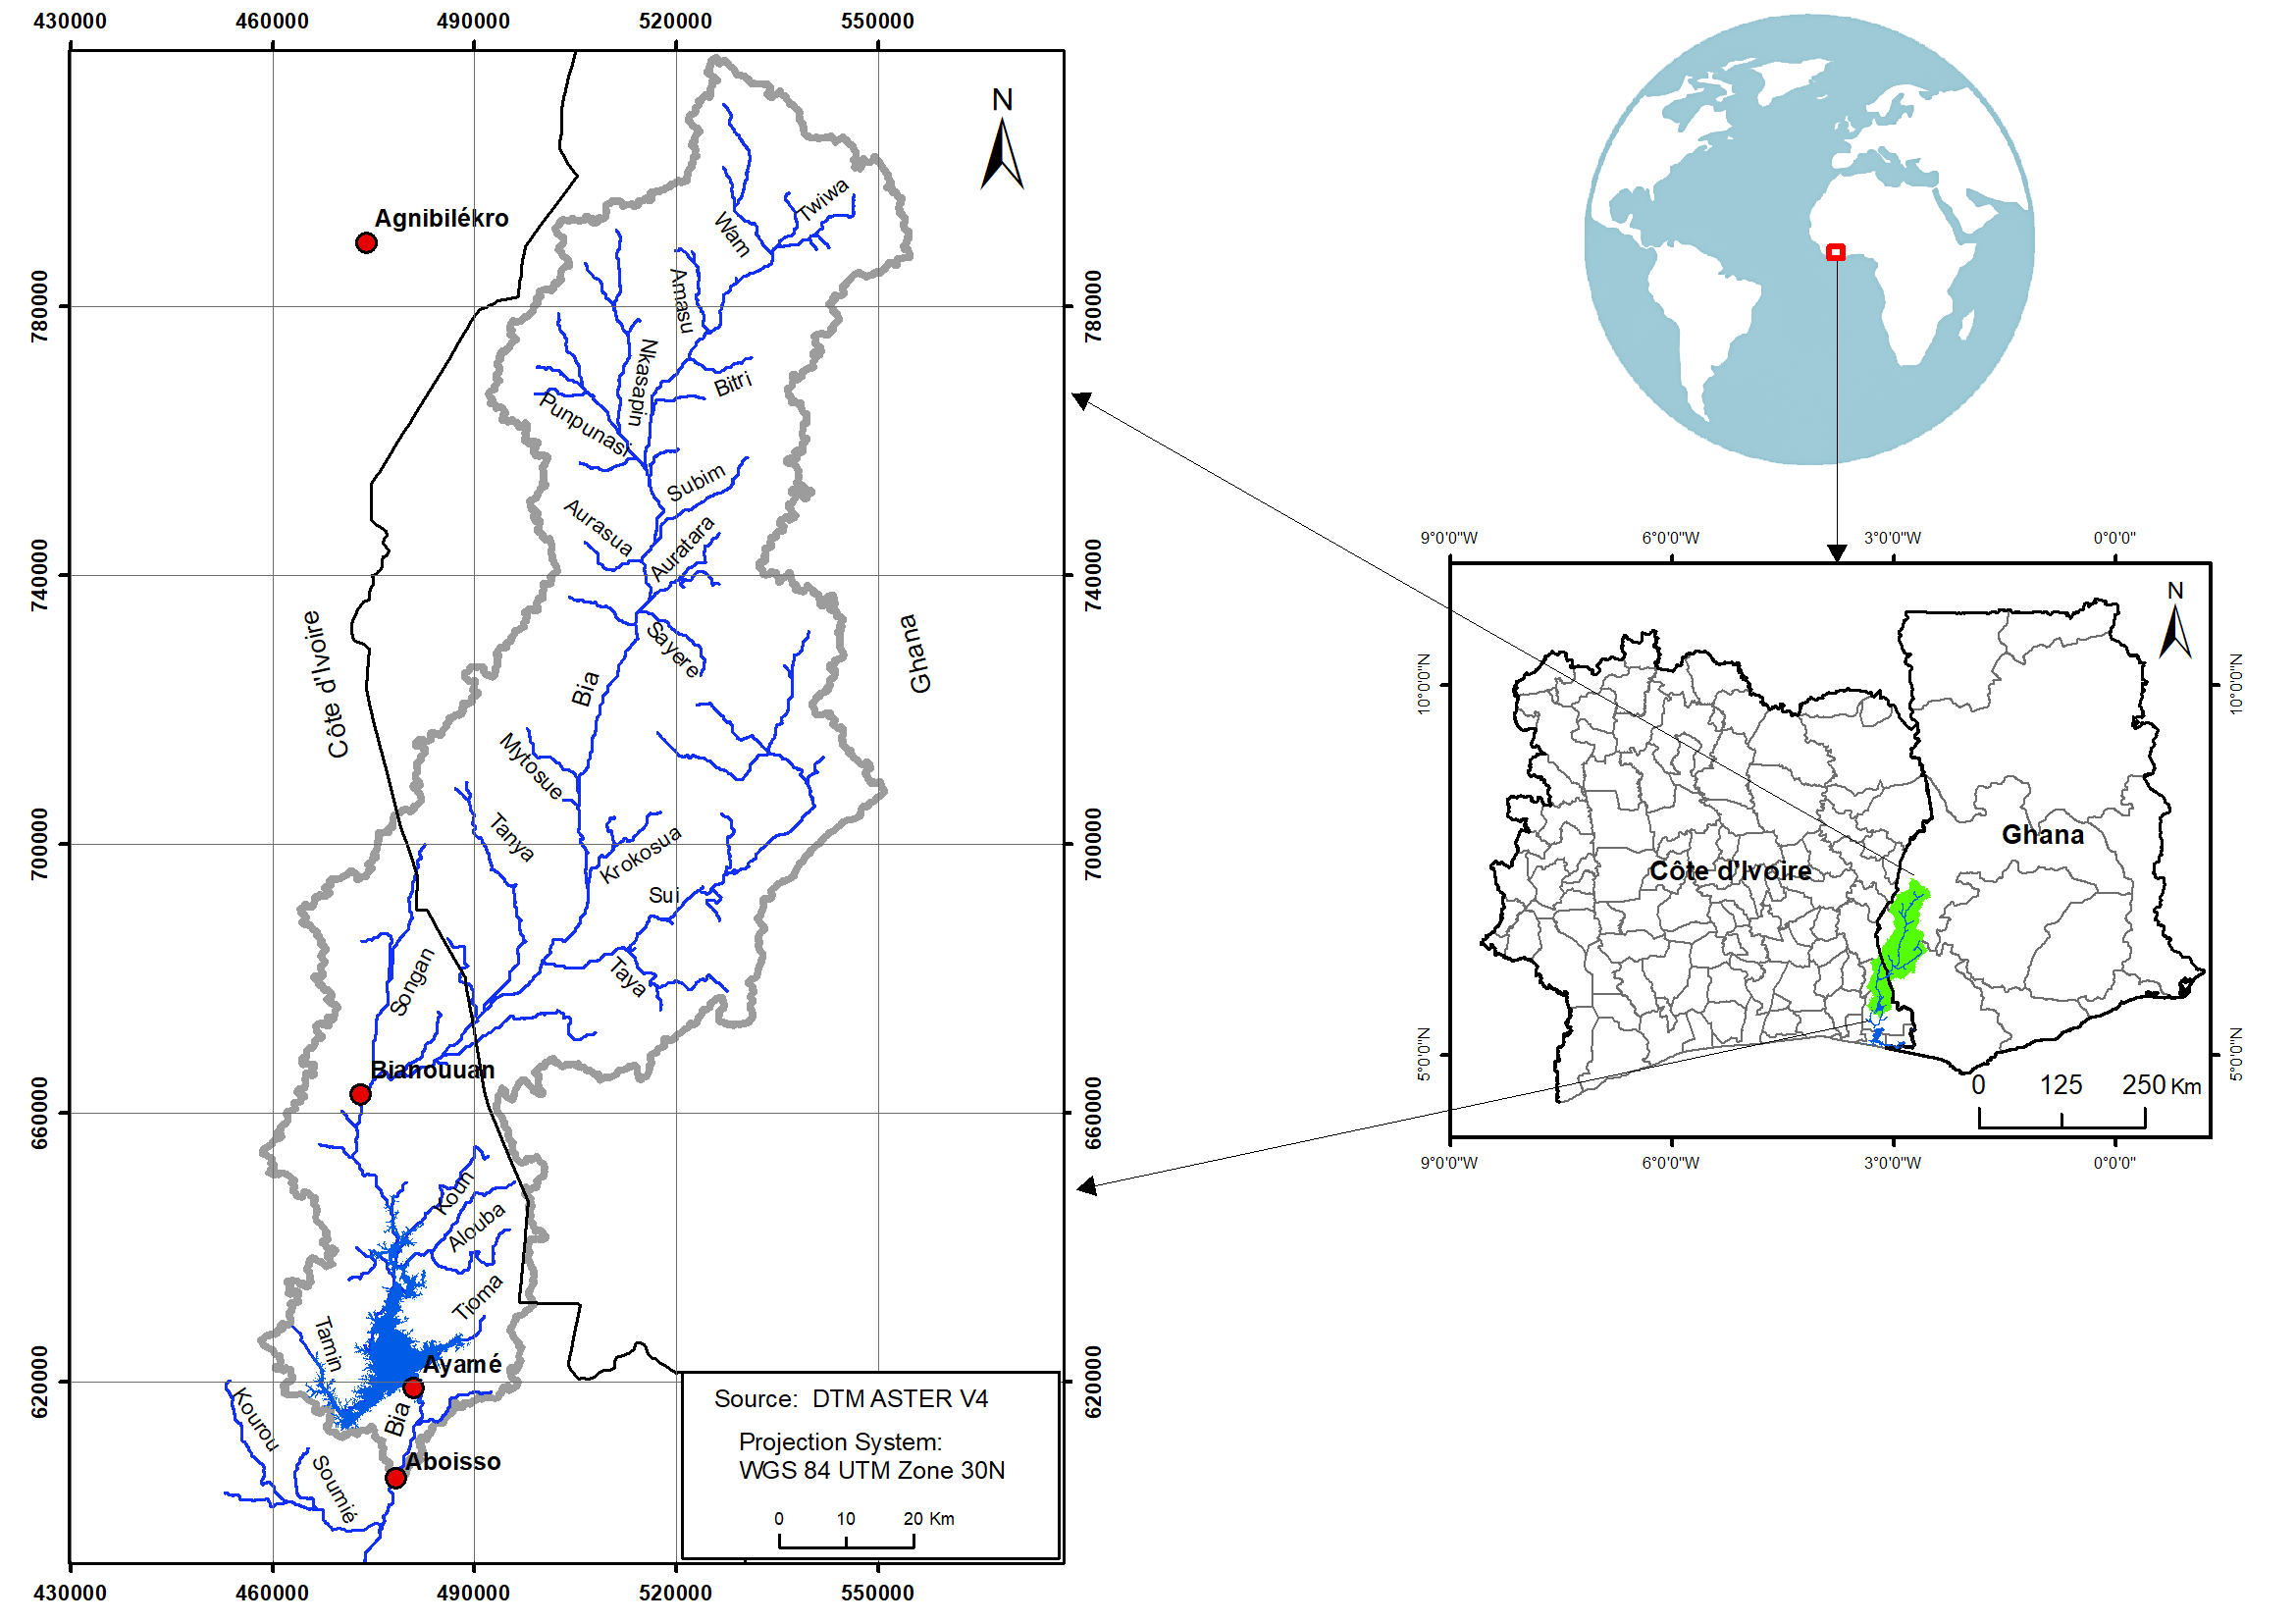
Fig. 1 Geographical location of Bia watershed upstream Aboisso.
3.1 Determination of watershed morphometric parameters
In order to characterize the morphometry of the watershed, three classes of parameters are analyzed: geometry, topography and hydromorphometric aspects.
3.1.1 Geometry
In terms of geometry, the focus is lead on parameters to characterize the delineation and shape of the watershed:
Delineation
The watershed is the area where precipitation is received and where rivers are fed, so the amount of water which is flowing to the river will depend on the watershed area. In this study, watershed area (A) and its perimeter (P) are delineated from the DTM and integrated in a GIS (Fig. 2).
Shape
The shape of the basin influences the shape of the hydrograph. Among the morphological index to characterize its shape, the Gravelius compactness index (KG) and the equivalent rectangle were selected (Konin et al., 2021). KG is defined as the ratio of watershed perimeter to the circle perimeter with the same area. The closer this coefficient is to 1, the more quasi-circular shape, the basin will take and conversely will tend towards a more elongated shape. The KG, is expressed as follows:
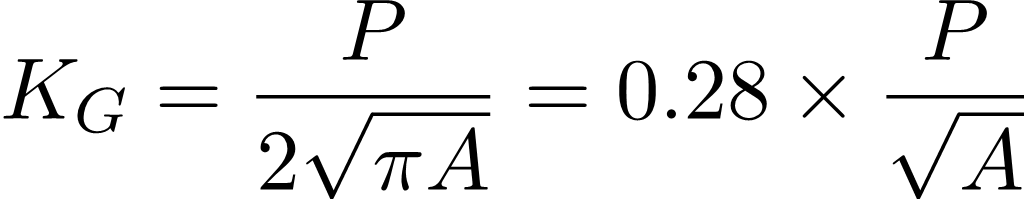 |
(1) |
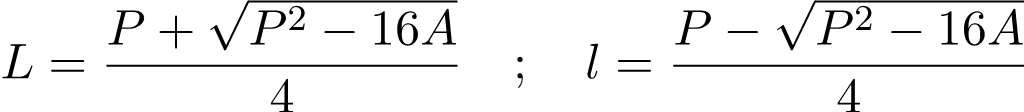
Furthermore, the equivalent rectangle is defined as the rectangle of length (L) and width (l) that has the same area (A) and perimeter (P) as the watershed (Eqs. 2 and 3)
| (2) |
|
3.1.2 Topography
In this section, various parameters are analyzed which describe hypsometrical and slope characteristics:
Hypsometry
The hypsometric curve stands for the distribution of watershed area according to the elevation. Its plot allows a direct reading of the characteristic elevation such as the maximum (Hmax), minimum (Hmin) and average (Havg) elevation. As for the vertical drop (D), it can be deduced from the hypsometric curve through the relationship between the H5% and H95% (Eq. 4):
| D = H5% – H95% | (4) |
Slopes
There are several indices that allow to characterize watershed slopes, make comparisons between basins and make basins classifications. We have the global slope index, the specific gradient and the average watershed slope.
Global slope index
The global slope index (IG), is determined as follows (Eq. 5):
| (5) |
Specific gradient
The specific gradient (DS) is given by Eq. 6:
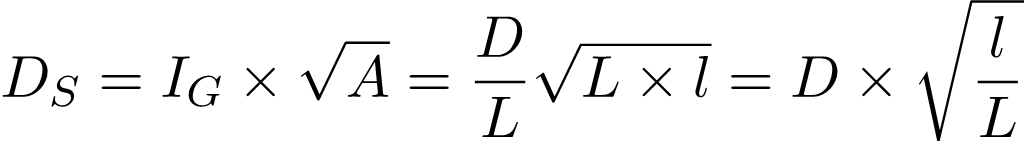 |
(6) |
with
D: vertical drop in [m]; IG : global slope index
L: equivalent rectangle length in [m]; l: equivalent rectangle width in [m]
DS : specific gradient in [m]; A: watershed area in [m]
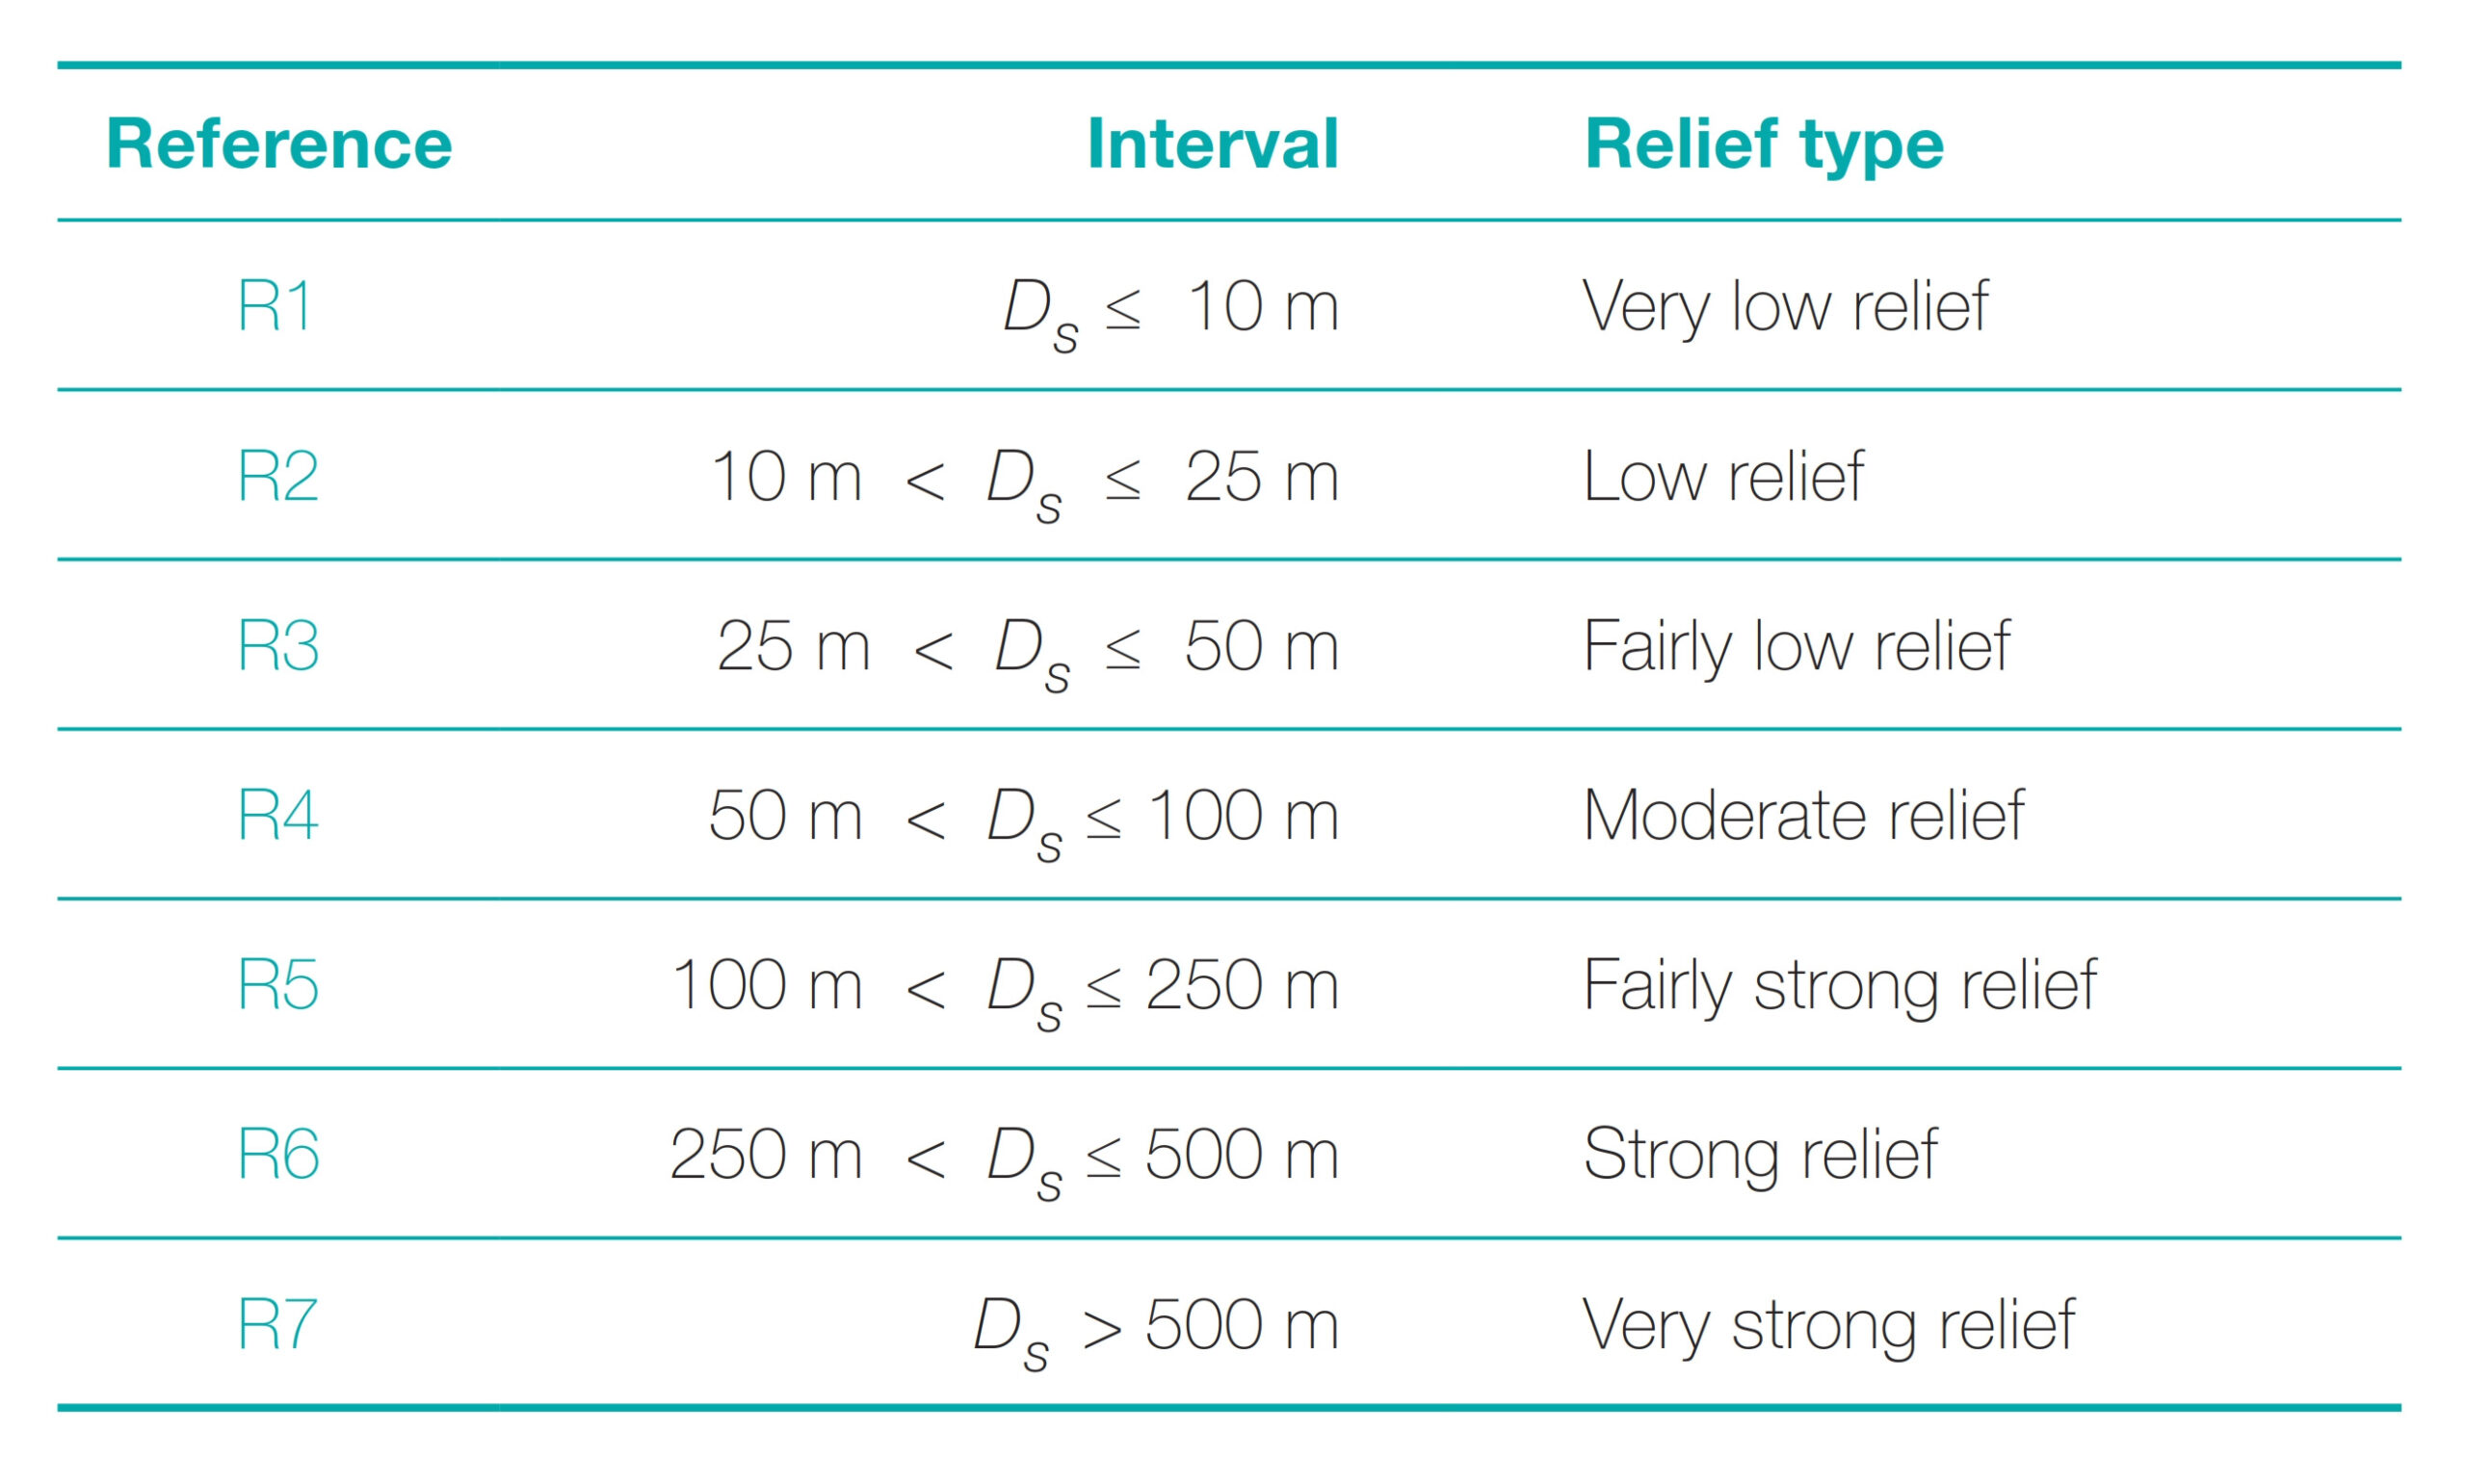
It gives rise to a classification of the ORSTOM (Office de la Recherche Scientifique et Technique d’Outre-Mer) independent of basin areas (Table 1; Roche, 1963).
Average slope of watershed
The DTM and the ArcGIS software-processing tool (Slope) were used to estimate the average slope of watershed (IW; Saidi, 2013).
3.1.3 Hydromorphometric aspects
Average slope of the main stream
The average slope of the main stream (longitudinal slope of the main stream) determines the speed with which water reaches to basin outlet and therefore concentration time. This variable influences the maximum flow observed. This slope is determined by the longitudinal stream profile or its tributaries after removing 20 % of the upper part and 20 % of the lower part of the profile (Eq. 7):
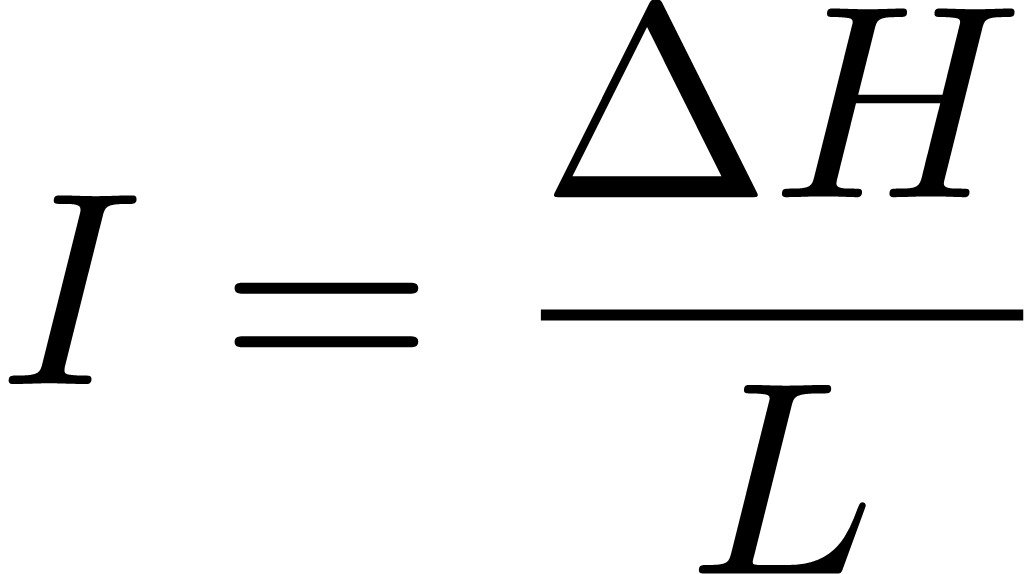 |
(7) |
with
I: Average slope of the main stream [m/km].
L: length of stream section concerned in [km].
ΔH: difference in elevation between the furthest point (20 % of profile) and the watershed outlet (20 % of profile) in [m].
Time of concentration
This is the time required for a water particle to flow from the most hydrologically distant feature of the watershed to the outlet. In this study, Tc was estimated using the old Giandotti formula (Touaïbia, 2004, Eq. 8).
| (8) |
TC : time of concentration in [hours]
Lep : length of the main stream in [km]
A: watershed area in [km2]
Havg : average elevation of watershed in [m]
Hmin : minimum elevation of watershed in [m]
3.2 Estimating flood flows of certain magnitudes
The study of peak flows provides information on the trigger flows for flood and flooding in the watershed (Kouassi, 2014b). Several methods for determining flood flows of certain magnitudes are existing (empiric, probabilistic and statistic). For the current study, statistic methods through applying frequency analysis from historical flow data of Bia River in Aboisso station are adopted (period 1950–1983).
This approach requires the use of:
- A sampling resulting in the selection of the maximum values of each year in the series of daily average flows of Aboisso station (Meddi & Sadeuk, 2014; Hachemi, 2017).
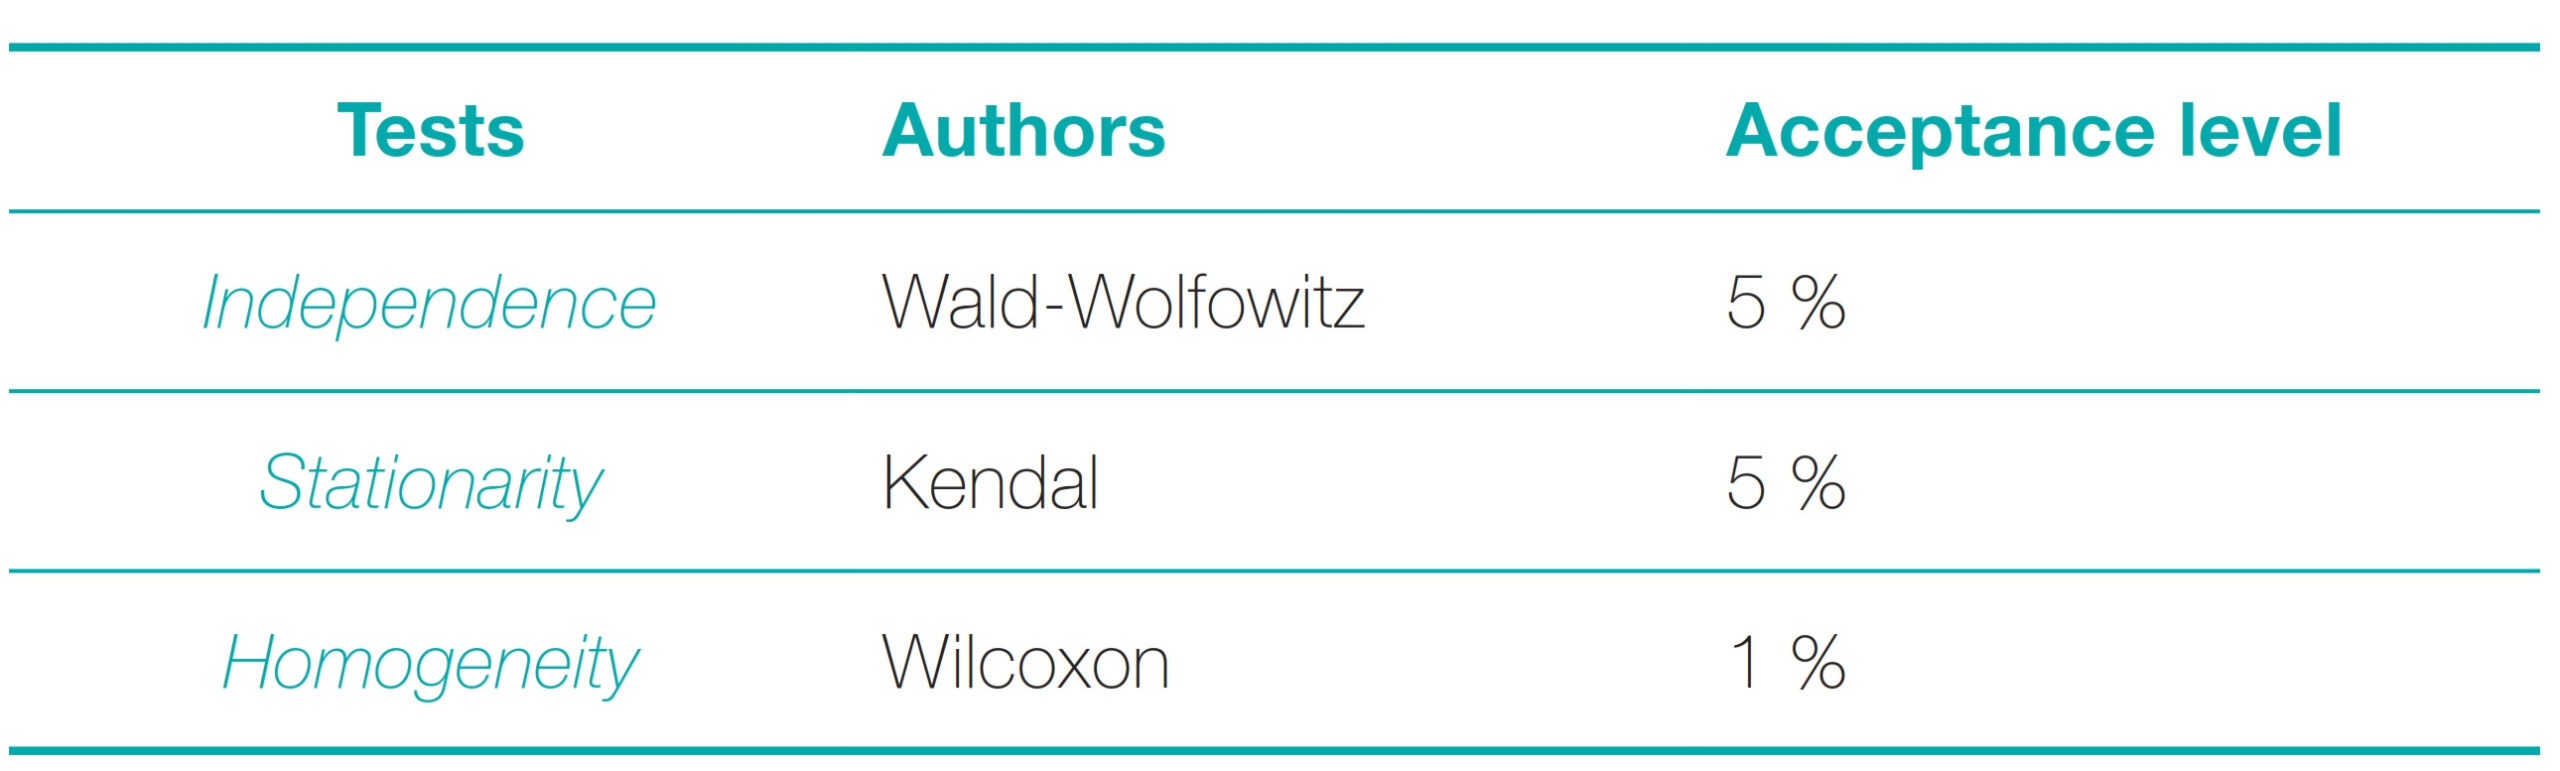
- Hypothesis tests to judge the quality of the sample (Yahiaoui, 2012) mainly involving the Wald-Wolfowitz independence test, Kendal stationarity and Wilcoxon homogeneity test (Kouider, 2003; Yahiaoui, 2012; Kouassi et al., 2014a; Koungbanane et al., 2020).
- The choice of a frequency analysis model to predict the probability of occurrence flood event from the flow distribution function F(Q) or the probability density P(Q).
- The choice of a statistical model following the Gumbel, VEG (General Extreme Value) and Weibull laws (Kouider, 2003).
- A control of the fit and validation of statistical model through the χ2 adequacy test and the Akaike information criteria (AIC; Akaike, 1974) and Bayesian information criteria (BIC; Schwarz, 1978).
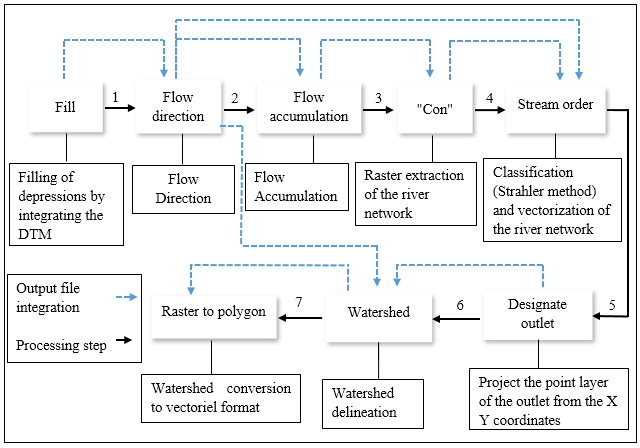
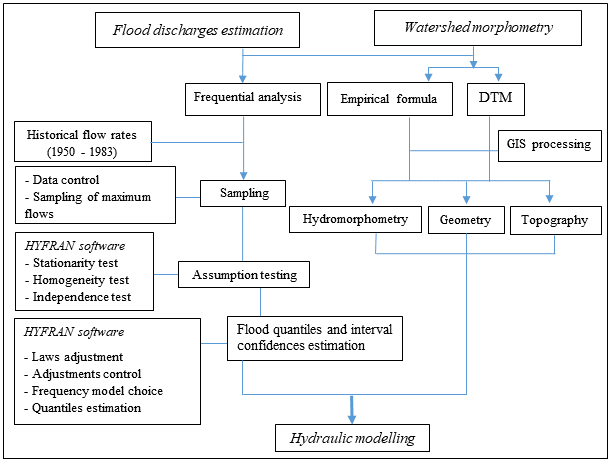
In overall, the best law being identified, the flood quantiles as well as the associated confidence intervals were estimated using the Hyfran software (El Adlouni & Bobee, 2014) calculating the different return periods. Fig. 3 stands for an overall summary of the methodological approach adopted in this study.
4 Results and discussion
4.1 Determination of the watershed morphometric parameters
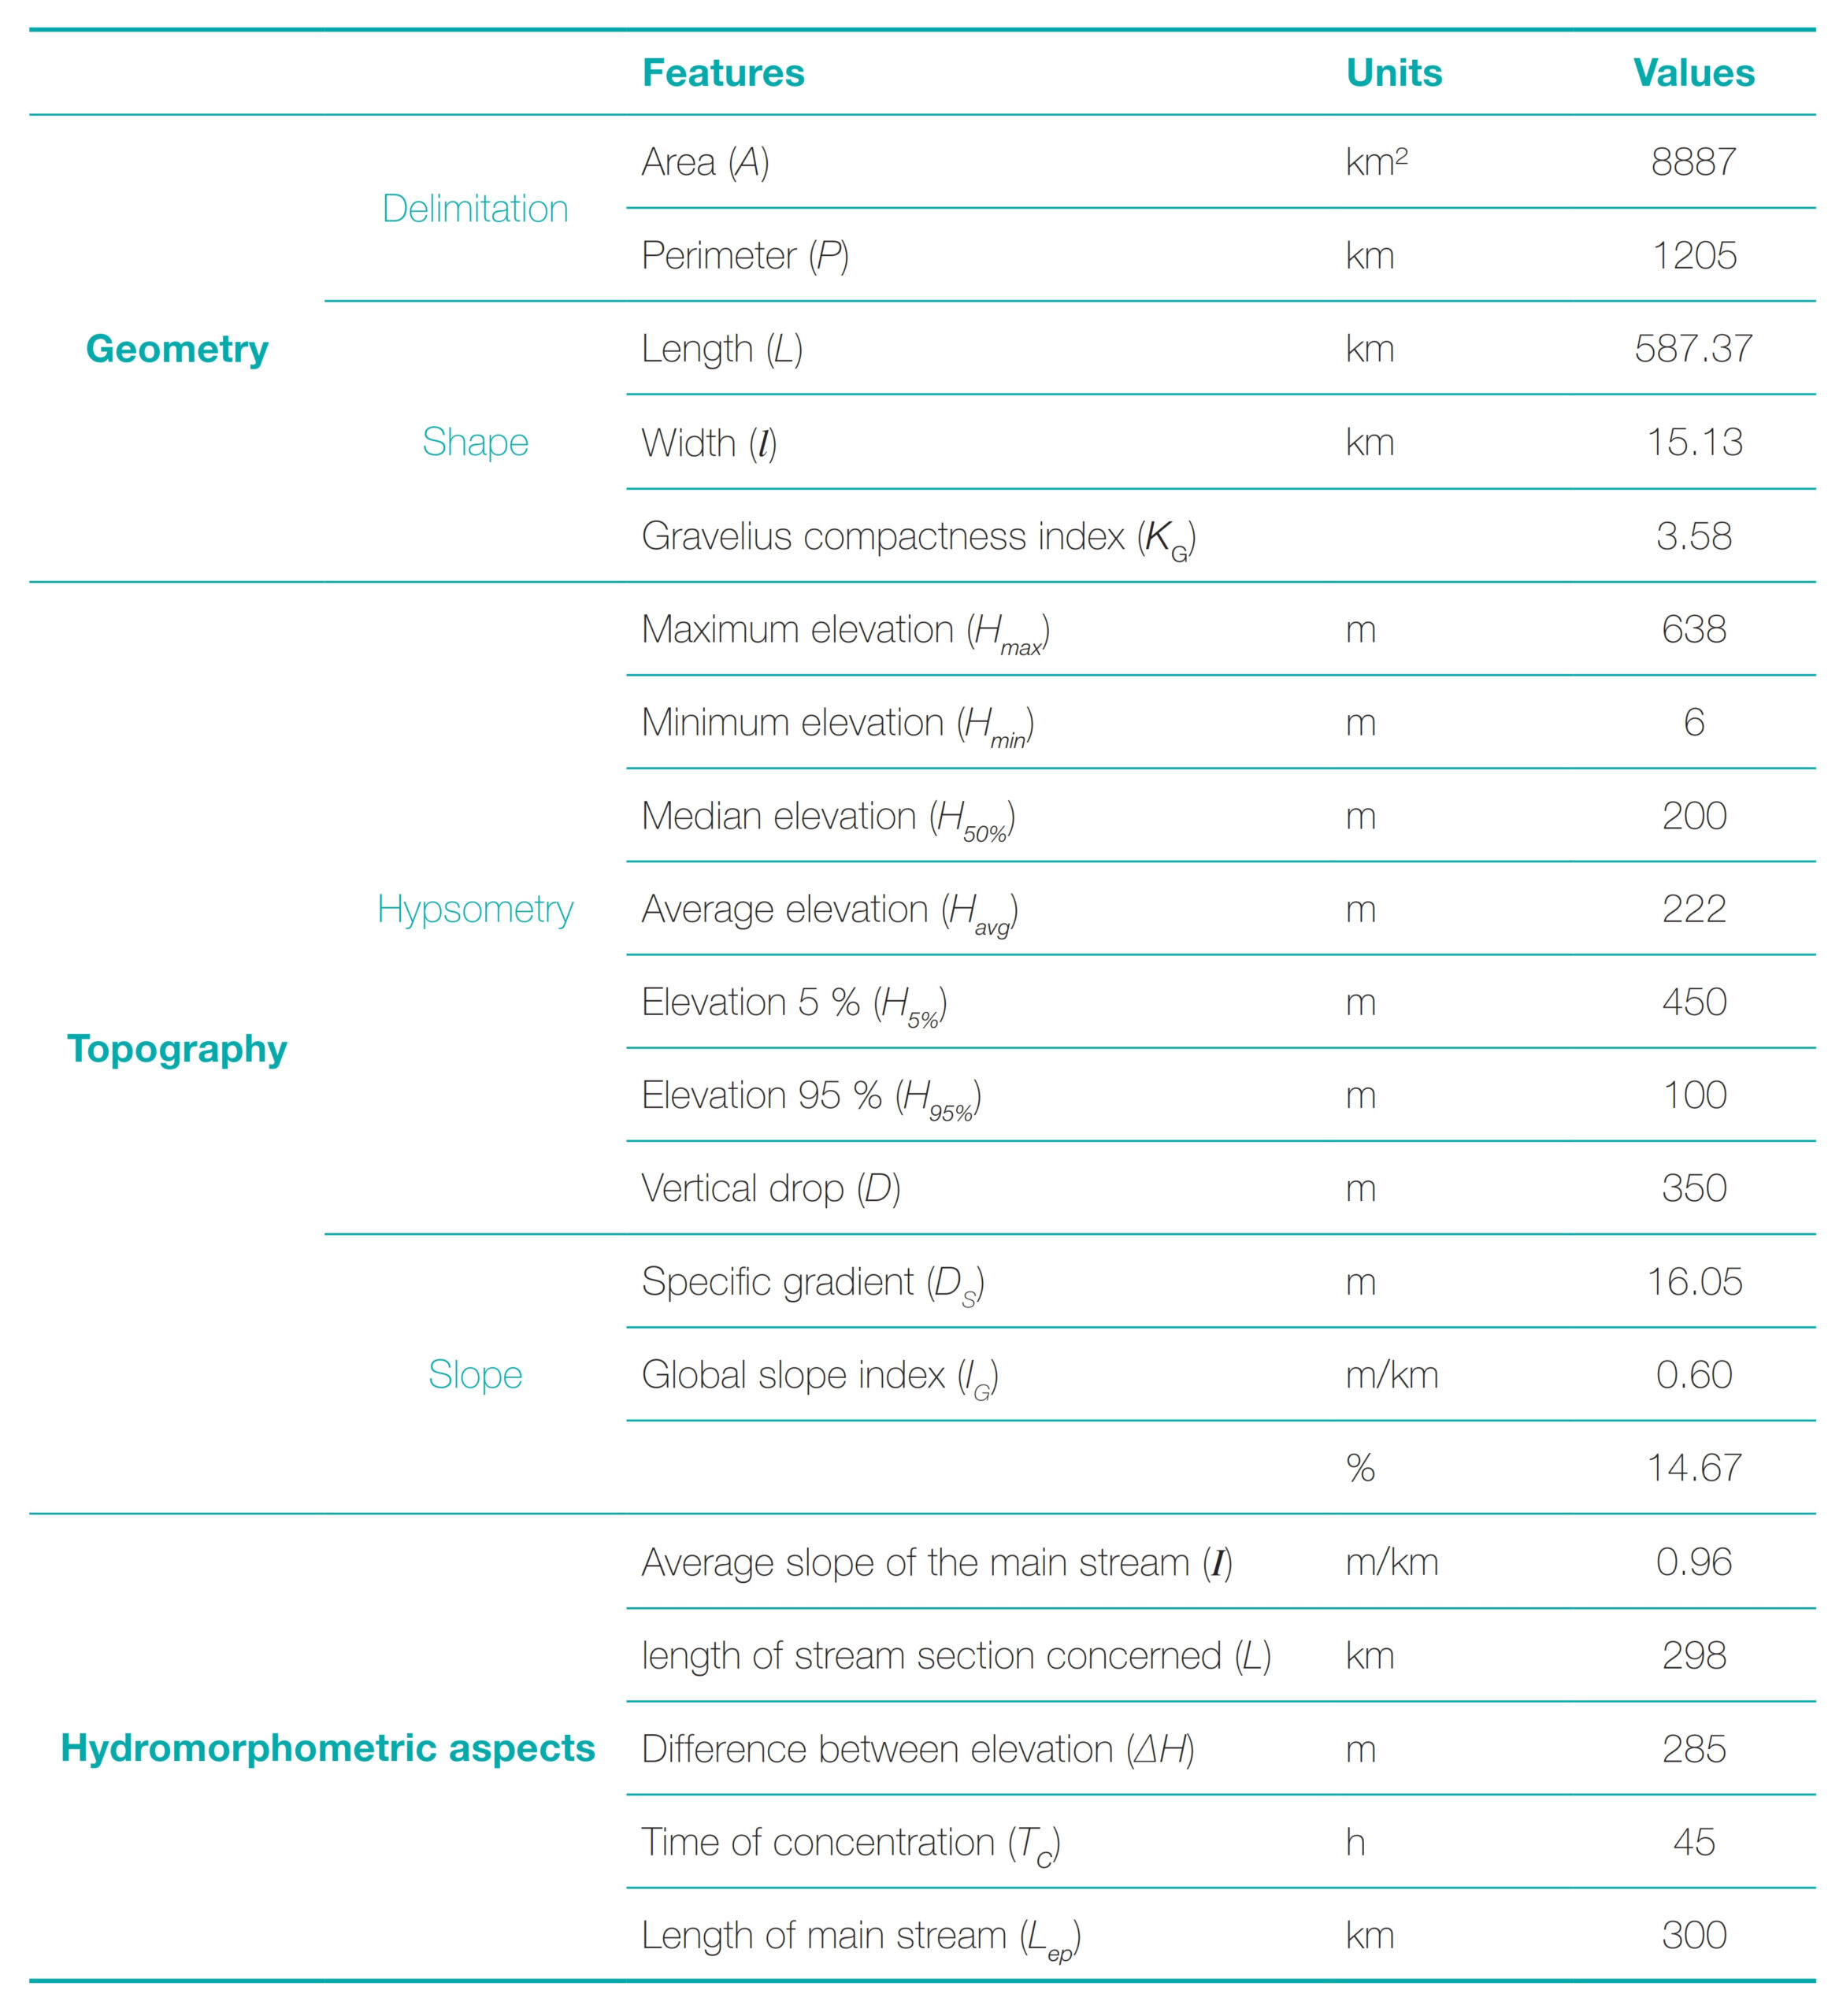
The morphometric analysis reveals that at the Aboisso outlet, the Bia watershed has a geometric area of approximately 8,887 km² for an estimated perimeter of 1,205 km (Table 2).
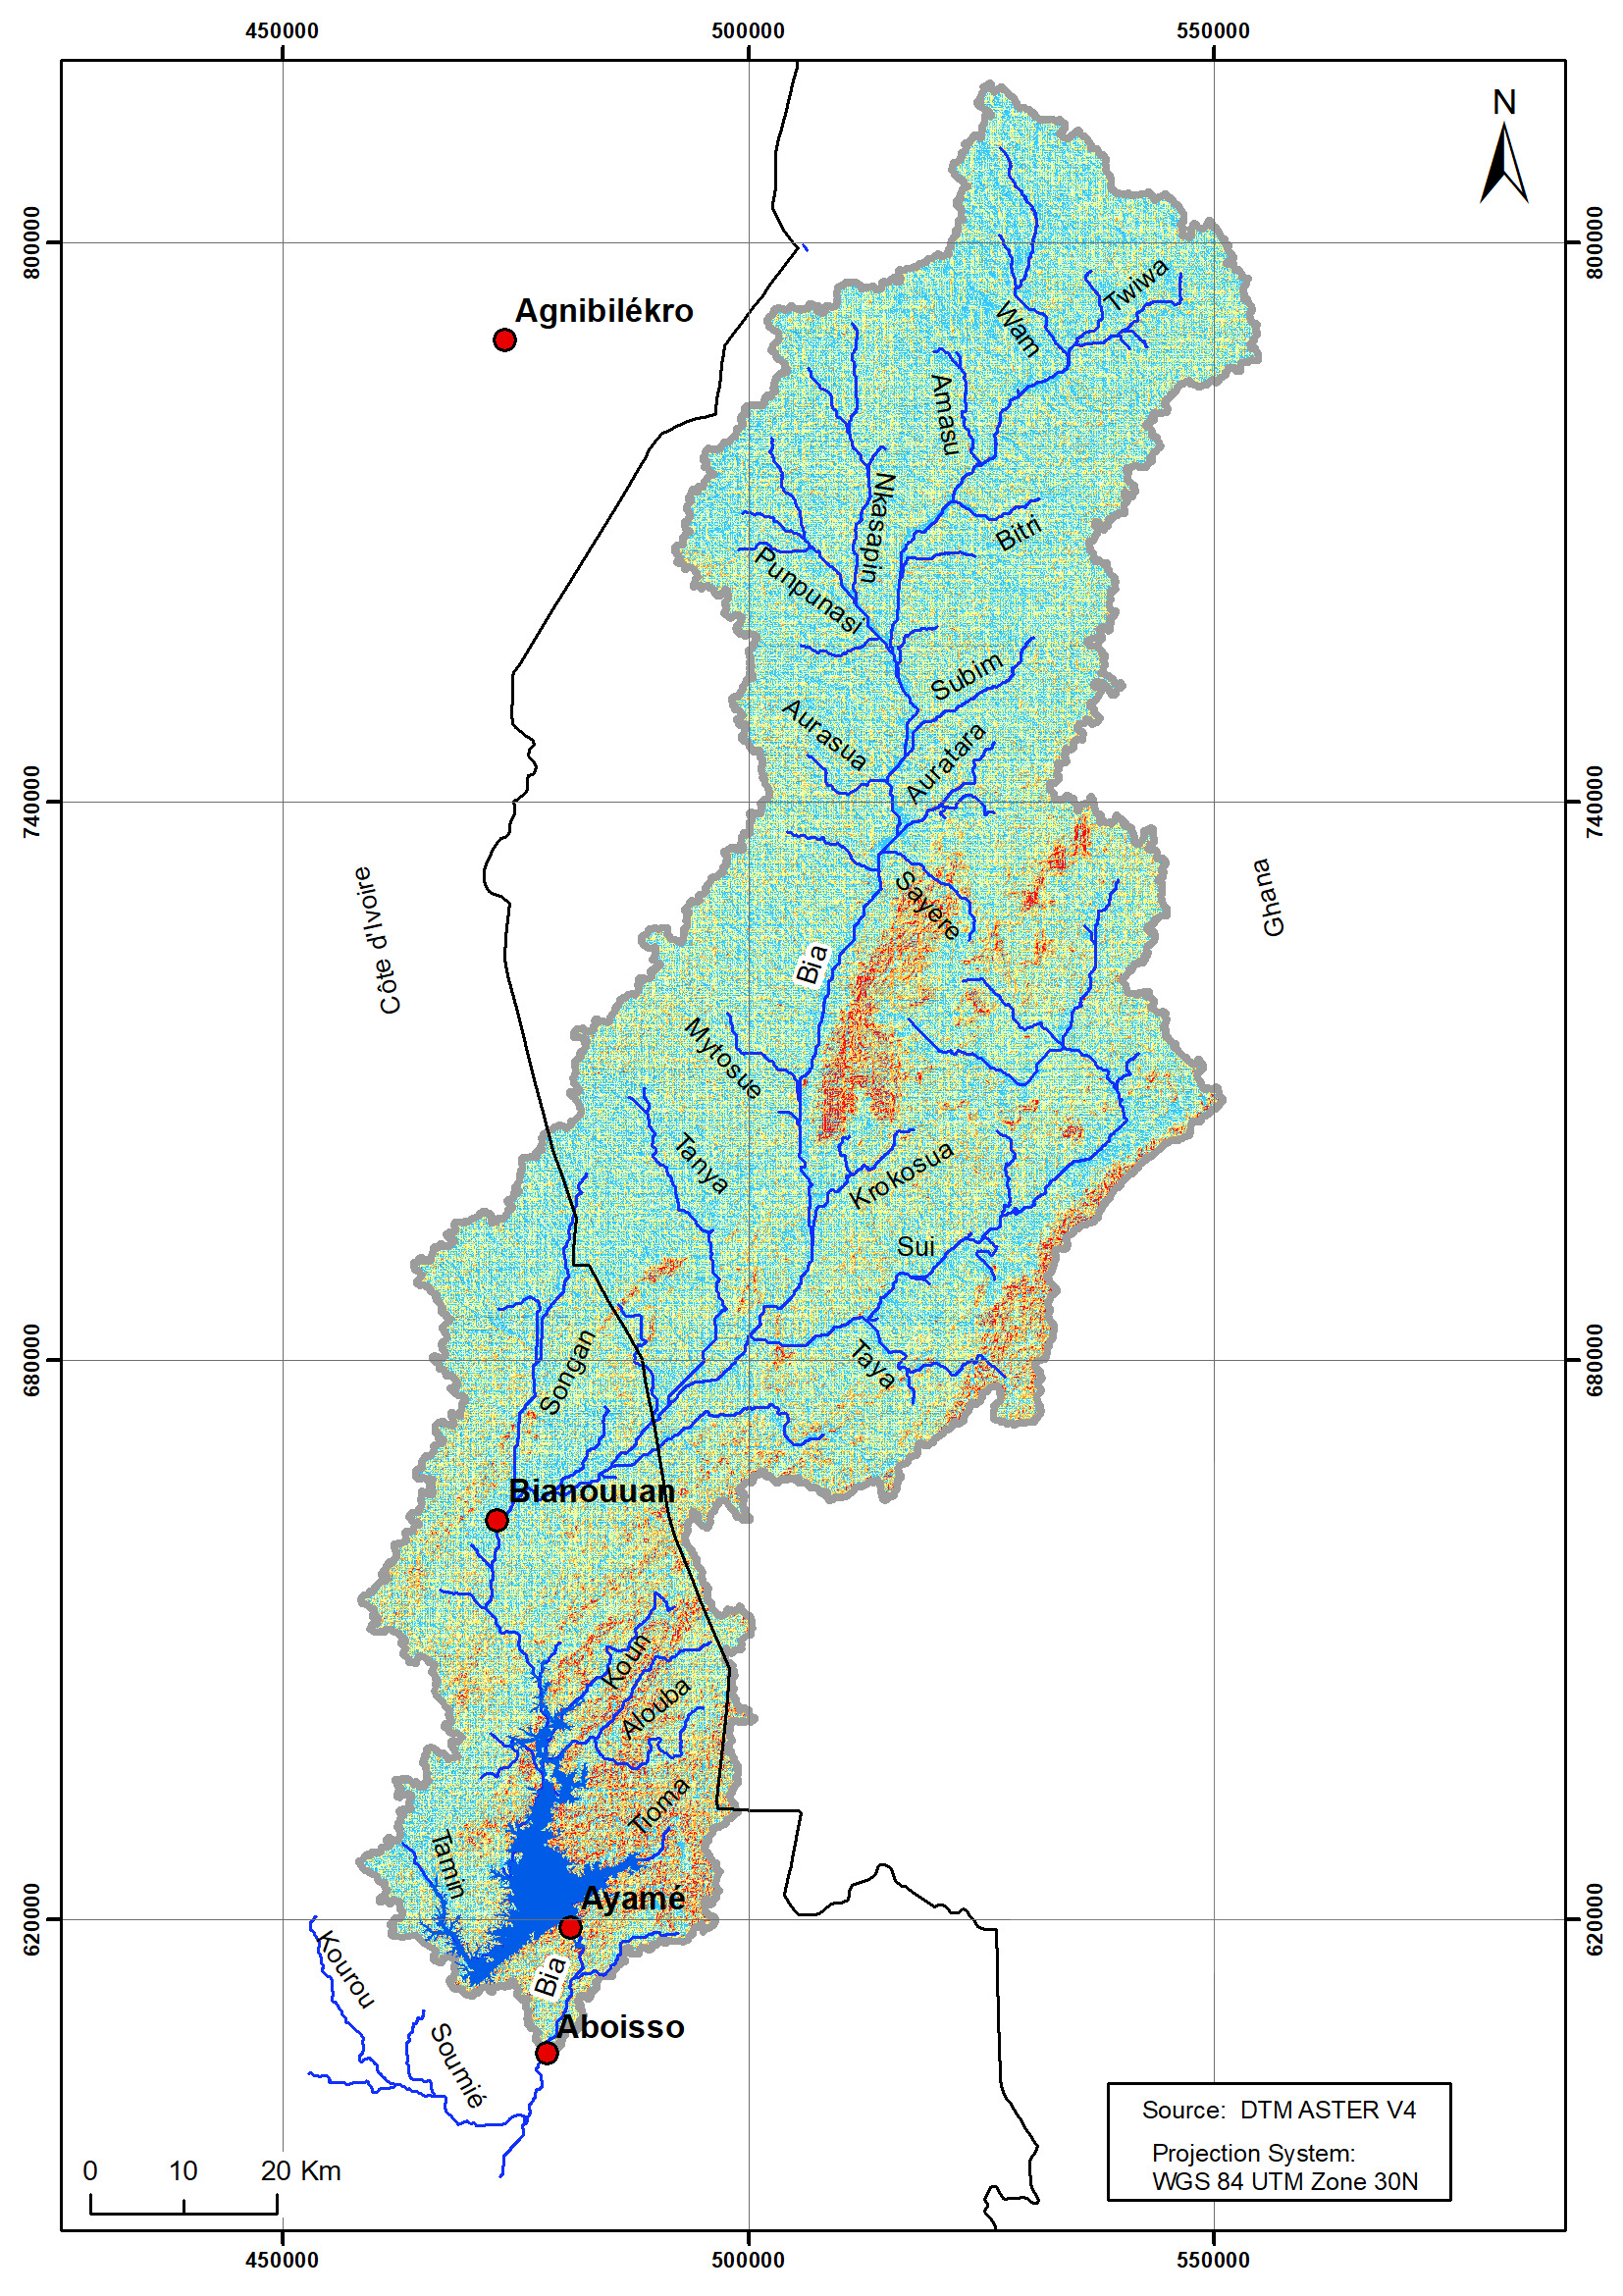
Gravelius compactness index (KG) of 3.58 reflects an elongated basin with a northeast-southwest orientation (oblique). This elongated shape will strongly influence the overall flow, especially the watershed answer time. Thus, with a time of concentration of 45 h, for the same rainfall, less peak flows will be recorded at the outlet due to the longer time of water routing. Topographically, the basin elevations vary between 6 m and 638 m (Fig. 4) with a predominance of higher elevations in the basin northern regions. Also, the specific gradient value (DS : 16.05 m), allows to classify Bia watershed relief in a general way in low reliefs class. Moreover, the watershed has a moderate average slope (IW) of 14.67 % (Fig. 5). It is recognized that such slopes slow down area runoff, thus giving water enough time to infiltrate into the soil. In addition, in line with the hydromorphometric aspect, the stream draining the basin over more than 300 km has an average slope (I) of about 0.96 m/km (or 9.6 %). This last slope conditions not only the speed of water in the channel but also the speed of flood wave and draft of the river. These slope data are essential variables for the calibration of hydraulic models for flood simulation.
4.2 Estimation of flood flows
4.2.1 Sampling and hypothesis testing
Using the Hyfran software (El Adlouni & Bobee, 2014), the sample was subjected to several hypothesis tests. Out of the three tests considered (Table 3), the independence and stationarity tests were validated at a threshold of 5 %, as opposed to an acceptance threshold of 1 % for the homogeneity test.
These results (Table 3) establish that the series of annual maximum values of daily flows (Fig. 6) consists of independent, homogeneous and stationary values. Therefore, the sample of annual maximum flows from Aboisso station easily meets the conditions for the application of the frequency analysis.
4.2.2 Fitting to probability laws
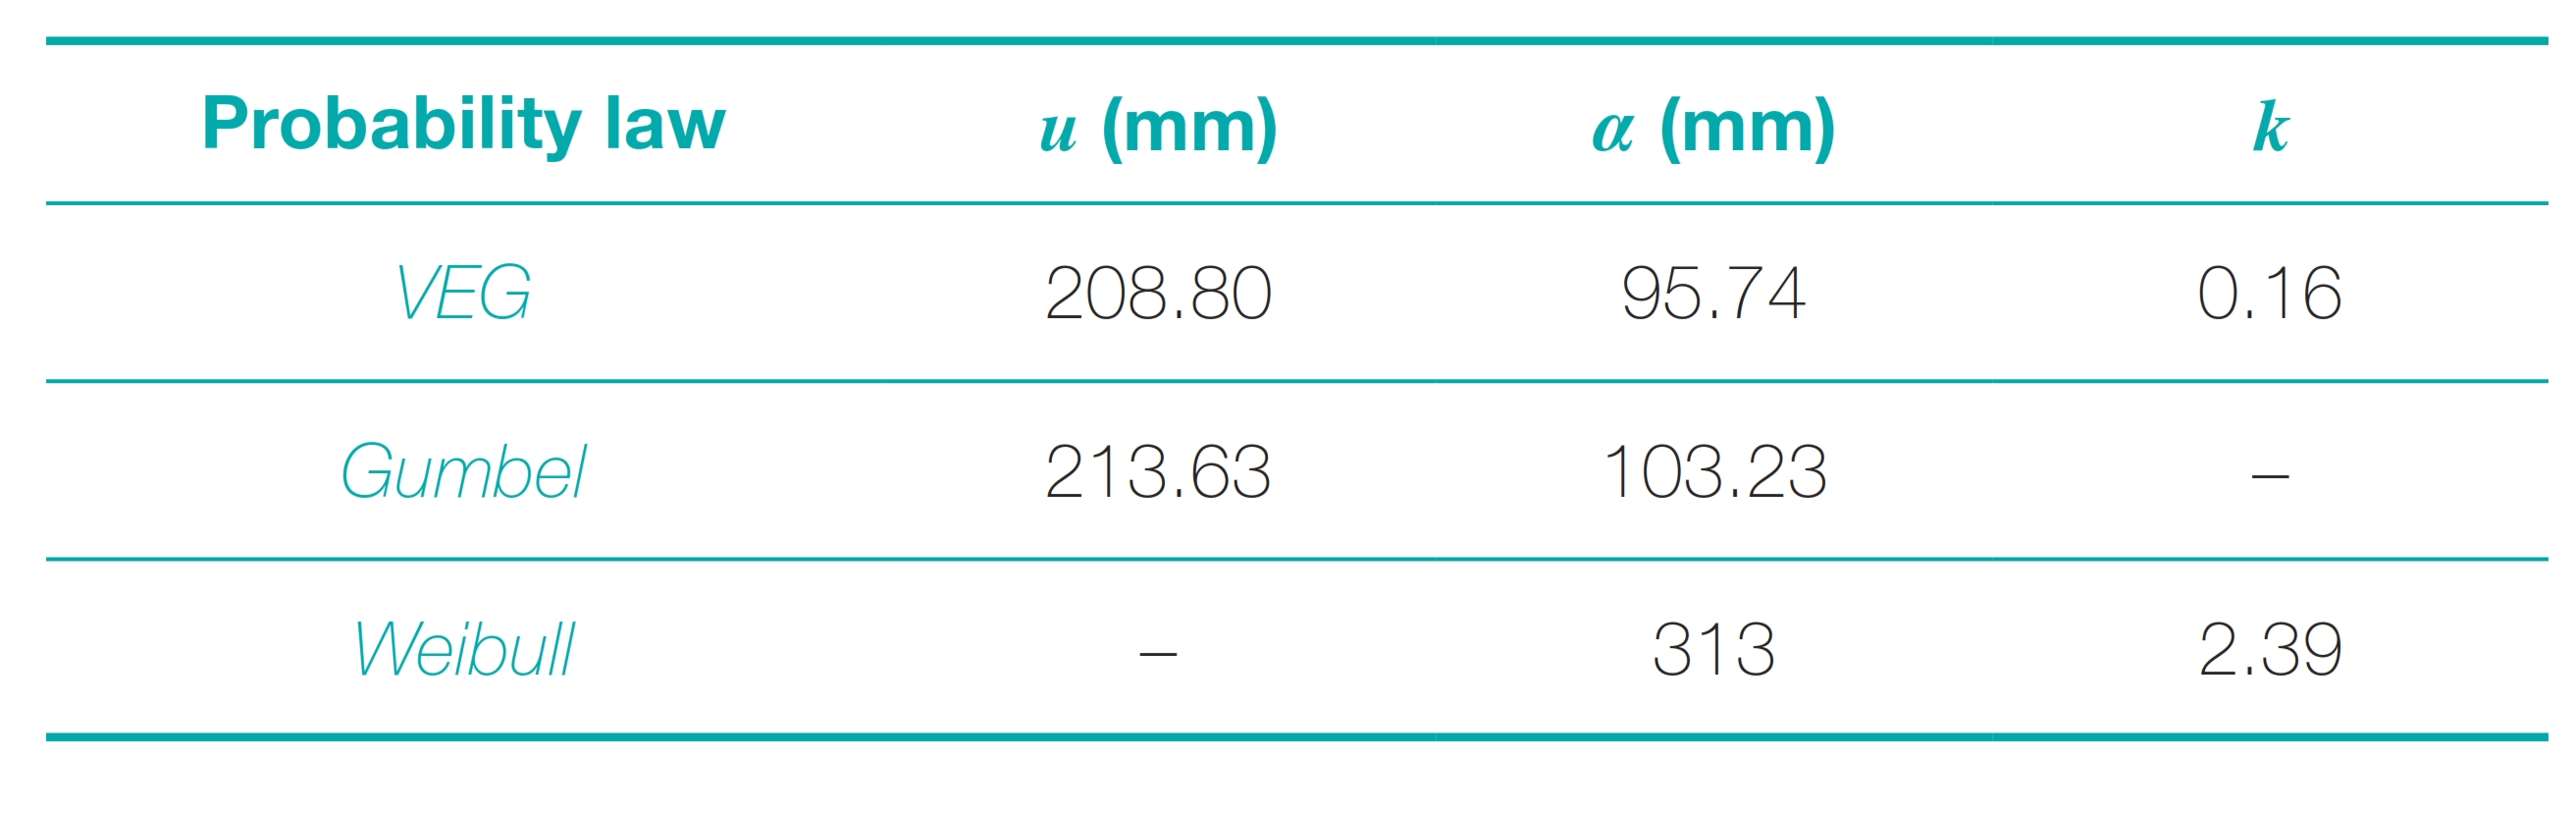
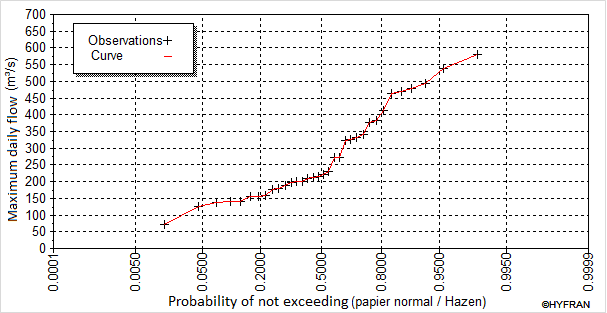
The Hazen frequency analysis model was used to describe the evolution of the empirical probabilities of the annual maximum flows of Aboisso hydrometric station over period 1950–1983 (Fig. 6). Also, the parameters of position (u), scale (α) and shape (k), of different distributions were evaluated according to the maximum likelihood and presented in Table 4.
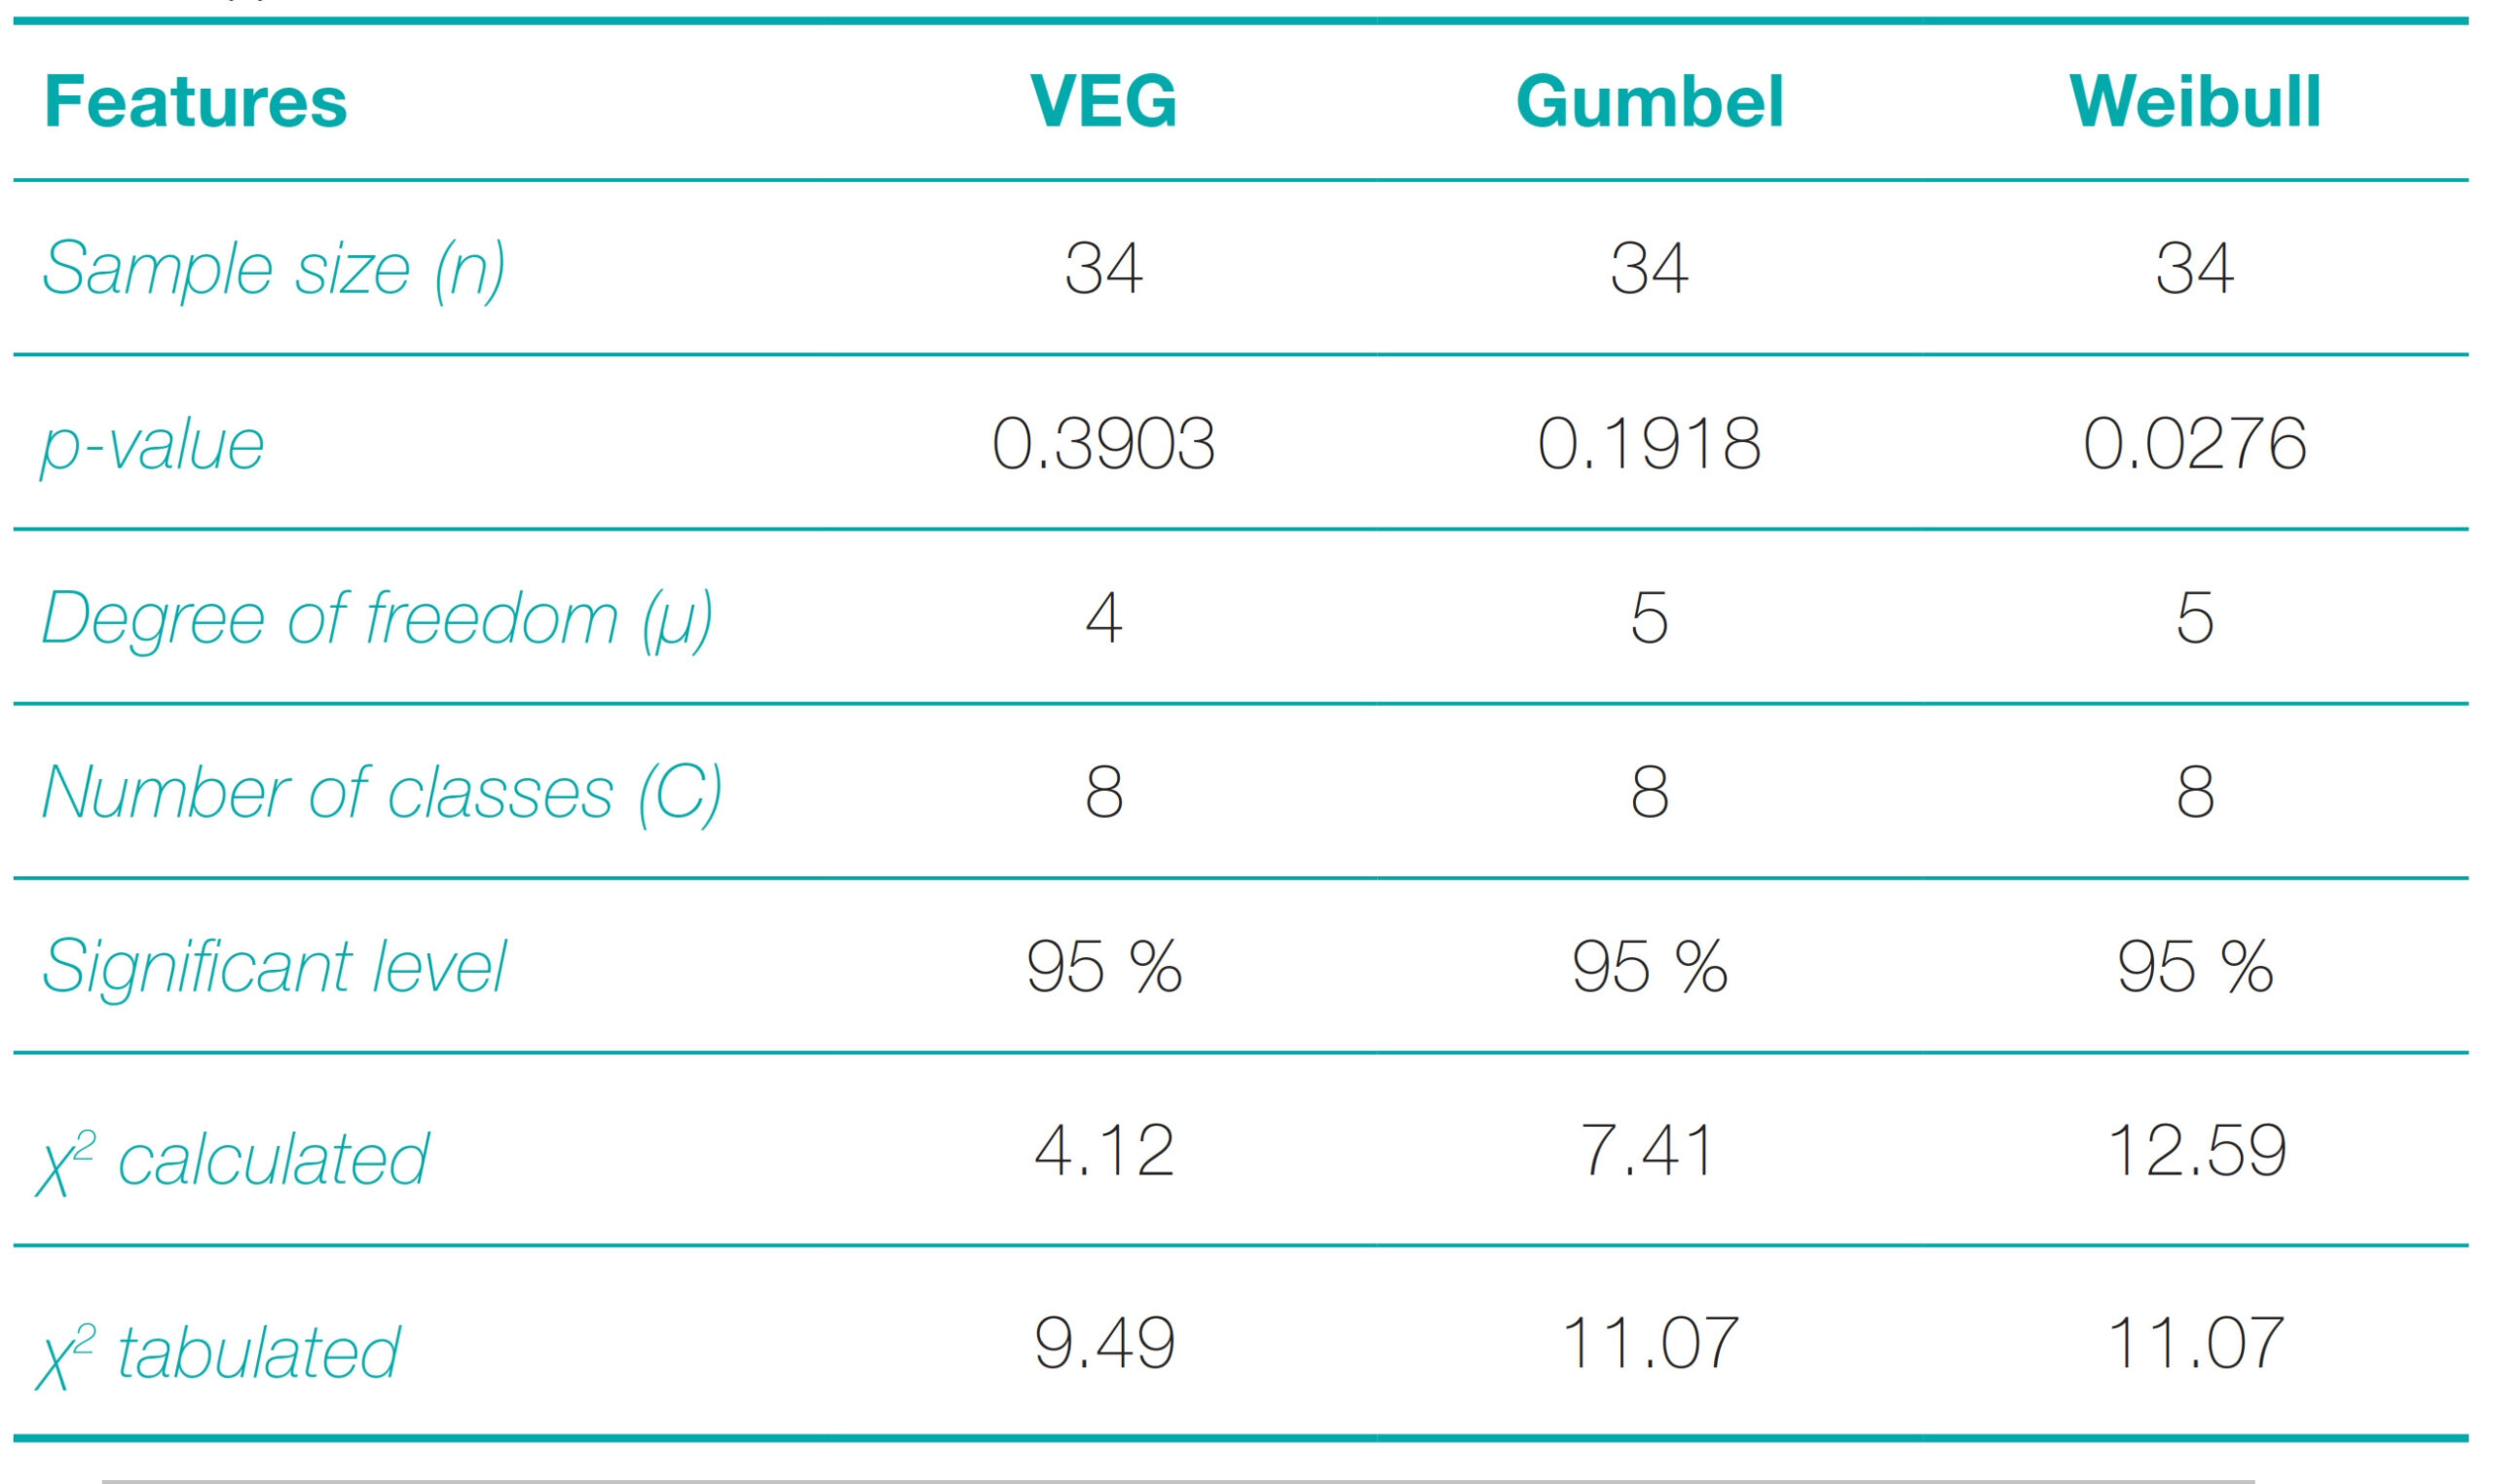
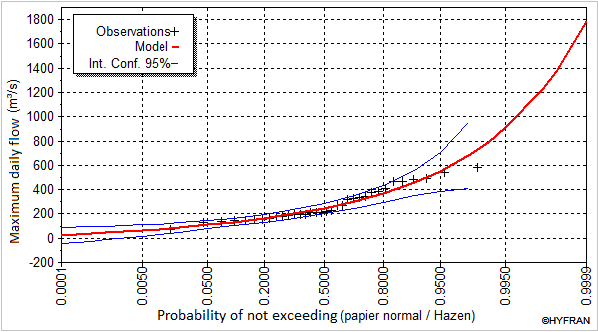
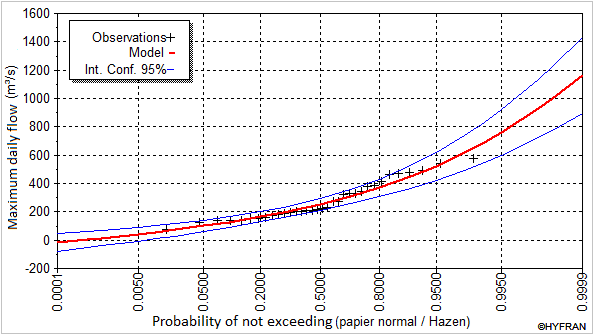
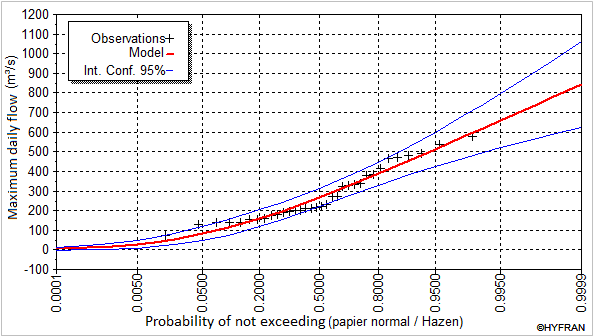
In addition, the fit of the different laws (VEG, Gumbel and Weibull) to the annual maximum flow series (Figs. 7, 8 and 9) was numerically evaluated using the Chi-square test of adequacy (Table 5).
This test verified the significance of empirical frequency differences between the sample data and the fits.
Thus, the results reveal that, for both Gumbel and VEG law fits, the calculated χ2 ≤ χ2 tabulated (Table 5). So, these fits are considered satisfactory and therefore the H0 hypothesis is accepted at the 5 % significant level.
With regard to the Weibull distribution fit, we find that calculated χ2 ≥ tabulated χ2 (Table 5). In this case, the H0 hypothesis is rejected at the 5 % significant level, but accepted at the 1 % significance level. Therefore, the fit is satisfactory at the 1 % significant level.
4.2.3 Choice of the analysis model and estimation of flood quantiles
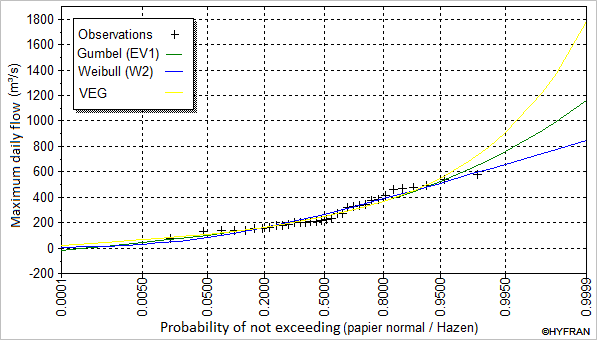
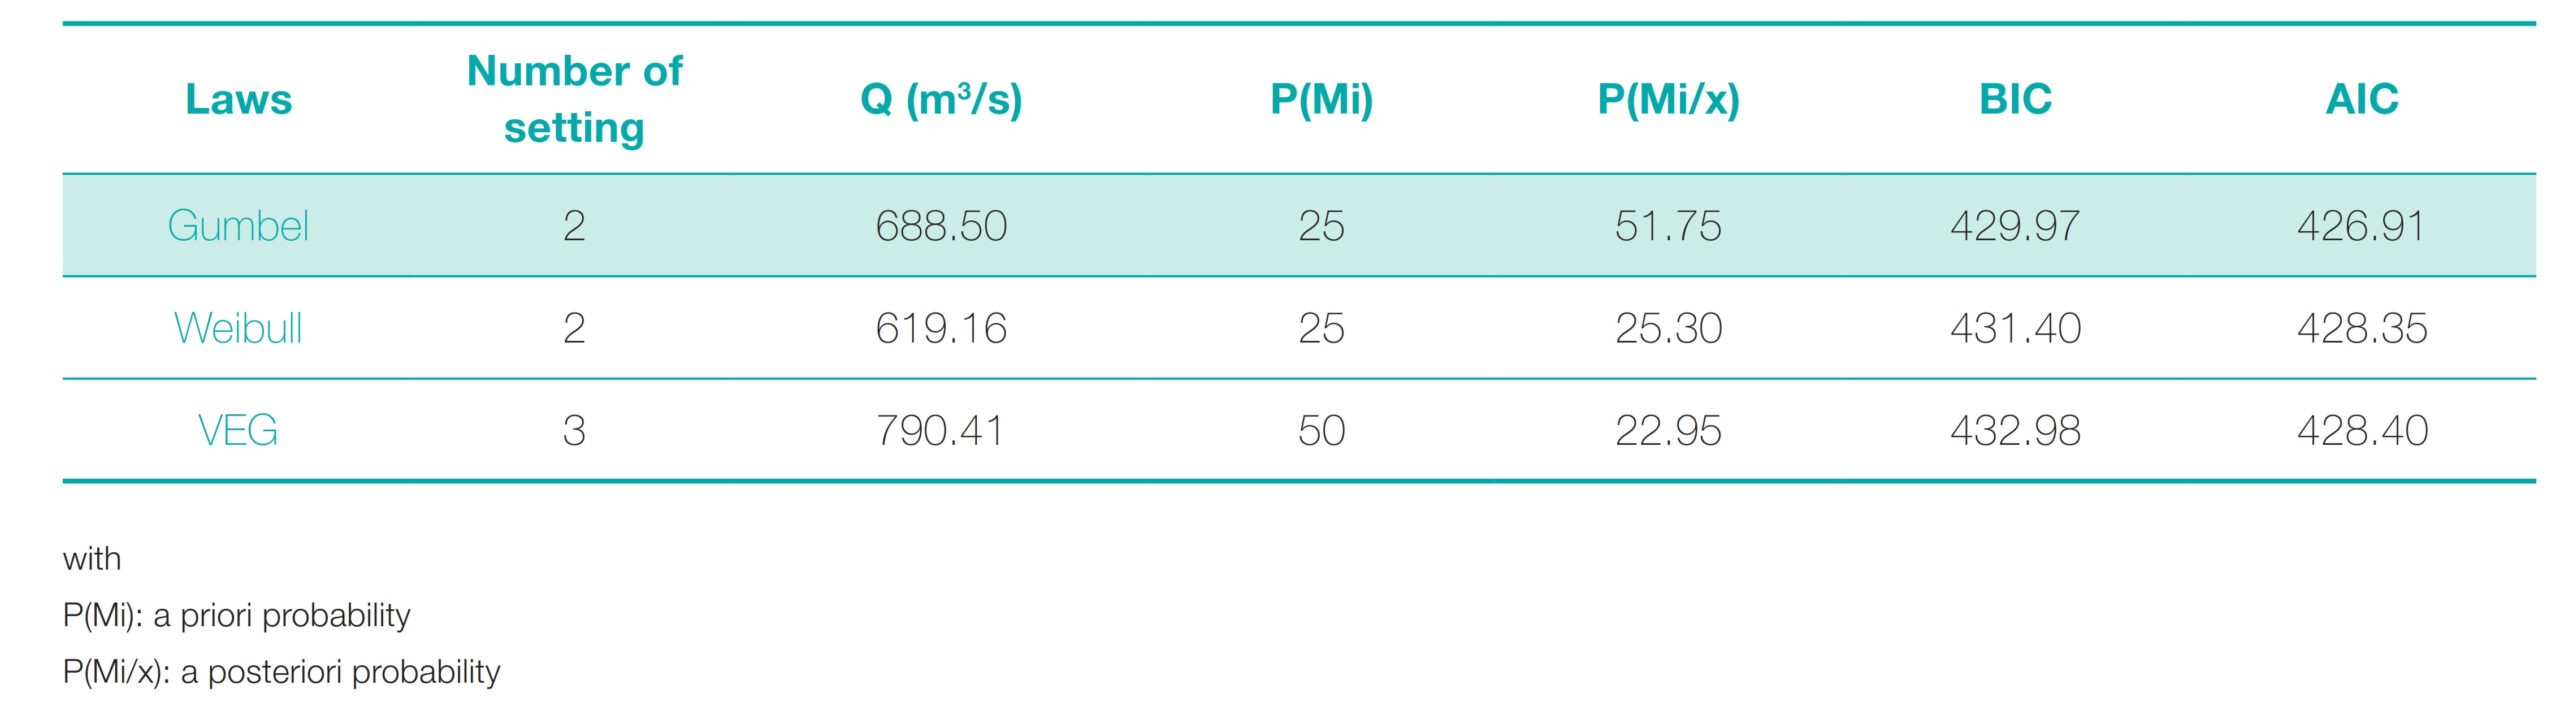
The different laws selected all fit, more or less, to the sample of annual maximum flows at significant levels of 1 % to 5 %. It is therefore appropriate to subject these fits to comparison criteria in order to deduce the most reliable and best suited to describe the flow values for extrapolation in this study. From the graphical comparison (Fig. 10), it can be seen that the Gumbel’s law fit is framed by the VEG and Weibull law fits.
This finding more or less indicates the ability of the Gumbel law to best fit the series of maximum sampled flows. In practice, the best fitting law is the one with the highest posterior probability P(Mi/x) and the lowest Bayesian Information Criteria (BIC) and Akaike Information Criteria (AIC). Thus, according to the results of the numerical comparison (Table 6), the Gumbel law with the values of BIC and AIC being respectively 429.97 and 426.91 are lower than those of the VEG and Weibull laws. The same observation is made for the posterior probability (P(Mi/x)) whose value associated with the Gumbel distribution (51.75) is higher than that of the other distributions. Finally, the graphical and numerical comparison criteria tested agree on the fact that Gumbel’s law remains the law that best fits the sample of annual maximum flows at the Aboisso hydrometric station.
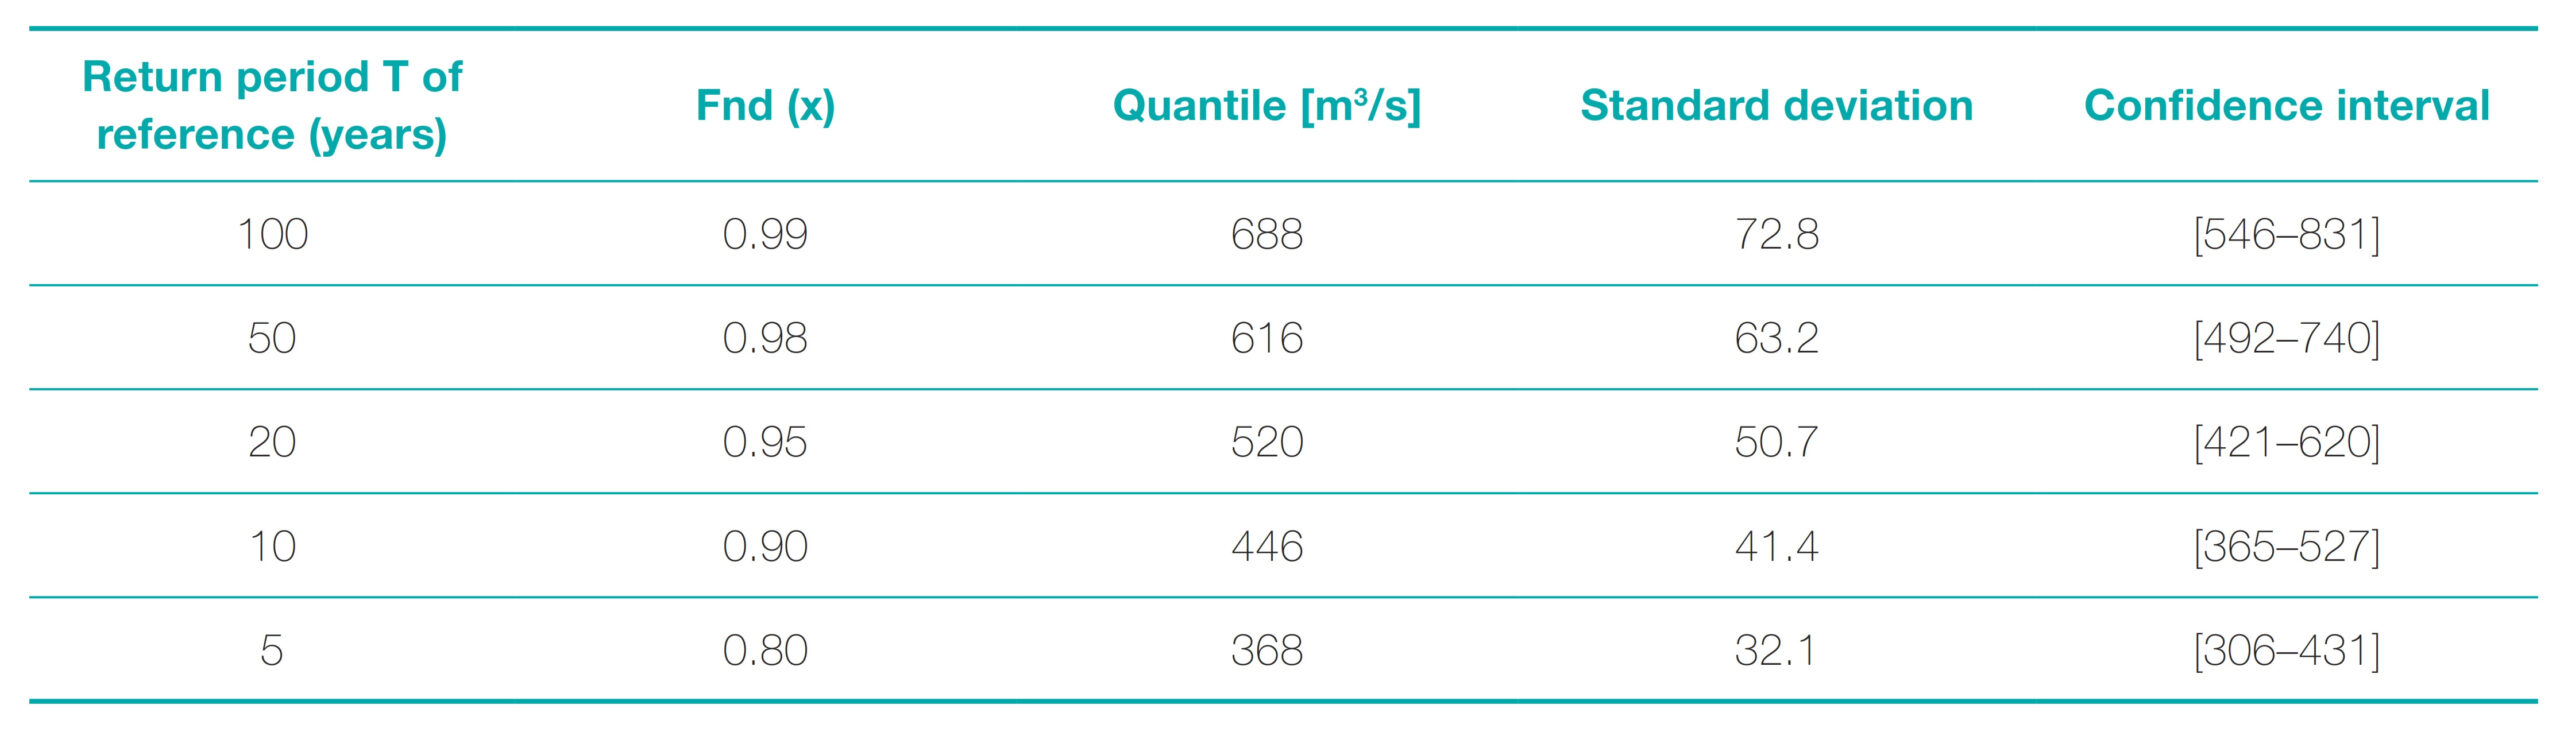
Consequently, the estimation of the flood quantiles from the subsequent Gumbel law adjustment is performed according to the return periods of T5, T10, T20, T50 and T100 years. Thus, for these return periods, the results of the respective quantiles (Table 7) vary between 368 m3/s (T5) and 688 m3/s (T100) and it is these quantiles which will be used not only as input data (initial conditions) of the hydraulic models of simulation of the extreme floods but also for the estimation of the probable spatial extents. Moreover, they will also be used for the dimensioning of hydraulic structures such as bridges, spillways of dams and the heights of protection dykes.
4.3 Discussion
4.3.1 Morphometric parameters of the watershed
The determination of morphometric parameters has made it possible to highlight a certain number of parameters influencing the flows at outlet. The Bia basin in Aboisso has an elongated shape (KG: 3.58), a moderate average slope (IW: 14.67 %) and a generally low relief. This elongated shape of the basin, which favors the slowing of storm water runoff from the watershed to the outlet, is in agreement with the results of the study by Konin et al. (2021) on the San Pedro River basin. Also, in the study of the simulation of the hydrological behavior of the Agneby watershed, Goula et al. (2009), determined that the average slope of the watershed was on the order of 12.5 % with an equally elongated shape. These shape and slope characteristics appear to be typical of small coastal river basins in Côte d’Ivoire.
4.3.2 Flood flow statistics
Due to the availability of hydrometric data over the study area for a 34-year period only for this study a method of frequency analysis is chosen which is favoured to use by several authors (Meddi & Sadeuk, 2014; Kouassi et al., 2018a) for the estimation of extreme hydropluviometric variables when the constraint of having at least 30 years of data available is met.The present analysis tested three laws (VEG, Gumbel and Weibul), however, given the results of the Chi-square goodness-of-fit test and the information criteria (AIC and BIC), the Gumbel model appears to be the most suitable for fitting our data. This model is particularly robust when it comes to the adjustment of extreme values of hydrometrical variables. Indeed, Kouassi et al. (2018a), after studying the ability of several laws to adjust the maximum annual rainfall at the Port-Bouët station, recommend the use of the Gumbel distribution for hydraulic design projects in the city of Abidjan. Furthermore, based on the studies of Goula et al. (2010) and Soro (2011), Gumbel’s law seems particularly adapted to humid tropical regions. However, it should be noted that there is no universal model, each model is adapted to certain types of climates or watersheds with a well-determined interest (Hachemi, 2017). Thus, the study by Kodja (2018) aimed at characterizing the indicators related to extreme hydroclimatic events in the Ouémé watershed at the Bonou outlet indicated that in terms of fitting maximum daily flows, the VEG law was more suitable in Sudanian area. Also, in the Algerian context, Mouas & Souag (2016) tested the effectiveness of seven distribution models to fit instantaneous maximum daily flow data from 28 stations. Based on the comparison criteria (AIC and BIC), they conclude that the Log normal distribution is the most appropriate for the humid region while the exponential distribution is preferred for the semi-arid and arid regions. The use of old hydrometric data (1950–1983) is one of the constraints encountered in this study because it might not reflect todays climatological conditions. In particular, hydrological studies have shown considerable impacts of climate change on runoff in West Africa. These decreases range from 30 % to 50 % or even 60 % in the major rivers (Niger, Senegal, Comoé and Volta rivers) after the 1987–1980 decade recognized in Africa as the period of hydro-rainfall disruptions (Kouakou et al., 2007; Panthou, 2013). Therefore, during the 1950–1983 period, the flows obtained are largely greater than expected today.
Another constraint must be seen in the construction of the Ayamé 1 (1959) and Ayamé 2 (1965) hydroelectric dams in the measurement period of the hydrometric data analysed in this paper. The building of the dam clearly has changed the hydrological andthe hydraulic conditions of Bia river which might be taken into account when using the statistical results.
Nevertheless, their use does not have a major influence on the long-term objective of this research namely to determine the extent and potential areas of influence of Bia-related flooding in Aboisso city.
5 Conclusion
The aim of this preliminary study was twofold. First, we aimed to determine the morphometric parameters of Bia watershed in Aboisso using a DTM and empirical formulas. Secondly, based on the statistical study of the maximum annual flows, we estimated the flood quantiles according to different return periods. The morphometric analysis reveals the Bia basin at Aboisso outlet has an elongated shape (KG: 3.58), a low relief (DS: 16.5) and all for an estimated concentration time of 45 hours. Parameters such as the average slope of watershed (IW: 14.67 %), the average slope of the main stream (IW: 9.6 %) being particularly important for the calibration of hydraulic models for flood simulation were determined.
With regard to the statistical study of the flows, it allowed us to identify the Gumbel law as the one that best fits the data, based on the frequency analysis applied to the sample of maximum annual flows. Thus, the associated flood quantiles were estimated to be 368 m3/s; 446 m3/s; 520 m3/s; 616 m3/s and 688 m3/s for return periods T5, T10, T20, T50 and T100 respectively.
Overall, this study offers the opportunity to have precise data and indicators in terms of studies related to hydraulic modelling. In particular, for the simulation of the spatial extent of the flood expansion field, flow velocities and water heights for the mapping of potentially floodable areas or for the dimensioning of hydraulic structures in Aboisso city.
References
Abidi S., Hajji O., Essaleh W., Ezzine A. and Hermassi T. (2019). Cartographie du risque inondation de la Haute Vallée de Medjerda avec Hec-Ras. Journal International Sciences et Technique de l’Eau et de l’Environnement (JISTEE), IV(1), 232–371.
Akaike H. (1974). A new look at the statistical model identification. IEEE transactions on automatic control, 19(6), 716–723.
Avahounlin R. F., Lawin A. E., Alamou E., Chabi A. and Afouda A. (2013). Analyse fréquentielle des séries de pluies et débits maximaux de l’Ouémé et estimation des débits de pointe. European Journal of Scientific Research, 107(3), 355–369.
EDF (1955). Monographie hydrologique du bassin de la Bia (Côte d’Ivoire). Électricité De France, Multigr, Paris, 30 p.
El Adlouni S. and Bobee B. (2014). Analyse Fréquentielle avec le logiciel HYFRAN-PLUS (version v2.1), 61 p.
Fadika A., Dao A., Noufe D., Bakayoko S. and Kamagate B. (2019). Essai de modélisation des écoulements d’un cours d’eau transfrontalier: la rivière Bia au sud-est de la Côte d’ivoire. Larhyss Journal, 39, 7–23.
Goula A., Kouadio Z. A., Kouakou K. E., N’go Y.A., N’doume C. and Savane I. (2009). Simulation du comportement hydrologique du bassin versant de l’Agneby, en Côte d’ivoire. Rev. Ivoir. Sci. Technol., 13, 91–113.
Goula B. T. A., Soro G. E, Dao A., Kouassi F. W. and Srohourou B. (2010). Frequency analysis and new cartography of extremes daily rainfall events in Côte d’Ivoire. J. Appl. Sci., 10, 1684–1694.
Hachemi A. (2017). Contribution à l’étude des crues de Oued Abiod (Biskra). Doctoral thesis, University of Mohamed Khider-Biskra, Algérie, 127 p.
Kodja D. J. (2018). Indicateurs des évènements hydroclimatiques extrêmes dans le bassin versant de l’Ouémé à l’exutoire de Bonou en Afrique de l’Ouest. Doctoral thesis in Geography. University of Montpellier, University of Abomey-Calavi (Bénin).
Konin N. J-C., N’go Y. A., Soro G. E., Ya K. F. and Goula B. T. (2021). Influence des facteurs hydro-morphostructuraux sur les inondations du bassin versant du fleuve San-Pedro, Côte d’ivoire. Rev. Ivoir. Sci. Technol., 37, 106–122.
Kouakou K. E., Goula B. T. A. and Savané I. (2007). Impacts de la variabilité climatique sur les ressources en eau de surface en zone tropicale humide : cas du bassin transfrontalier de la Comoé (Côte d’Ivoire-Burkina Faso). European Journal of Scientific Research, 16(1), 31–43.
Kouassi A. M., Nassa-karim R. A., N’guessan bi T. M., Kouame K. F. and Biemi J. (2018a). Modélisation statistique des pluies maximales annuelles dans le district d’Abidjan (sud de la Côte d’Ivoire). Revue des sciences de l’eau/Journal of Water Science, 31(2), 147–160.
Kouassi A. M., Nassa-Karim R. A., N’Guessan bi T. M., Kouame K. F. and Biemi J. (2018b). Caractérisation des débits d’étiage dans un contexte de changements climatiques : cas du bassin versant du N’Zi (Côte d’Ivoire). Agronomie Africaine, 30(3), 215–223.
Kouassi H. D., Tchibozo A. E., Vissin E. and Houssou C. (2014a). Analyse fréquentielle des évènements hydro-pluviométriques extrêmes dans le bassin de la Sota au Bénin. Afrique Science, 10(2), 137–148.
Kouassi H. (2014b). Risques hydroclimatiques et vulnérabilités des écosystèmes dans le bassin versant de la Sota à l’exutoire de Couberi. Doctoral thesis, Environment and Society, University of Abomey Calavi, 211 p.
Kouider A. (2003). Analyse fréquentielle locale des crues au Québec. Master’s thesis, University of Québec, 66 p.
Layan B., Dridri A., Benaabidate L. and Zemzami M. (2012). Détermination des crues de projet par les aspects du débit de pointe et de l’hydrogramme de crue au niveau de la commune Ain boukellal, bassin versant de l’Oued larbaa, Maroc. European Scientific Journal, 8(29), 209–220.
Meddi M. and Sadeuk B.-A. (2014). Analyse statistique et prévision des débits de crues dans le bassin versant de l’Oued Mekerra (Ouest de l’Algérie). Nature & Technologie, CSciences de l’Environnement, 10, 21–31.
Meledje N. H. (2015). Modélisation de la dynamique hydrologique et du flux des sédiments dans le lac du barrage hydroélectrique d’Ayame 1. Single thesis, University of Nangui Abrogoua, Cote d’Ivoire, 1307 p.
Mouas A. and Souag D. (2016). Analyse fréquentielle des débits de crues : Application aux bassins de l’Est Algérien, 4 p.
Panthou G. (2013). Analyse des extrêmes pluviométriques en Afrique de l’Ouest et de leurs évolutions au cours des 60 dernières années. Doctoral thesis, University of Grenoble, France, 235 p.
Roche M. (1963). Hydrologie de surface. ORSTOM, Gauthier-Villars, Paris, 431 p.
Saidi M.E. (2013). Apport des logiciels de SIG dans la morphométrie des bassins versants l’exemple d’ArcGIS. Guide méthodologique d’utilisation. University of Cadi Ayyad Marrakech, 9 p.
Schwarz G. (1978). Estimating the dimension of a model. The annals of statistics, 461–464.
Soro G. E. (2011). Modélisation statistique des pluies extrêmes en Côte d’Ivoire. Doctoral thesis, University of Nangui-Abrogoua, Abidjan, 172 p.
Tanguy M. (2012). Cartographie du risque d’inondation en milieu urbain adaptée à la gestion de crise. Analyse préliminaire. Doctoral examination in Water Sciences, National Institute for Scientific Research, Québec, 103 p.
Werren G. and Lasri M. (2014). Cartographie du danger d’inondation guide pratique pour l’application de la méthode suisse au Maroc. 22 p.
Yahiaoui A. (1997). Contribution a une étude comparative des méthodes d’estimation des crues. Cas du bassin versant de l’Oued Minaw, Relizane. Magister’s thesis, Blida National School of Hydraulics, Algérie, 120 p.
Yahiaoui A. (2012). Inondations torrentielles: cartographie des zones vulnérables en Algérie du nord (cas de l’oued Mekerra, Wilaya de Sidi Bel Abbès). Doctoral thesis, University of Bechar, 168 p.
Authors’ biographies

Abdoulaye Maïga, born in 1995, is of Ivorian nationality. He works in the field of cartography and Geographic Information Systems. Initially trained in Geographic Sciences, in 2021 he obtained a research Master’s degree in Physical Geography at the UFHB of Cocody (Abidjan-Côte d’Ivoire). Since 2022, he has also graduated from the INP-HB of Yamoussoukro (Côte d’Ivoire) in Environment and Hydrological Risks. He has a keen interest in environmental issues, water resources and hydrological risk management. He is currently waiting to enroll in a doctoral program.

Daouda Sylla was born in Odiénné, Côte d’Ivoire. In 2000, he received a M.Sc. degree of Physical Geography at the Institute of Tropical Geography (IGT) from University Félix Houphouët-Boigny (UFHB, Côte d’Ivoire). In 2003, he obtained two Diplomas of Advanced Studies: one in Physical Geography at the IGT and the other in Remote Sensing and GIS at the CURAT from UFHB. In 2012, he obtained a Ph.D. degree in Remote Sensing at the University of Sherbrook (CANADA) and since 2013, has joined the IGT as associate professor. SYLLA main research interests concern, Environmental vulnerability to soil degradation, changes in semi-arid environments, Radar and optical data fusion.

Célestin Hauhouot is a graduate of the University of Nantes (France), where he obtained a doctorate in Geography in 2000. Since then, he has been a research lecturer at the University Félix Houphouët-Boigny in Abidjan, Côte d’Ivoire. Célestin HAUHOUOT is currently the Director of the Environment and Society Laboratory. His main scientific interests are the anthropisation of natural environments, climate change and natural coastal risks.
- Downloaded from https://earthexplorer.usgs.gov/ (accessed 20 Sep. 2023).