
Abstract
1 Introduction
The oil industry is a key driver in the global economy in the hydrocarbon production chain destined to satisfy our energy requirements for fuels and derived products for transportation, industrial energy, lubricants and other uses. The unfortunate reality is that spills do occur throughout the world, and Peru is no exception. On January 15, in front of the La Pampilla Refinery, in the district of Ventanilla, more than 6,000 barrels of oil spilled into the sea. Remote Sensing techniques can be used to quickly identify change after an oil spill by use of optical and radar imagery. The objective of this study is to identify and compare, using different types of remote sensing, the hydrocarbon spill over the sea, using multispectral satellite and radar images.
2 Methods and materials
2.1 Area of interest
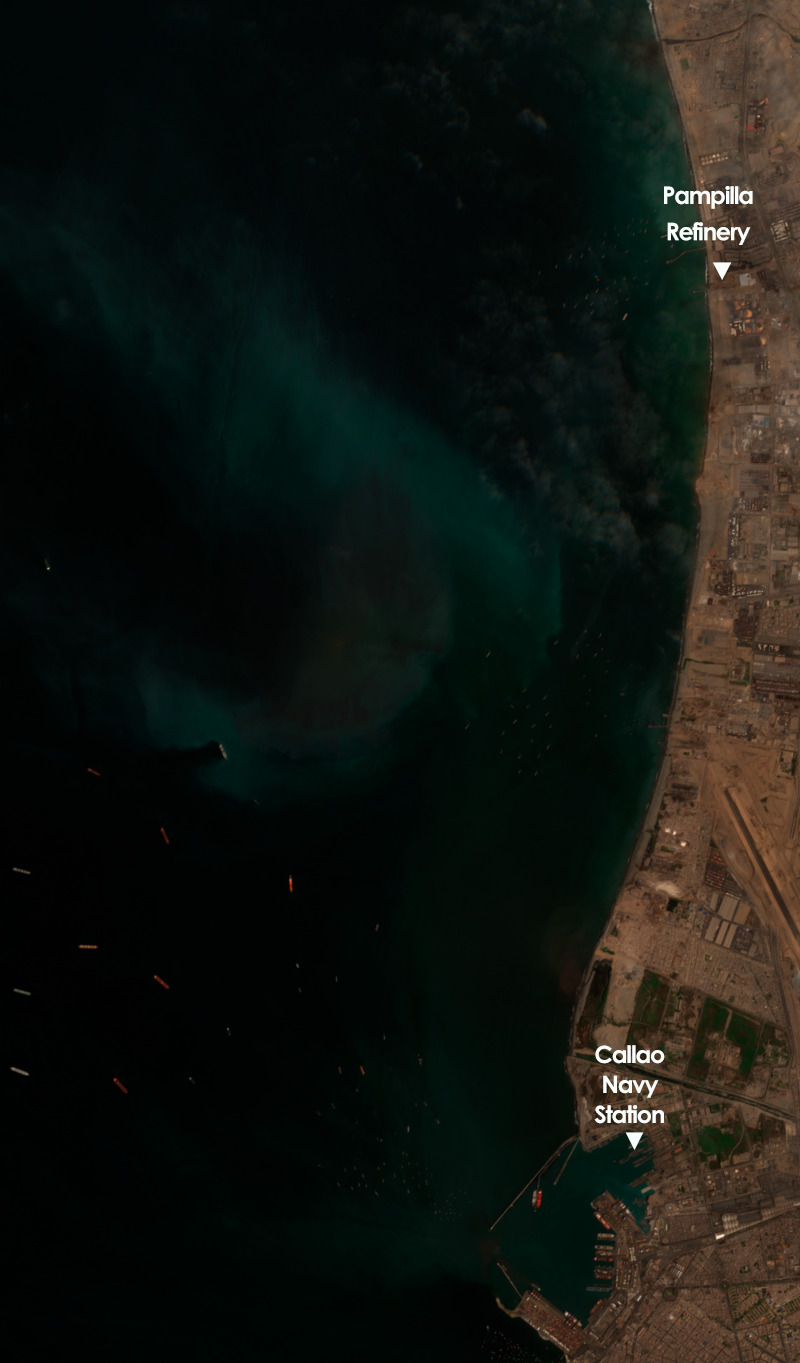
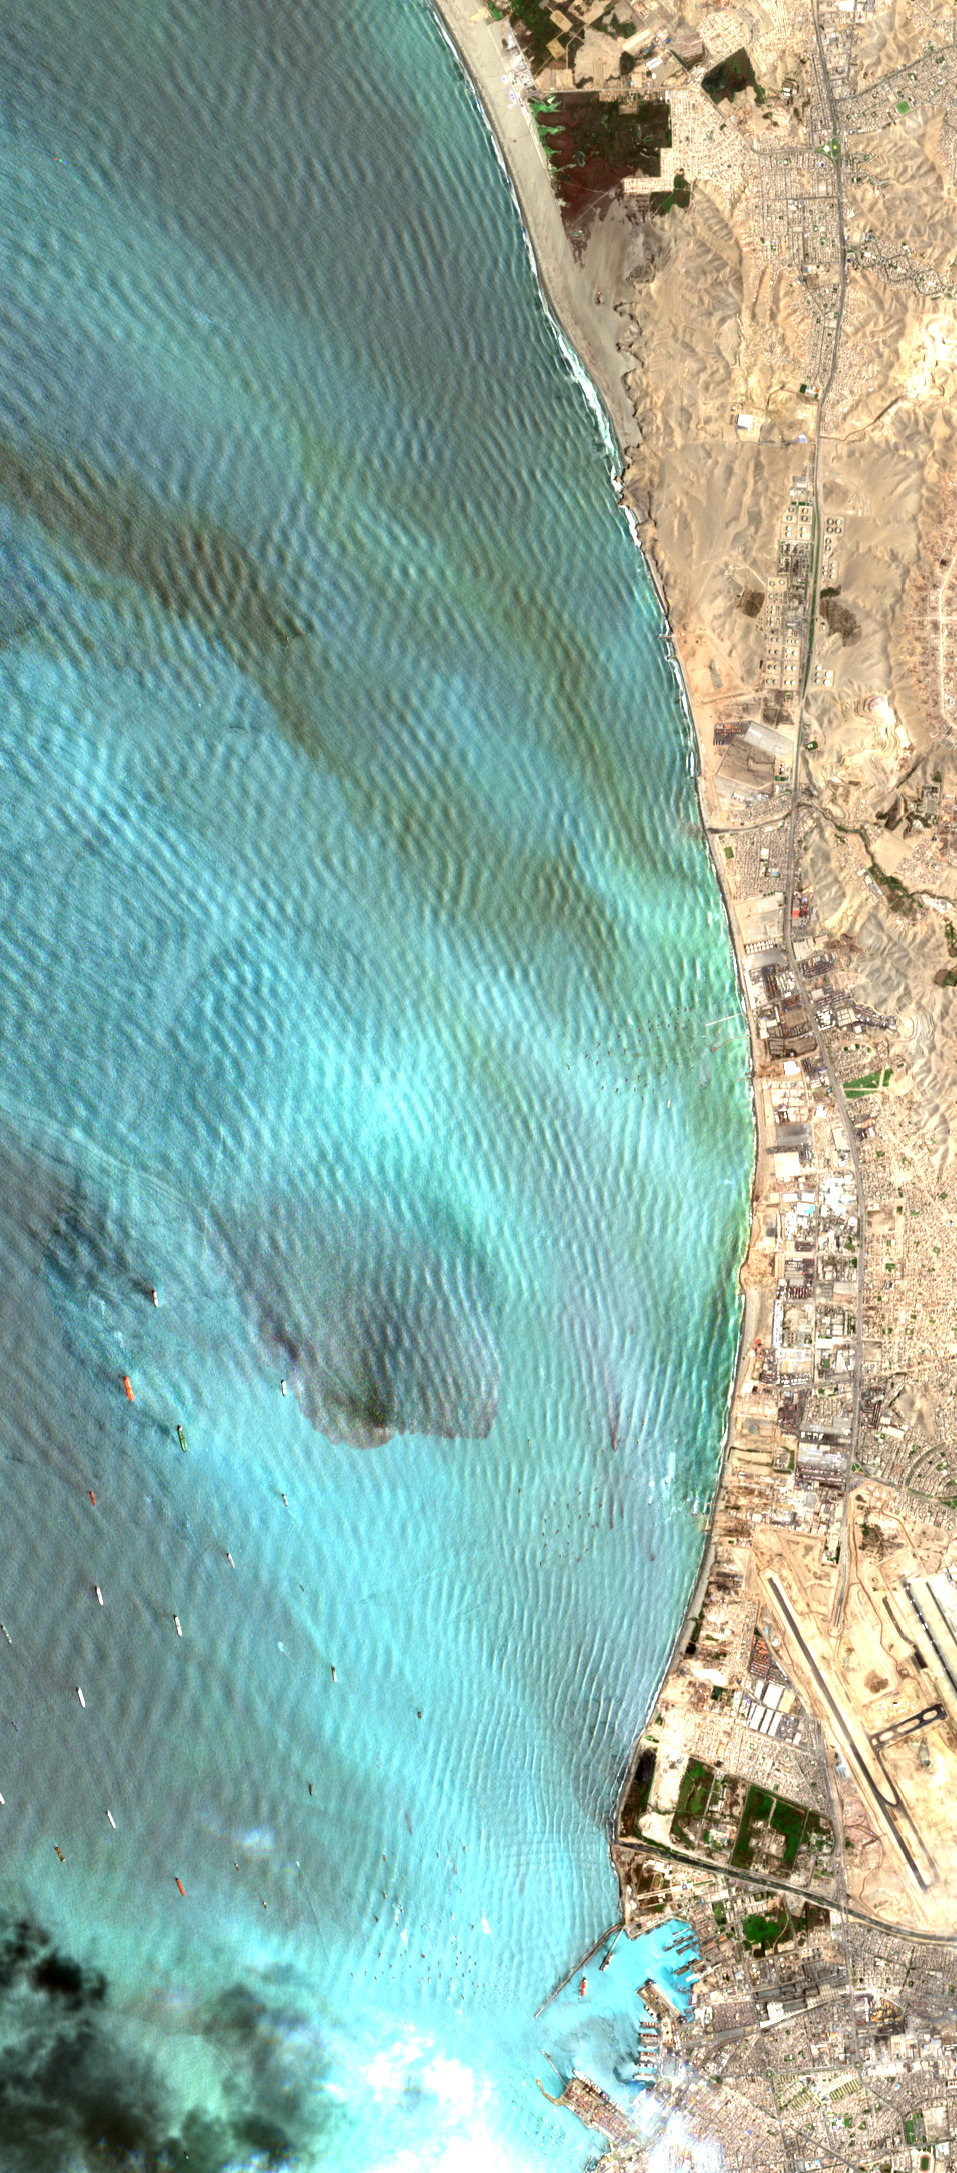
The oil spill occured in a part of the Pacific Ocean belonging to the district of Ventanilla in the constitutional Province of Callao in the Department of Lima, between coordinates 12.216 S, -77.887 W and -11.005 S, -77.023 W (Fig. 1). This is the area of operations of the La Pampilla Refinery, which is operated by the transnational company Repsol.
2.2 Hardware and software
To carry out this work, the following materials were required:
- Optimized workstations
- Catalyst Professional Software, ArcGIS 10.8.1, SNAP 8.0.
- Multispectral satellite images Sentinel-2, Peru- SAT-1 and Sentinel-1A radar
2.3 Imagery
The imagery used were multispectral images (MSI) from the following sources:
- PerúSAT-1 satellite, dated 23 January 2022, 25
- January 2022 and 27 January 2022
- Sentinel-1 radars, dated 2 February 2022
- Sentinel-2 satellite, dated 2 February 2022
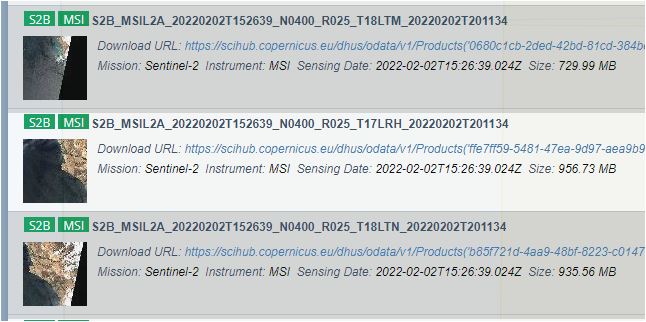
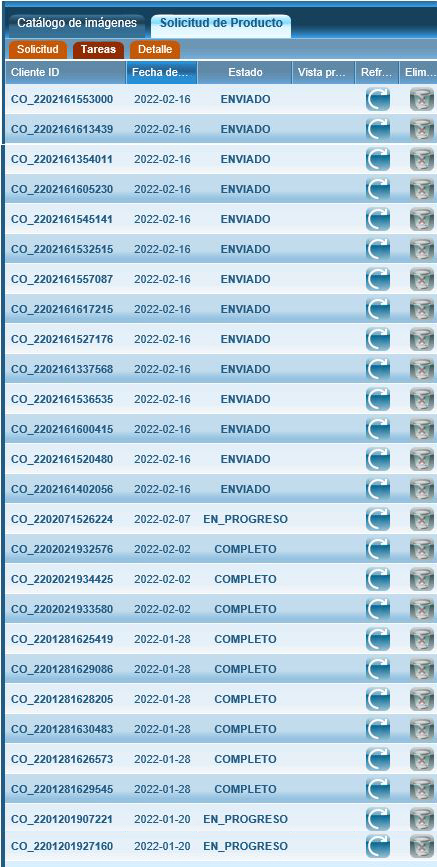
The Sentinel satellite images were downloaded from the European Space Agency (ESA) Copernicus Open Access Hub server (Fig. 2). The images of the Peruvian satellite PeruSat-1, were downloaded from Customer Office Home Page (COF) server1, using a username and password (Fig. 3).
2.4 Image pre-processing
2.4.1 Sentinel 1A
Due to the failure that the Sentinel 1B satellite has experienced since mid-December 2021, the Sentinel 1A images were used with the IW (Interferometric Wide Swath) acquisition mode and a GRD (Ground Range Detected) processing level, processed using SNAP (Sentinel Application Platform) developed by the ESA.
Geometric correction
This correction allowed us to remove the distortions that occurred due to the shape of the terrain and its orientation with respect to a reference ellipsoid, in this case WGS84.
Using the SNAP software tools, the Radar mode had the option ‘Geometric Ellipsoid/ Correction/ Geolocation-Grid’. This procedure performed a resampling of the pixel values with the world coordinate system WGS84.
Salt and pepper “speckle” effect
Due to the interference of the receiving waves of the radar sensor, the quality of the image can be degraded and show a mottled texture called salt and pepper “speckle” effect. This was corrected using the Radar mode tool and the Speckle Filter/ Multi-Temporal Speckle Filter option with SNAP software from ESA.
After making the corrections, the images were shown in their different polarizations – Vertical-Horizontal (VH) and Vertical-Vertical (VV).
2.4.2 Sentinel-2B
The Sentinel-2B satellite has sensors onboard which collect information throughout the electromagnetic spectrum. The electromagnetic spectrum is broken down into 13 bands.
Spatial subset (image crop)
Sentinel 2 images cover 290 m2. In order to minimize processing time, the image was cropped using a spatial subset tool. The “Subset Tool” allows the user to cut images including their different spectral bands. The procedure can be carried out under the “georeferencing” method manually by geolocating the pixels or using geographic coordinates.
Resampling
Sentinel-2 images have 12 bands of different resolution, and some bands were removed to standardize the resolution, the bands that were eliminated were those whose resolution is greater than 20 m.
Spectral band composition
The spectral response of the surfaces is based on the amount of energy that can be reflected, this reflectance is what the different sensors can capture. They can be captured without being perceived by the human eye, as is the case of bands infrared and thermal allows detecting and monitoring the temperature of spills and surrounding areas. This is crucial because oil spills can generate heat due to chemical reaction with water or exposure to the sun.
NDVI
Is an indicator used in satellite images to evaluate the health and density of vegetation in a given area. Is calculated from measurements of the reflectivity of the Earth’s surface in two bands of the electromagnetic spectrum. The basic equation to obtain NDVI is:
| (1) |
with
NIR: near infrared band
RED: red band
It is not so necessary to carry out an NDVI to determine a hydrocarbon spill in the sea since this method is used to evaluate vegetation density, but when using it we can visually see some graphic variation in the satellite image.
2.4.3 PeruSAT-1
This optical satellite has a spatial resolution of 0.7 m in panchromatic mode and 2.8 m in multispectral mode. It allowed us to obtain information about the territory because of its temporary resolution or revisit period of 26 days.
Atmospheric Correction
The objective of making the atmospheric correction was to remove the atmospheric effects of the terrain, in order to obtain the reflectance values of the surface. This correction is important for comparing satellite images from different dates and sensors.
For this we used the ATCOR tool of Catalyst Professional software. The ATCOR tool allowed us to perform radiometric corrections, fog and cloud masking, adjustments with a digital elevation model and choose what type of aerosol corresponded to the area of interest.
3 Results
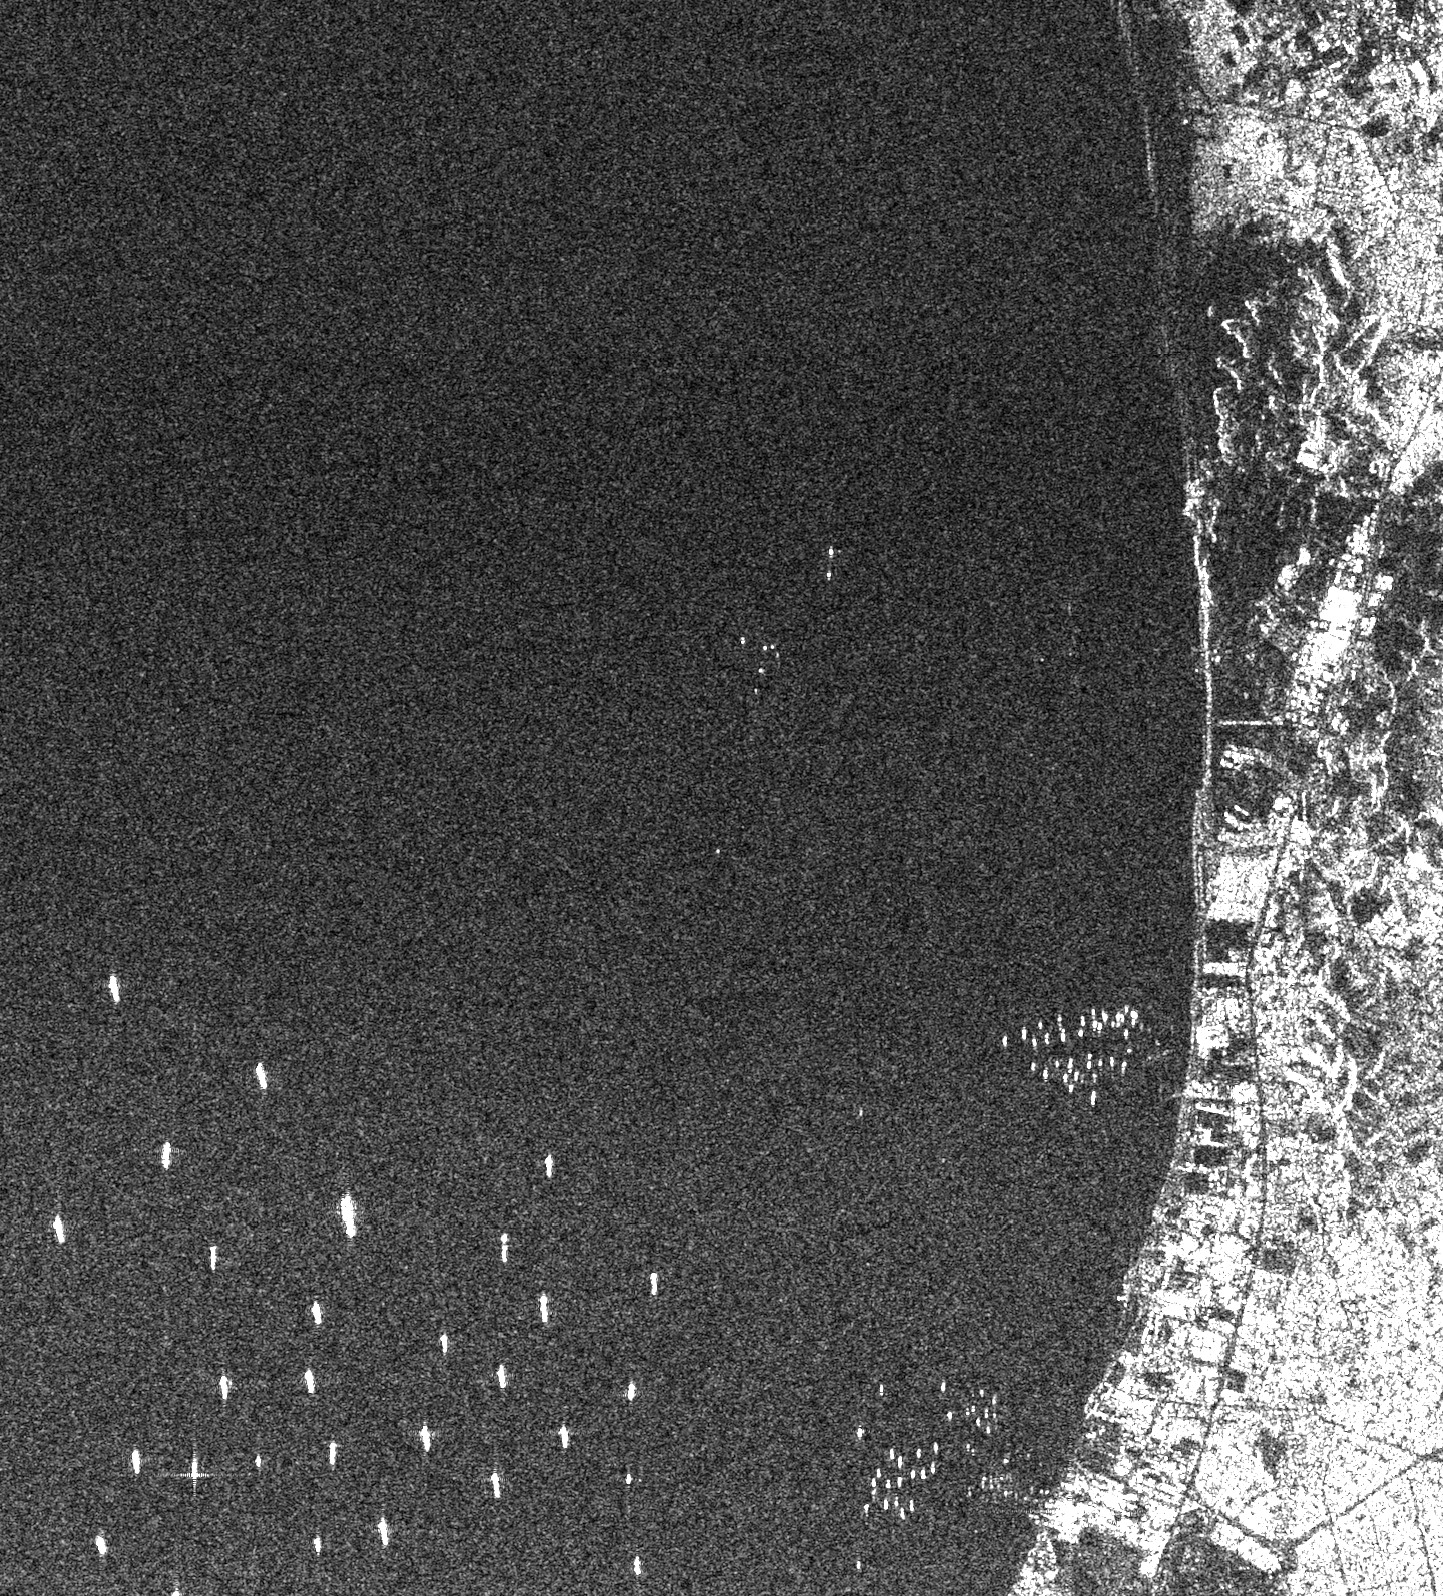
3.1 Sentinel-1
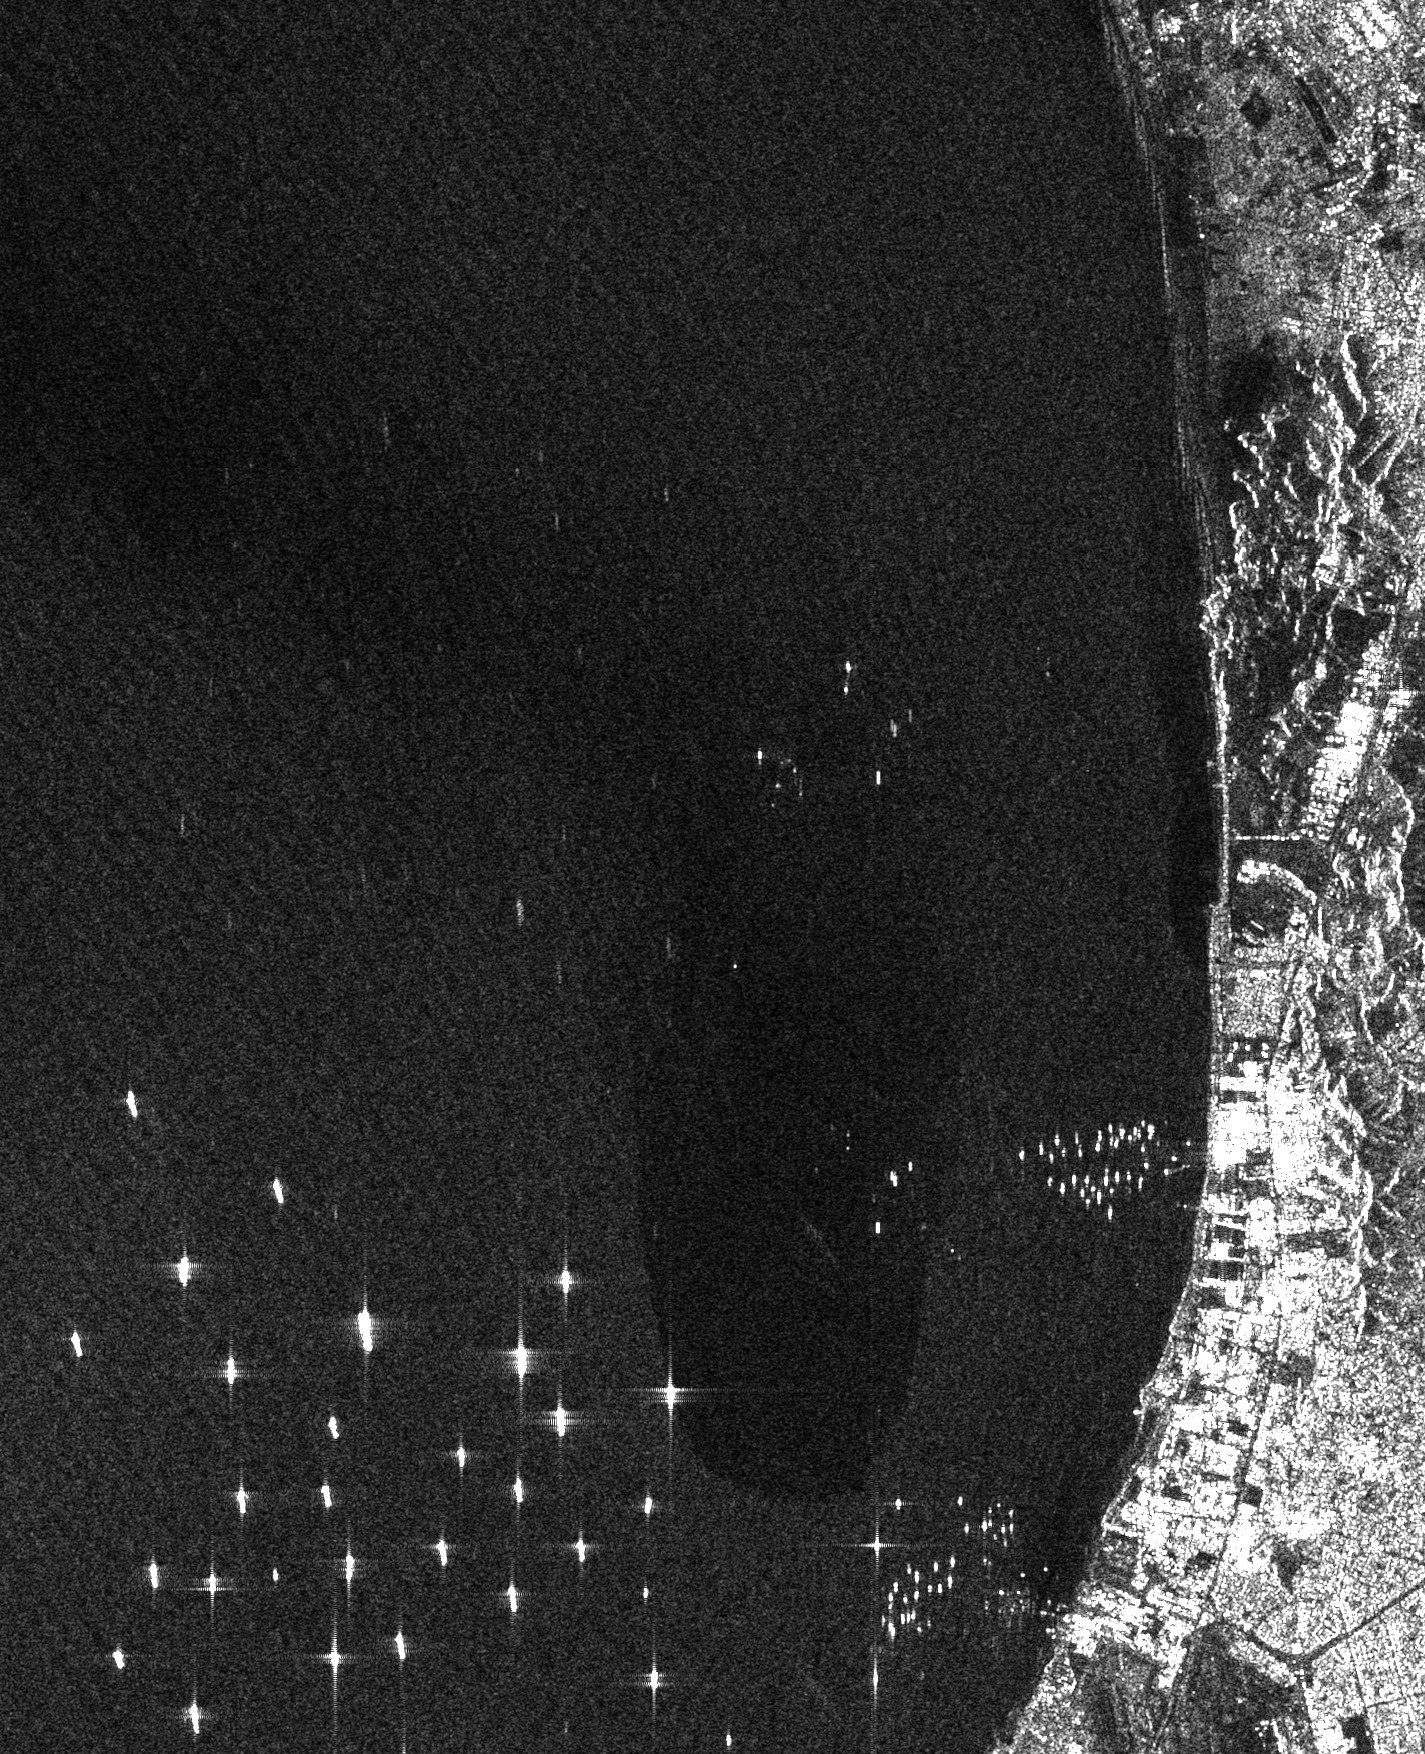
The results of processing the Sentinel-1 imagery are shown in Fig. 4. The right-side image shows a concave-shaped stain that, due to the VV (vertical) polarity, highlights the variation on the surface due to the oily property of crude oil. The image on the left shows greater opacity because it is horizontal in polarity, it does not highlight the variation in the surface.
3.2 Sentinel-2
3.2.1 Visual
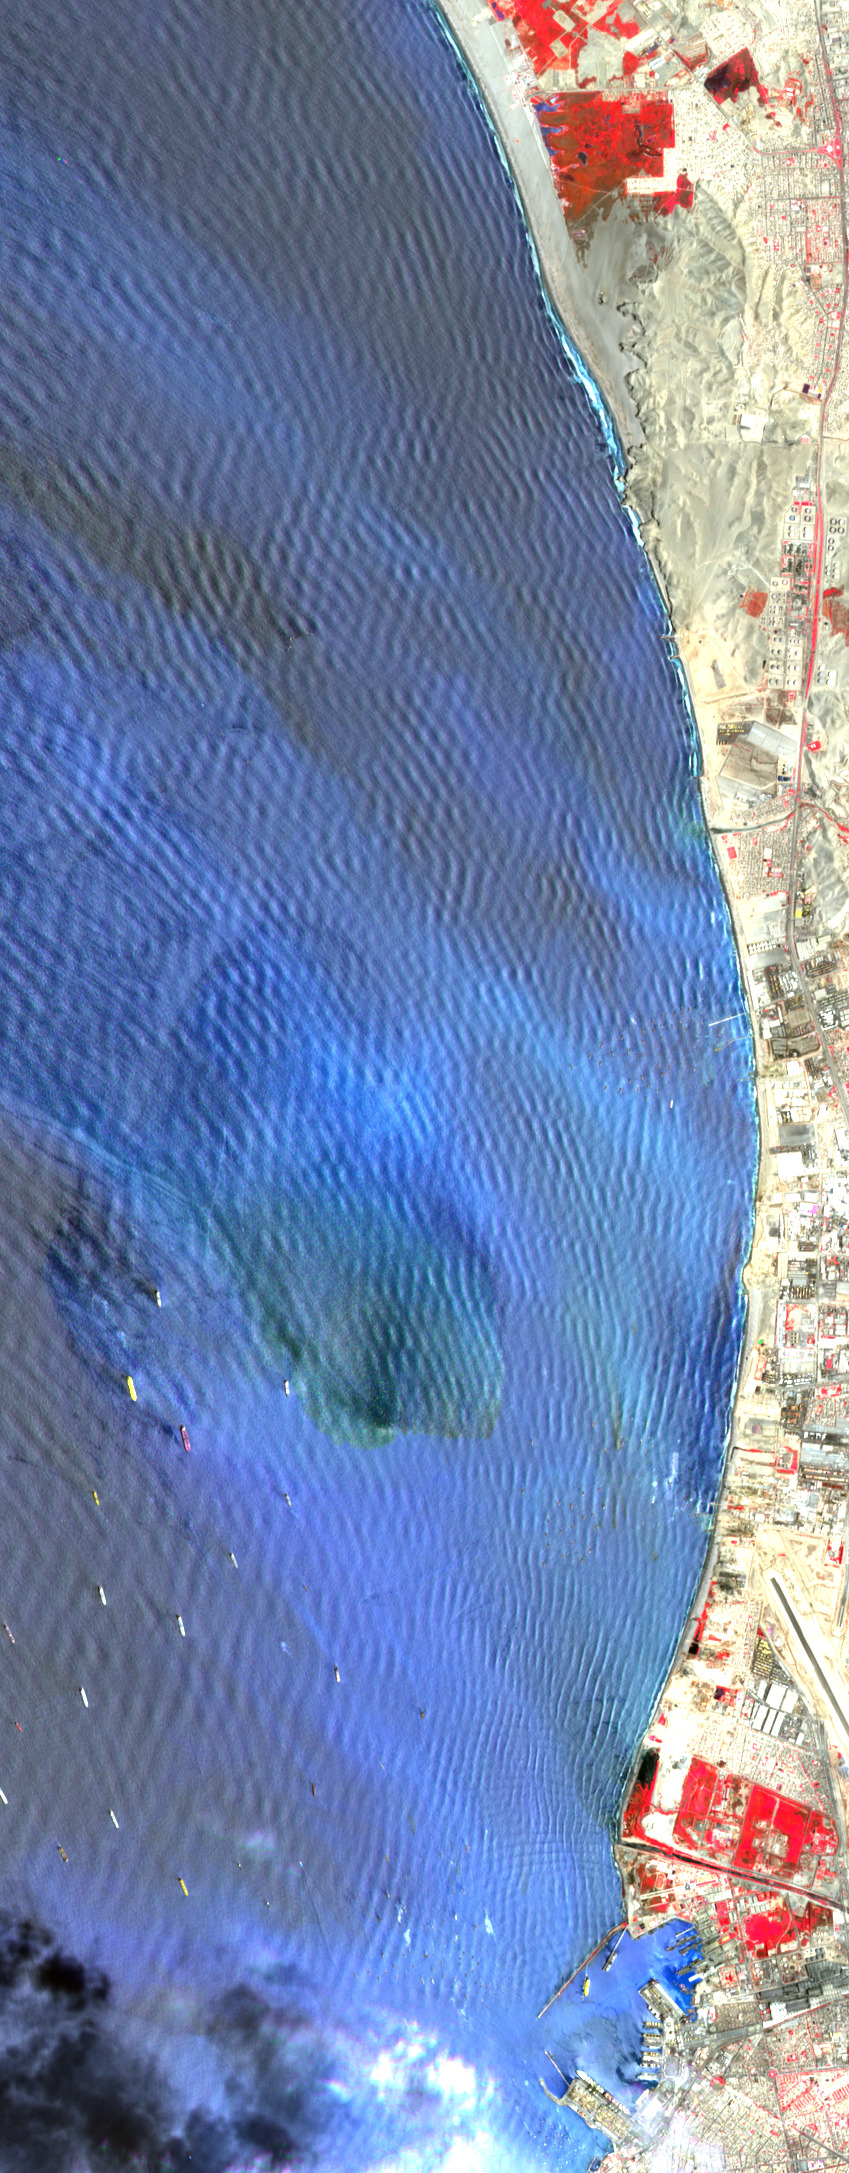
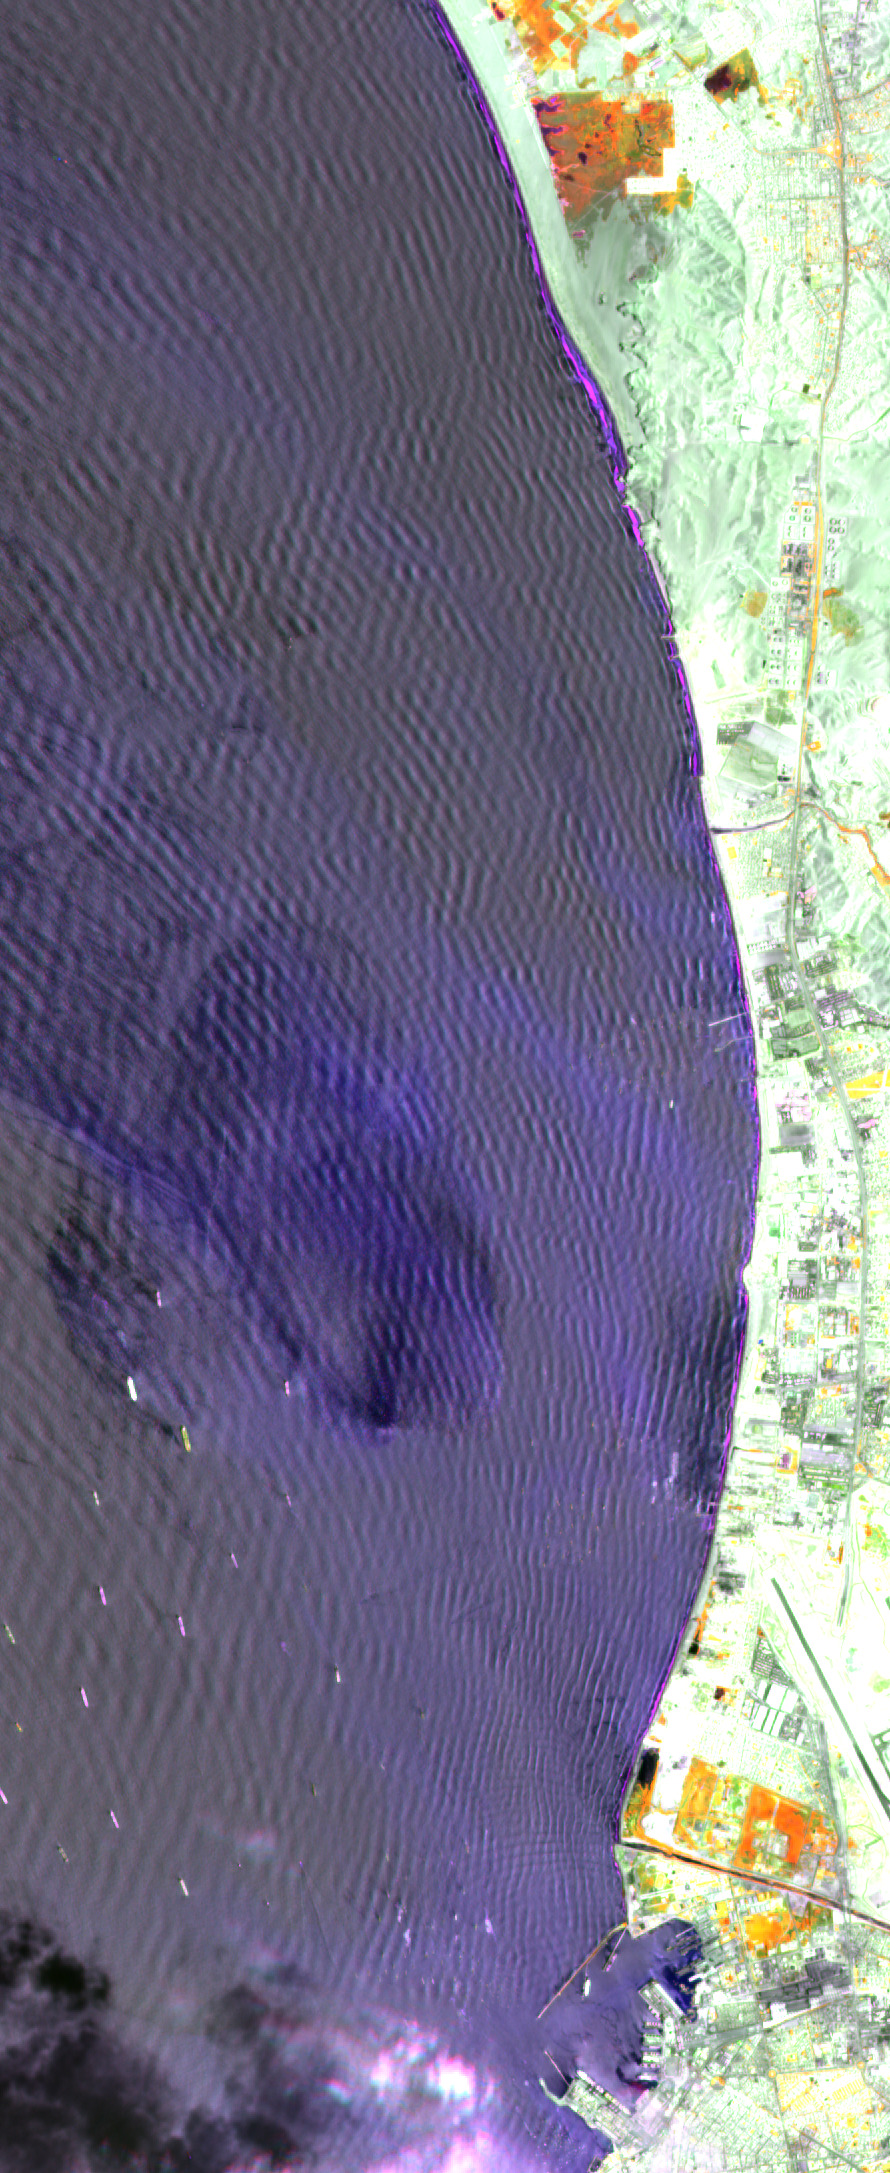
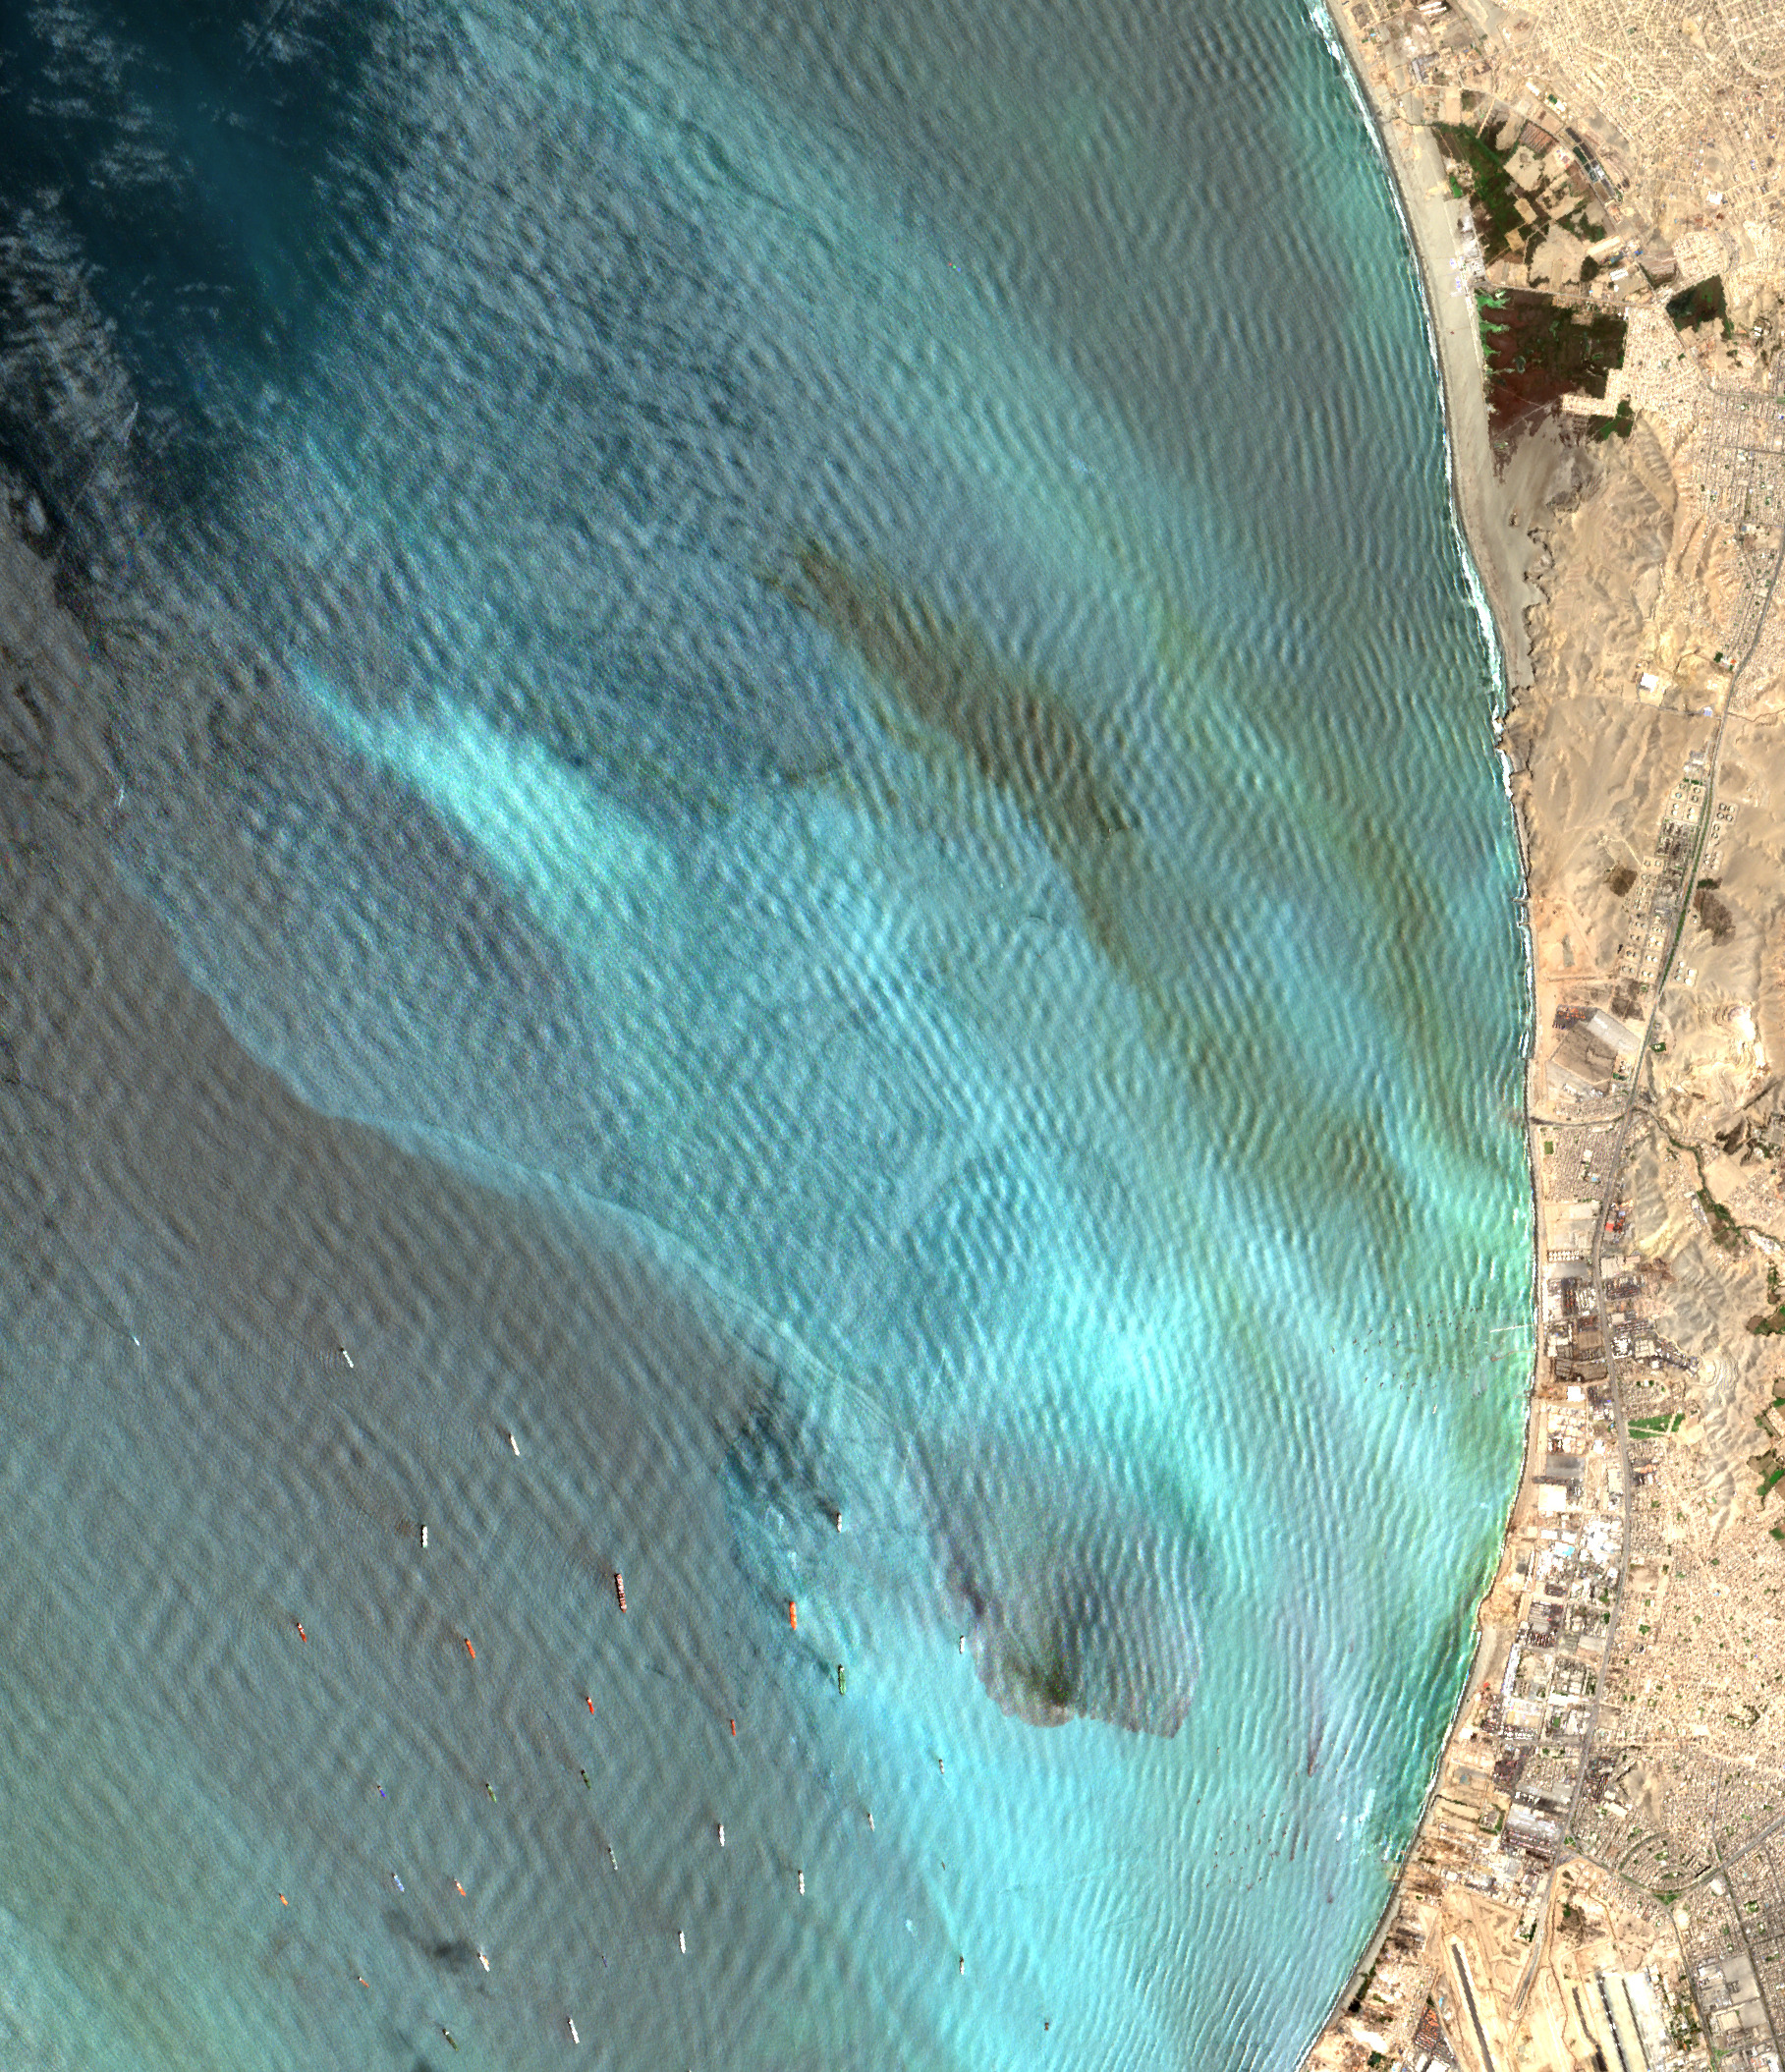
The results of the visual comparison of Sentinel-2 imagery are shown in Fig. 5, as follows: The left-side image was a combination of the spectral bands where B8 in red, B4 in green, and B3 in blue. The centre image depicts the combination of spectral bands B8 in red, B11 in green and B4 in blue. The third com- position is the combination of the bands where B4 in red, B3 in green, and B2 in blue. This combination is known as Natural Color or True Color. A comparison of the three different compositions revealed that the natural color combination most clearly identified the oil slick, by better definition of its shape and color.

4. Discussion
4.1 Comparison between Sentinel-1 and Sentinel-2
A comparison was also made between processed images of the Sentinel 1 and Sentinel 2 satellites. In this satellite image comparison, the oil slick can be identified in both the multispectral and radar images. In all images, it can be defined as a concave morphology, with a better defined shape show in the radar image because this type of image identifies the variation in the shape of the surface and not in its composition (water-oil mixture).
In both images in Fig. 6, the limitation was access to the images, which were based on temporal resolution. The images of the Sentinel-2 have a revisit every 5 days. The images of the Sentinel-1 have a revisit every 12 days. Both satellites have a pair of satellites that complement each other, so without this configuration the revisit would be every 10 days.
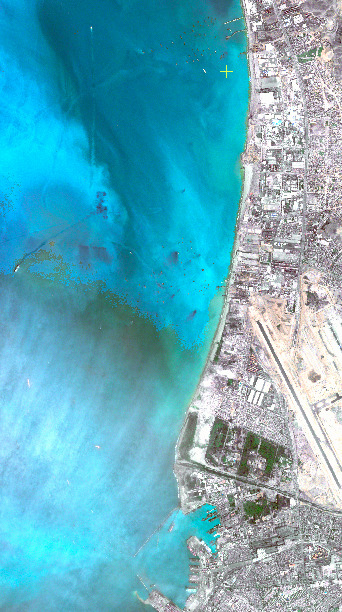
4.2 Comparison between PeruSat-1 Sentinel-2
The comparison between Sentinel-2 and PeruSat-1 will reflect differences in spatial resolution and detail capacity, which may be essential for certain geospatial analysis applications (Fig. 7). The choice between these images will depend on the specific requirements of the project and the objectives of the investigation.
Taking into account the spatial resolution of the 10 m Sentinel image, the identified surface further studies should include a validation using a higher resolution image, either from a higher resolution sensor such as PeruSat-1 images, with RPA images (Remotely Piloted Aircraft) or with a field reconnaissance
The images of the Peruvian satellite PeruSat-1 have a revisit every 26 days. This means that continuous monitoring could not be carried out despite the fact that in an emergency the satellite can take pictures every three days.
5 Conclusion
After making the required corrections in all images, it was possible to identify the surfaces of hydrocarbon contamination in various points of the sea near the Pampilla refinery where the oil spill occurred.
In the case of multispectral images, it can be seen that the normalized water index did not help in identifying the spill surface, in addition to comparing with the infrared bands, which did not help in identifying the surface in question either.
The radar images through speckle correction showed the surface of the spill, better defining its morphology in the VV polarity.
To obtain satellite images and their subsequent analysis, we must take into account what type of satellite we require since it is essential to understand that the quality of the image will depend on the shooting angle since it distorts the shapes of the objects, making it difficult, for example, measure and recognize objects.
Optical images provide high-resolution visual details that can help identify the exact location and size of a spill. On the other hand, synthetic aperture radar (SAR) can penetrate through clouds and darkness, allowing effective detection even in adverse weather conditions.
Satellite images enable early detection of oil spills, which is crucial for rapid and effective response. Satellites can monitor large areas on a regular basis, reducing the risk of a spill going undetected for a long time.
- https://cof.cnois.gob.pe/customer-office/net.eads.astrium.faceo.HomePage/HomePageLogin.jsp?locale=es (accessed 22 Sep. 2023).