

Abstract
1 Introduction
Among the vast number of sciences related to the study of oceans, rivers, and lakes, hydrography is defined by the International Hydrographic Organization (IHO) as the branch of applied sciences that deals with the measurement and description of the features of the seas and coastal areas for the primary purpose of navigation and all other marine purposes and activities. It includes (but is not limited to), offshore activities, research, protection of the environment, and prediction services (IHO, 2005). In other words, hydrography has been historically responsible for gathering the data required for reproducing submarine relief, making its visualization possible.
Hydrographic activities, science, and data products revolve around improving the representation of the underwater landscape in order to allow better characterization, analysis, and interpretation. Deeply intertwined with this are exploratory, confirmatory and communicative visualization actions. Elucidating the nature of bathymetric environments is the primary reason for these data’s existence and drives their production and quality control phases. Since such data visualization is intrinsic and fundamental for hydrographic practice (analytical visualization, interpretation, collaborative decision-making, communication, and dissemination), it is essential to review how the workflows that result in hydrographic data visualizations differ and how these differences may produce similar or distinct representations or operational outcomes.
Data visualization is essential to determine veracity and quality during all phases of bathymetric data generation from acquisition to the end of its processing. The visualization of bathymetric data can occur at any stage of its lifespan, whether in the raw data acquisition phase, the data processing phase, or when data are already validated and archived in a database. Viewing the bathymetric data allow flexibility in the forms and interfaces used.
1.1 Review considerations and strategies
This study reflects upon the technologies and interfaces used to visualize bathymetric data during hydrographic surveys and stored in existing repositories at national hydrographic offices. It takes into account the different types of equipment, software, and technologies used for the acquisition, processing, and storage of bathymetric data, assuming the period after the release of the fifth edition of IHO S-44 Standards for Hydrographic Surveys (IHO, 2022), which took place in 2008.
The search for articles used as a reference for this review was carried out using a group of keywords, complemented by articles published by journals focused on all aspects of hydrography and associated subjects, such as The International Hydrographic Review (IHR) and Hydro International. Studies written in English and Portuguese were considered.
The following terms and keywords were used separately and in combination to search for articles relevant to this review: 2D visualization, 3D visualization, augmented reality, bathymetric data, bathymetry measurements, cartography, data acquisition, data processing, geovisualization, interfaces, hydrography, marine environment, mixed reality, nautical cartography, pseudo 3D, true 3D, virtual reality.
1.2 Organization of review
This article divided the bathymetric data’s visualization forms into three groups according to the bathymetric survey phase. In this way, the first group will have the methods of visualizing the data during its acquisition; the next group will show the forms of visualization during the data processing and analysis phase; finally, the ways of visualizing the already processed and stored data in databases, usually applicable on survey design, charting and reporting data. In the sequence, alternative (immersive) bathymetric data visualization methods are presented, exploring those not yet fully incorporated into the most popular methods.
2 Trends in the technologies and interfaces used for bathymetric data visualization
The protocols and standards established by the IHO, under the requirement set out in the International Convention for the Safety of Life at Sea (SOLAS) and other international regulations, have been decisive in guiding the directions taken by the international hydrography community. Created in 1921 and headquartered in Monaco, the IHO, the former International Hydrographic Bureau, has reached its 100 anniversary with nearly 100 member states represented by their respective hydrographic offices (HO) (IHO, 2022). Since its creation, the IHO has provided a forum for Member States and International Organizations to connect, address relevant issues, and develop collaborative programs. Today, the IHO takes a leadership role in the hydrographic community in the Ocean Decade, supporting and facilitating the improvement of ocean knowledge delivery, both qualitatively and quantitatively (Jonas, 2021). In this way, the collaboration of members of the hydrographic community, facilitated by the action of the IHO, results in how hydrographic surveys have been carried out. The IHO, as an intergovernmental organization, assists in implementing the enhancement and expansion of hydrography infrastructure through technical standardization, directly or indirectly influencing trends in the technologies and interfaces used for bathymetric data visualization.
2.1 Trends and current practice in data visualization during acquisition
The visualization of bathymetric data during its acquisition may or may not be performed depending on the platform’s characteristics and acquisition method used. In some cases, the availability of physical space and whether the platform works autonomously can limit or even prevent data visualization during acquisition.
In contemporary practice, multiple approaches have been taken to acquiring bathymetric data using different platforms, equipment, and methods. Acquisition methods have been diversifying since 1970, but over the last two decades, significant growth in ocean mapping was noticed, encompassing different platforms, equipment, and acquisition principles (acoustic, optical, and radar) (Smith Menandro & Cardoso Bastos, 2020; Ferreira et al., 2022). Underwater acoustic data acquisition, the primary and most used method to date (Kenny et al., 2003; Smith Menandro & Cardoso Bastos, 2020), has been supplemented with other significant sources of bathymetric data, such as Light Detection and Ranging (LIDAR) and satellite-derived bathymetry (SDB; Churnside, 2013; Ponce, 2019), Airborne Derived Bathymetry (ADB) and Synthetic Aperture Radar (SAR; Wiehle et al., 2019). LiDAR and SDB have been mainly used in shallow clear waters, generally in coastal environments, where it could be difficult and dangerous to gather bathymetric data using ship-based systems (Wölfl et al., 2019). Coverage, spatial and temporal resolution, and data type vary among a diverse range of bathymetry acquisition systems (Kearns et al., 2010). In all cases, the chosen sensor must be associated with a positioning source to ensure the data is spatially referenced for integration with other data sources and prepared for use in a Geographic Information System (GIS; Holland et al., 2016).
While dedicated to the safety of navigation, nautical charts are compiled from data originating from multiple sources and different systems and sensors using a range of procedures (Molchan, 2017), especially in shallow or remote areas (Mavraeidopoulos et al., 2017). The subitems below present the current practices for acquiring bathymetric data, divided by the operating principle of each sensor (acoustic sensors, air and spaceborne remote sensing), as well as how these data are visualized while they are acquired.
2.1.1 Trends and current practice in data visualization during acquisition of bathymetric data using acoustic sensors
The technological advances in remote sensing using electromagnetic radiation and artificial satellites have improved and direct land surface mapping, providing high-definition surveys on Earth and other astronomical objects (Smith & Sandwell, 1997; Bolton et al., 2020). However, the incredible power of water absorption and attenuation of electromagnetic radiation makes it impossible to use these technologies to survey the seabed in deep areas and under turbid water (Allouis et al., 2007; Leder et al., 2020). In other words, mapping almost three-quarters of the Earth’s surface area, covered by oceans, lakes, and rivers, must rely on equipment and sensors based on acoustic energy such as sonar.
The primitive techniques used by mariners to measure depth were replaced by single-beam echo sounding in the 1920s, which constituted a notable improvement in efficiency and accuracy and increased data visualization, processing, and analysis complexity. The single-beam echosounder, a type of sonar (short for SOund NAvigation and Ranging) used as research equipment, employs the physical properties of the acoustic pulse in the aquatic environment to measure depth values. In 1960, the advent of the narrow beam echosounder and the principle of multibeam swath bathymetry further expanded underwater mapping efficiency (Vilming, 1998). Unlike single-beam sonar, which uses just one transducer to map the seafloor, a multibeam sonar sends out multiple sonar beams simultaneously in a fanshaped pattern that covers the space directly under the ship and out to each side. The Multibeam Echosounder (MBES) has become the sonar technology most used by hydrographic offices to carry out their surveys (Brown et al., 2019; Smith Menandro and Cardoso Bastos, 2020), followed by the Single Beam Echosounder (SBES) and the Sidescan Sonar (SSS; Ferreira et al., 2022).
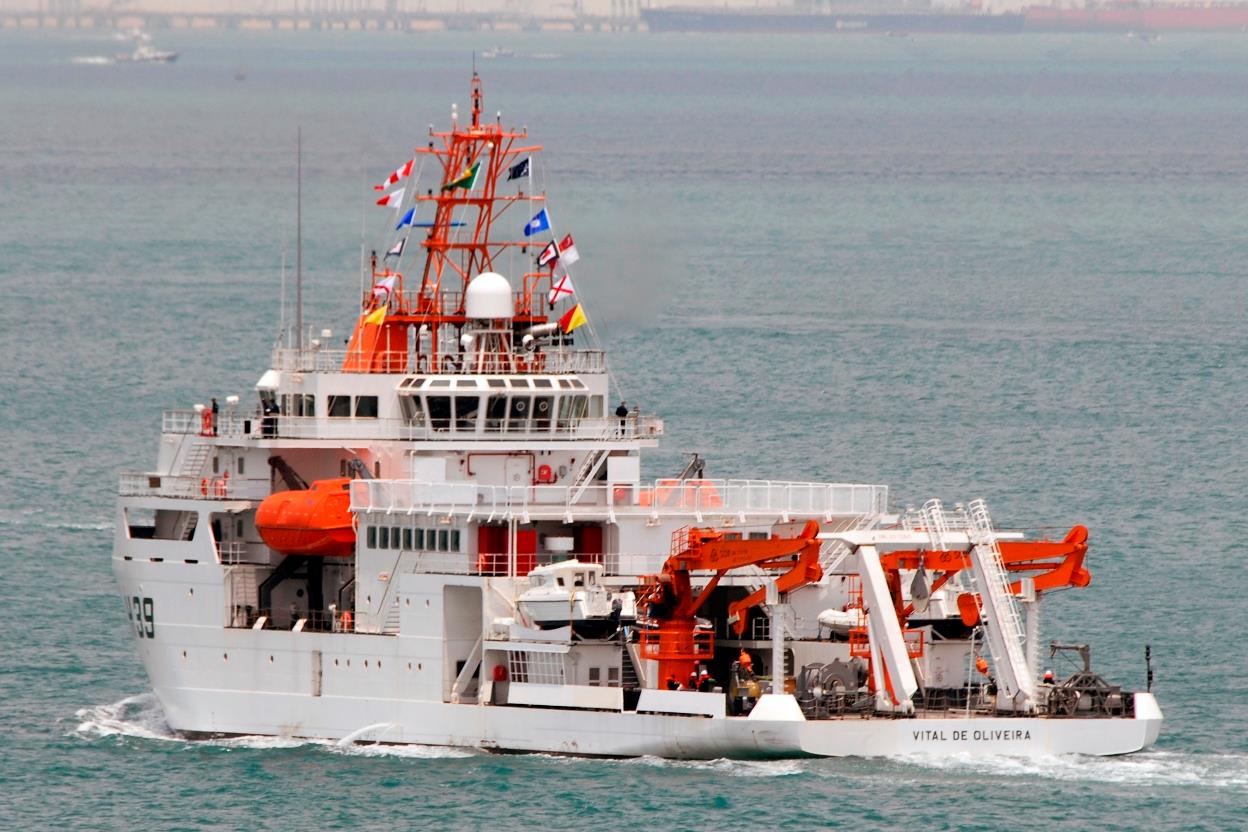
Ships, ranging from small boats to great research vessels, with or without crew, are still the most common platform for adequately applying acoustic remote sensing systems and performing large-scale seafloor mapping (Connon, 2021; Ferreira et al., 2022). Since, in recent years, there has been immense enthusiasm for using autonomy and robotics in the hydrographic survey industry, organizations’ preferred solution for improving ocean mapping and increasing survey capacity has been achieving force multiplication by combining crewed and uncrewed vessels (Fig. 1; Holland et al., 2016; Van Wegen, 2022).
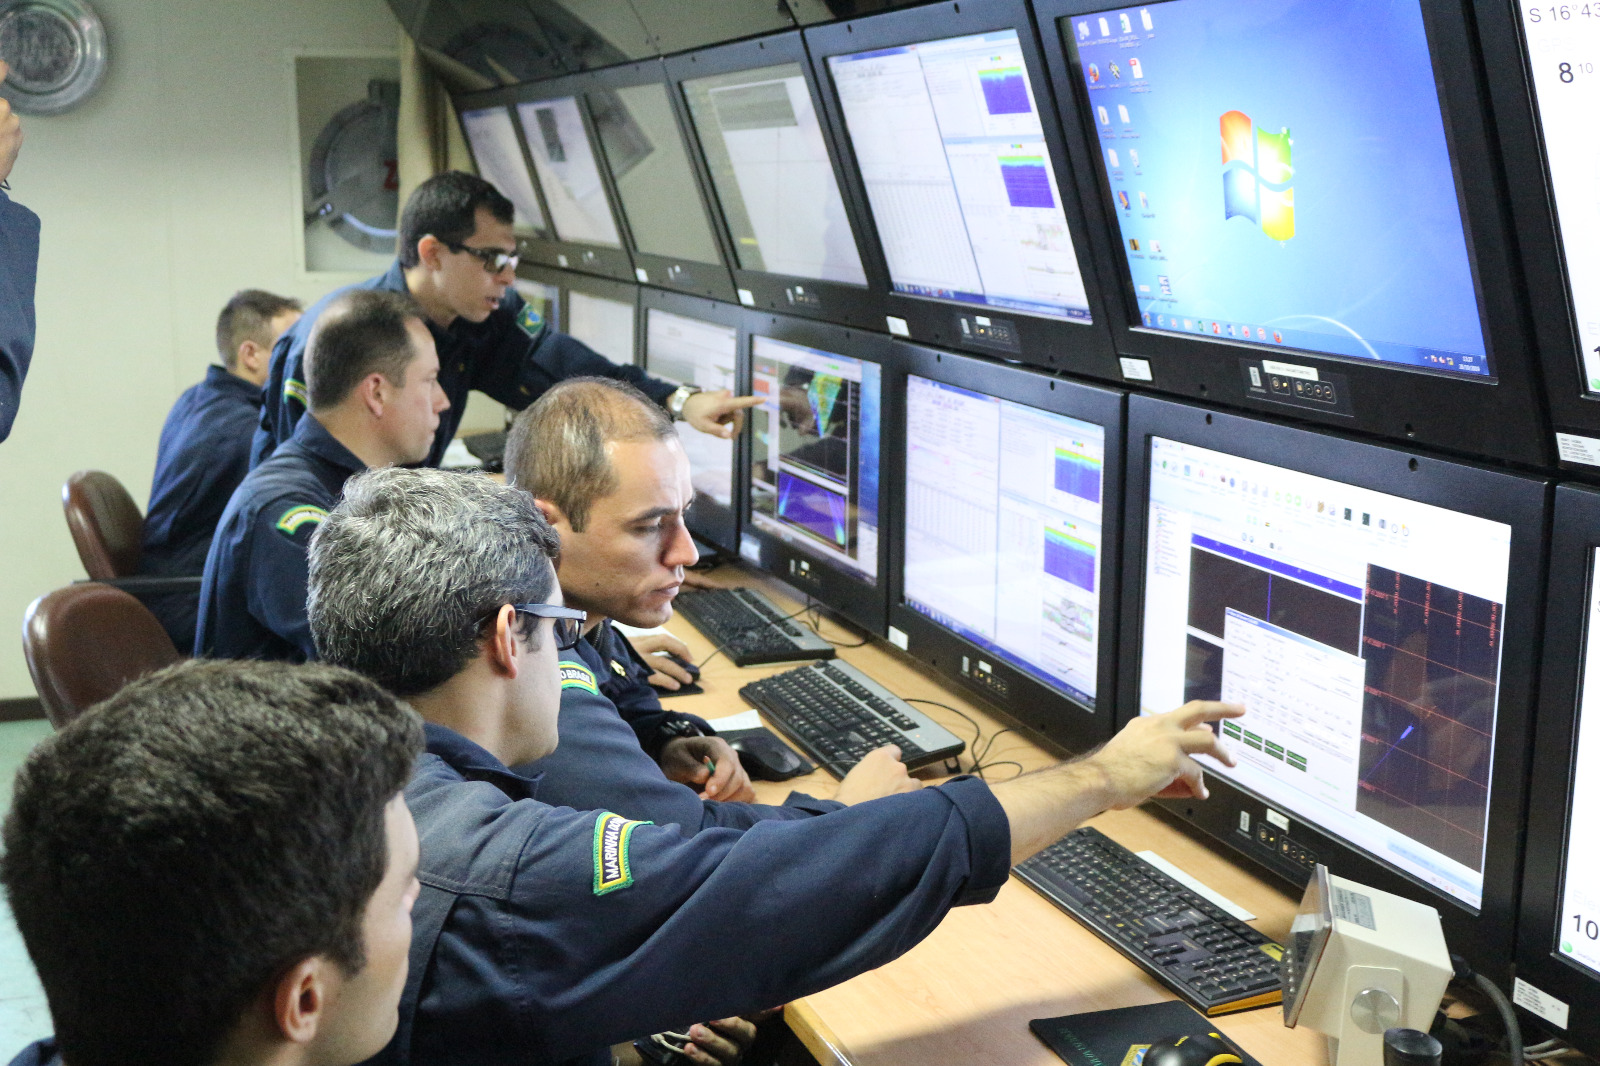
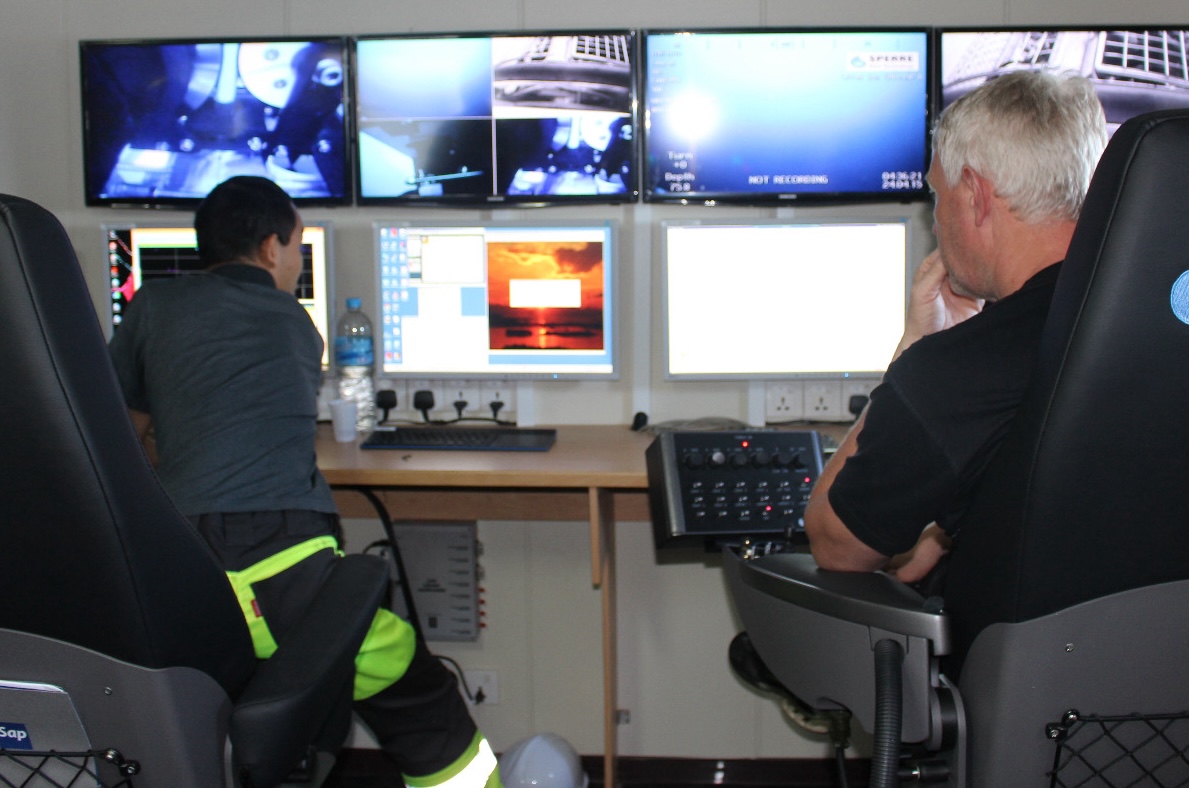
Depending on their size, research vessels usually have sufficient space to install a data acquisition system and an office or cabinet to accommodate the system operator (Fig. 2). From these control rooms, operators can monitor the data acquisition systems in real time by previewing the data on the console screens. Under these conditions, the data is in a generation phase before the raw data and can be presented in different graphic forms, depending on the resources available in the acquisition software. A common practice is to place the system in acoustic pulse emission mode but not turn on data recording when the intention is to only visualize a surface, for example, during a survey planning phase.
It is also ubiquitous for large ships transporting smaller research platforms, such as hydrographic boats, Unmanned Underwater Vehicle (UUV), that are divided into two kinds; Autonomous Underwater Vehicles (AUV) and Remotely Operated Underwater Vehicle (ROUV or just ROV; He et al., 2020), and Autonomous Surface Vehicles (ASV).
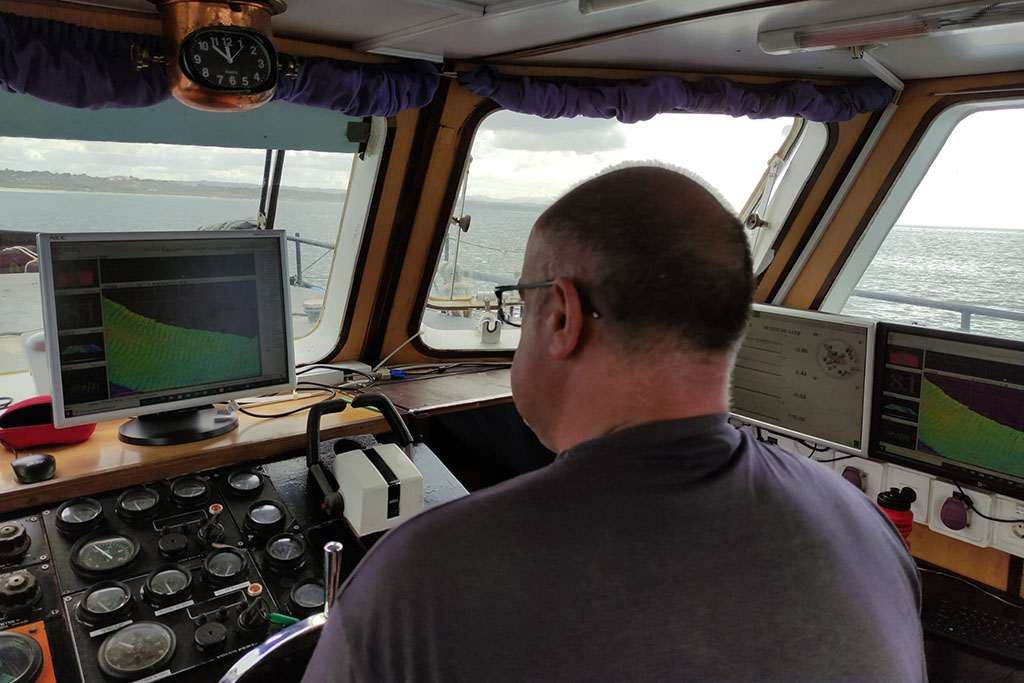
The smaller the vessel, the smaller the space available for the operator, who usually also serves as the boat operator during the survey. For example, in the case of watercraft and inflatable boats, the reduced space and lack of shelter from the external environment reduce the number of resources available for monitoring and controlling the acquisition system. Suppose the system operator also drives the vessel; the operator’s attention is divided into three nonequal parts (Fig. 3). The first and bigger one is oriented to navigation, which concerns the safe conduction of the boat through the research lines (Ternes et al., 2008). Secondly, monitoring the system, checking if the system is working correctly and if any alert message or error generated automatically. Lastly, a small part of the operator’s attention is on the system’s control. In short, the possible ways of viewing bathymetric data on small vessels are the same as those performed on larger vessels. The difference is the space and operators available to interact with the acquisition systems.
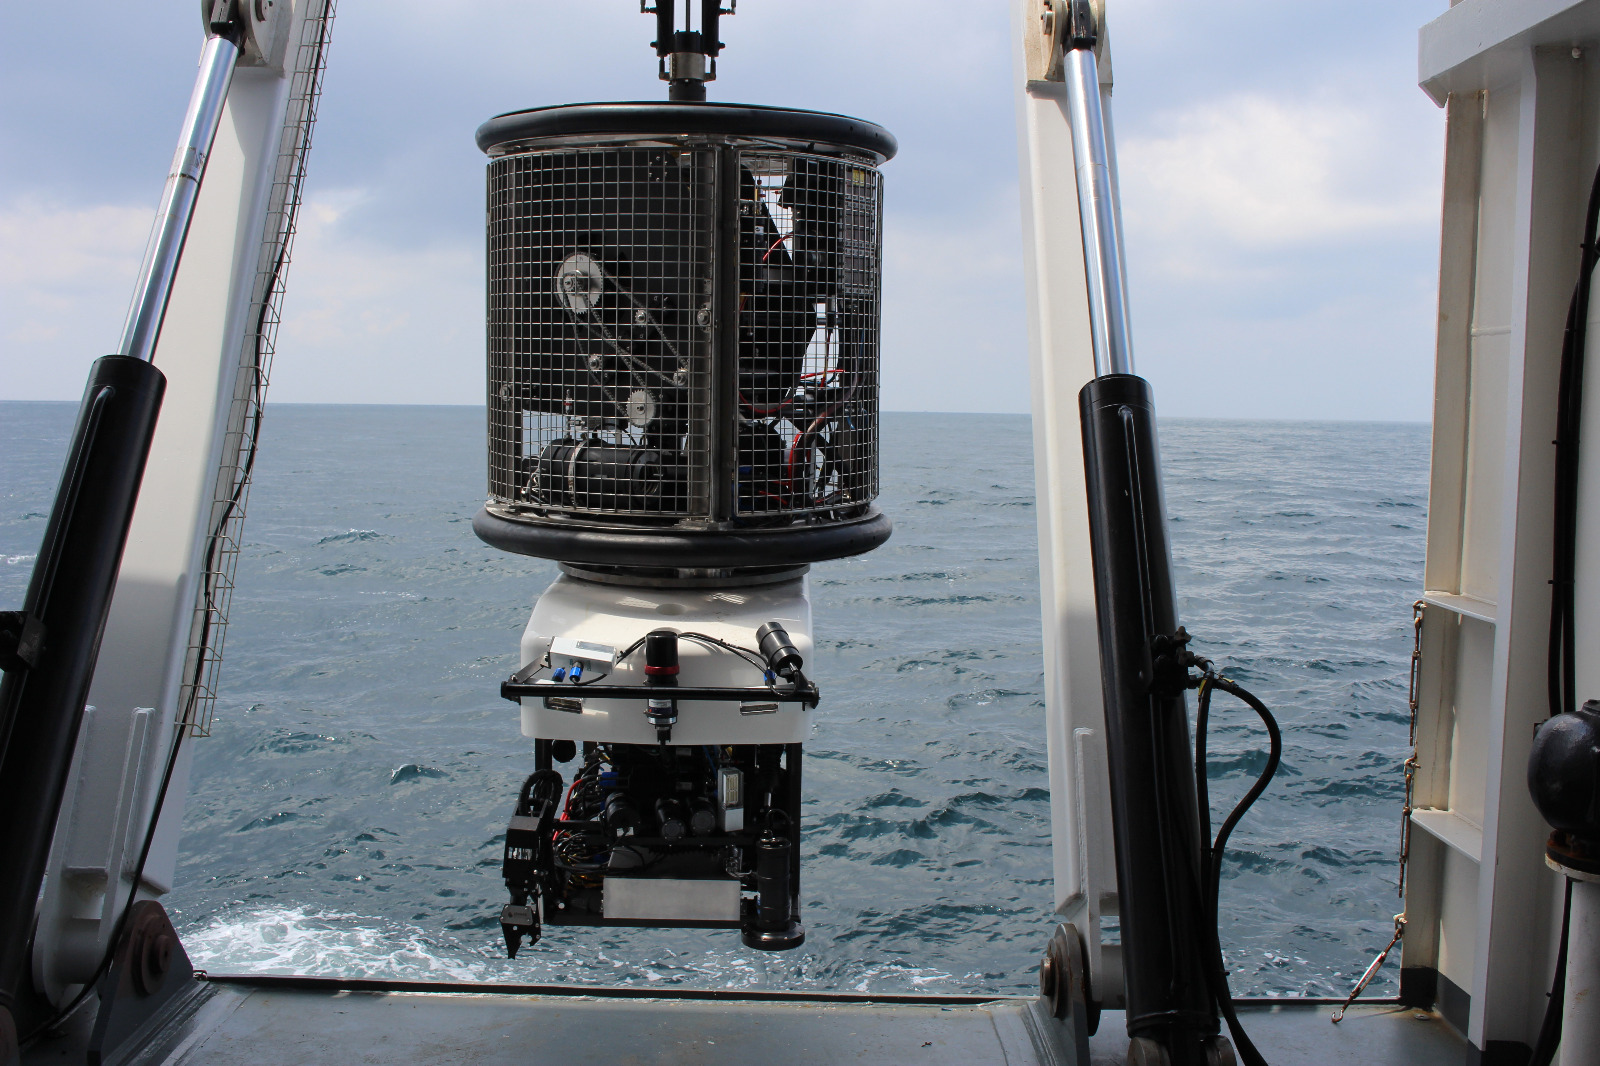
ROVs, also seen as underwater tethered robots controlled from the surface, emerged as platforms to support industrial activities in the underwater environment (Macreadie et al., 2018). ROVs can serve many uses (Wu, 2017), whether hull inspection (Waszak et al., 2022) or sampling from the sea floor (Mazzeo et al., 2022), usually performing the work of human divers in cases where diver safety is not guaranteed. As a research platform, it allows the installation of various sensors and equipment, like echo sounders’ transducers, video cameras, and others, depending on their size and structure (Huvenne et al., 2018; Macreadie et al., 2018). However, ROVs rely on one or more qualified human operators and the support of a launch and control platform (Fig. 4; Wu, 2017; Huvenne et al., 2018).
The main difference in an acquisition made using the ship is that the transducers are installed on the ROV, not the ship’s hull. Moreover, the transceiver and the acquisition system’s monitoring and control console remain on board the vessel. In this sense, the visualization of bathymetric data during the acquisition phase using ROV is not far from what is done using a research ship since both the sensors and the acquisition systems are the same.
In line with the new development trend of automating the acquisition, transmission, and processing of bathymetric data and reducing costs and time spent to carry out hydrographic surveys, autonomous systems, mainly the ASV and AUV, currently, stand out (Wölfl et al., 2019). After being pre-programmed with mission parameters, both autonomous systems (AUV and ASV) can collect data without needing a human controller (Huvenne et al., 2018). With the development of increasingly efficient batteries (Reader et al., 2002) and the availability of a range of sensors, these vehicles can cover large areas, navigate safely, and even avoid obstacles (Wynn et al., 2014). However, despite all the automaticity of autonomous vehicles, they still depend on support platforms for their launch and recovery, especially in places far from the coast (Wynn et al., 2014; Ferreira et al., 2022). Autonomous systems are generally similar to ROVs in terms of visualization of bathymetric data acquisition. Although the echo sounder is installed in vehicles, a human controller can monitor the system if there is communication with the vehicle (Giodini et al., 2016). However, due to limited communications capabilities, some autonomous operations require their vehicle to be recovered before accessing data stored internally (Fig. 5; Holland et al., 2016).
Usually, manufacturers offer packages that include software for data acquisition and processing in addition to equipment and sensors. However, it is possible to use software developed by other manufacturers. Some companies like HYPACK have developed software for the hydrographic and dredging industries for decades. Their software is one of the world’s most widely used hydrographic software. Along HYPACK (acquired by Xylem Inc. in 2015), major hydrographic acquisition software market players include Stema Systems, Teledyne Marine, Chesapeake Technology, QPS, Ifremer, Eye4Software, and EIVA (Value Market Research, 2021).
In the context of work conducted in the hydrographic offices, where the surveys carried out in their areas of jurisdiction are processed, a considerable volume of projects need to be verified and potentially used for the preparation or updating of nautical documents, the use of software reliable and established in the market becomes essential. Thus, hydrographic offices use the software developed by leading companies to respond to the great demand for work.
2.1.2 Trends and current practice in data visualization during acquisition of bathymetric data using air and spaceborne remote sensing
Despite the high attenuation of electromagnetic waves in water, the remote sensing method of applying multispectral bands can be employed in bathymetric mapping, depending on the water’s clarity (Roberts, 1999). Air and space-borne remote sensing are especially effective in coastal environments where collecting bathymetric data with ship-based systems in shallow water is substantially more time-consuming and hazardous than collecting deep-water data. Moreover, exploiting satellite imagery has proven to be an alternative technique for quickly collecting bathymetric data, offering significant advantages to planning and executing hydrographic activities (Panayotov, 2018).
In this context, depths can be measured using two system types: passive type, which measures only the natural energy naturally available on the submerged bottom (spectral response bathymetry), and active type, which uses lasers to measure the distance to the seabed. Remote sensing of bathymetry also falls into non-imaging and imaging methods, where imaging methods base the water depth estimation on an image’s pixel values. In contrast, non-imaging detects the distance between the sensor and the water surface/sea floor using single or double waves (Gao, 2009). For example, light detection and ranging (LiDAR) and Radar Altimetry sensors are classified as active type and non-imaging methods of remote sensing of bathymetry. While synthetic aperture radar (SAR) uses an imaging method despite being an active type that transmits microwave signals and then receives the signals that are returned, or backscattered, from the Earth’s surface. Lastly, Satellite Derived Bathymetry (SDB) is a technique based on the empirical, semi-analytical, or analytical modeling of light transmission through the atmosphere and the water column. The imagery data processing consists of atmospheric correction, air-water interface corrections, and the implementation of inverse optical models (Mavraeidopoulos, Pallikaris and Oikonomou, 2017). SDB sensor is of passive type and uses an imaging method (Hartman et al., 2017).
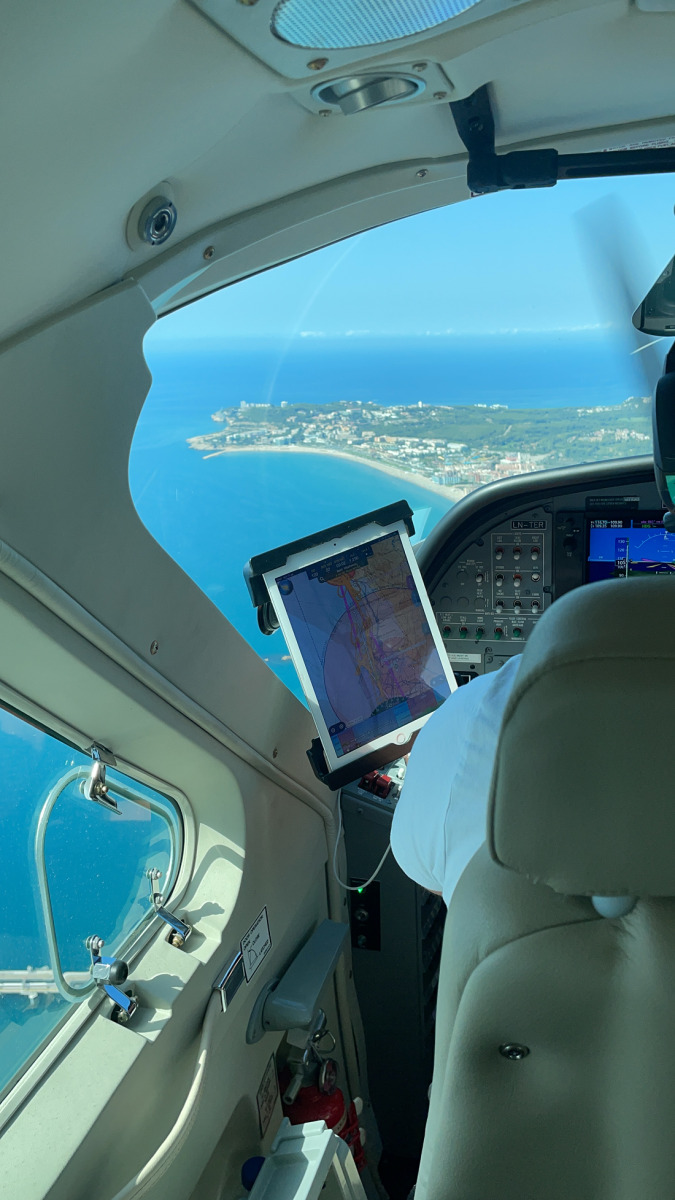
There is great flexibility in platforms on which remote sensing equipment can be installed, including planes, helicopters, drones, satellites, and even small boats or ships. For example, Unpiloted Aerial Vehicles (UAV) have provided a cost-effective alternative for remote, small, and localized Airborne Lidar Bathymetry (ALB) surveys, leading lidar manufacturers to develop lighter, more compact sensors suitable for this market (Quadros & Keysers, 2018). Depending on the platform used for a hydrographic survey, there may be an operator controlling the acquisition system from within the platform itself, such as an airplane, there may be an operator controlling the survey platform from a remote location, such as a drone, or even the absence of a controller, as is the case with satellites and autonomous platforms (Fig. 6).
The acquisition of bathymetric data, using equipment on board crewed aircraft or unmanned platforms, in general, has the same concerns: to perform the flight safely and travel the planned route to cover the entire desired area. In this way, similar to acquiring bathymetric data on offshore platforms, the visualization of the data being acquired is not intended to analyze the features presented but its integrity. Bearing in mind that reliable analyses are always performed on processed data, not raw data, the acquisition phase mainly seeks to ensure that the data is complete and readable.
2.2 Trends and current practice in bathymetric data visualization during processing
Regardless of the equipment or platform used to acquire bathymetric data, these raw data need to go through some general processing stages (Wlodarczyk-Sielicka and Blaszczak-Bak, 2020), which usually include corrections, such as noise removal, filtration process (Zhang et al., 2016), applications of other complementary data for calibration, data reduction (Wlodarczyk-Sielicka et al., 2019), generation of digital terrain model (DTM), so that analysis and reliable information could be extracted. MBES, for example, despite being a highly developed sensor, even with careful and engaged data acquisition that follows all rules and recommended guidelines, its collected data may contain undesired errors due to various external factors (Le Deunf et al., 2020; Wlodarczyk-Sielicka & Blaszczak-Bak, 2020; Šiljeg et al., 2022). The same also applies to airborne bathymetric LiDAR (ABL). The objective of airborne laser echo signal processing is to estimate the distance between the receiving system and the target once the received echo waveform usually contains multiple noises or “false signals” caused by environmental interference and the system’s circuit (Guo et al., 2022).
If the forms and equipment used to acquire bathymetric data are very diverse, the same cannot be said about the range of methods and techniques used to process them. Usually, each equipment manufacturer implements and offers patented software for processing data acquired by their equipment (Parnum & Gavrilov, 2011; Guo et al., 2022)., but multiple companies develop software aimed at processing various formats of bathymetric data, such as HIPS and SIPS from Teledyne Geospatial (Teledyne, 2023), HYPACK MAX from HYPACK Xylem (Xylem, 2023), LiDAR Survey Studio from Leica (Leica, 2023), NaviSuite from EIVA (EIVA, 2023), among others. It is observed that any hydrographic processing software shares similar core processing operations (Boers, 2016), which some software offers some complementary resources, such as geodetic support functionalities, types of data visualization (fly-throughs support, area-based 3D view and editing, 4D support), but also some potential limitations, such as types of data format the software can import and export, minimum software’s system requirements (Langhorst, 2022). Besides, some bathymetric data processing software offers automated processing features (Wölfl et al., 2019), which are even recommended by the IHO S-44 standard (IHO, 2022), such as the CUBE (Calder & Mayer, 2003; Makar, 2017), the algorithm that most of the commercially available automatic cleaning methods rely on (Ferreira et al., 2019; Le Deunf et al., 2020). Smaller firms and research groups have explored low-cost solutions outside the proprietary commercial software processing programs, such as open-source software (Zhang et al., 2016; Bobich, 2020). These trends in bathymetric data processing are likely driven by the fact that the hydrographic community meets the international norms established by the IHO, which dictates the standards of how a hydrographic survey should be done as a whole (Wlodarczyk-Sielicka & Blaszczak-Bak, 2020), leading the market to develop products that adhere to these requirements.
To illustrate how bathymetric data processing from hydrographic surveys has been done using data processing software available on the market, raw bathymetric data acquired by an MBES system can be taken as an example. In general, data about the platform and the equipment used in data acquisition are entered into the software, informing its characteristics, such as dimensions, positioning, and manufacturer data. The raw data are also inserted into the software; it is necessary to convert the file format depending on the software. Other complementary and essential data for correcting the raw data are loaded into the software, such as sound speed profiles, navigation data, and attitude of the acquisition platform and tide heights. The software combines all entered data, and the degree of uncertainty of these values is calculated. The spurious data is cleaned, which can be done manually or using an algorithm, such as CUBE. Finally, quality control is performed. The whole process can be performed using a laptop computer or even a desktop and its peripherals.
In the hydrographic offices’ context, verifying the detection and cleaning of erroneous soundings while processing bathymetric data is crucial since the final objective is to update bathymetric information on nautical charts, guaranteeing the safety of navigation (Le Deunf et al., 2020). In addition, another critical factor is the speed with which new nautical document updates are made available (Pe’eri & Dyer, 2018). This situation becomes more explicit when one observes that the number of sensors available to conduct surveys, the increased use of autonomous platforms, and the volume of data generated are all factors that have pushed ocean mapping into the Big Data age (Holland et al., 2016). Faced with an increasing volume of bathymetric data coming from different sources of data acquisition, including non-traditional sources (Pavic et al., 2020), the national hydrographic offices have encountered a situation in which they need to optimize the verification and compilation of the data received, either by research carried out by the institution itself or by that belong, or by third parties, in order to quickly feed the databases with new entries, which may help update nautical documents (Ponce, 2019). Multiple efforts are underway to accelerate the processing, analyzing, and leveraging available raw data to generate data product updates (Wölfl et al., 2019). The search for a procedure that achieves maximum productivity with minimum wasted effort invariably involves using data processing software available on the market, developed precisely for this purpose. That said, in a production line context, viewing bathymetric data during its processing often takes advantage of whatever visualization capabilities are available in the data processing software, leaving little room for alternative methods not integrated with the software adopted by established standard production procedures.
2.3 Trends and current practice for viewing post-processed data in National Hydrographic Offices’ databases
Hydrographic surveys can be carried out both by private companies and by government agencies in order to obtain valuable bathymetric data for application in several areas of knowledge, such as geology, oceanography, archaeology (Janowski et al., 2021), environment and a growing variety of uses fundamental to understanding the planet’s phenomena, as well as for the development and structuring of coastal and port areas. Lastly bathymetric data are also critical for establishing the limits of the extended continental shelf under the United Nations Convention on Law of the Sea (Alberoni et al., 2020; Suárez-de Vivero, 2013). Although using bathymetric data for navigation purposes is exclusive to national hydrographic offices, their use for other activities, such as scientific research, is usually authorized. Several national offices, such as the Brazilian Directorate of Hydrography and Navigation (DHN) and the Canadian Hydrographic Service (CHS), provide some of their stored bathymetric data. In a global context, some organizations, such as The Nippon Foundation, promote the international sharing of bathymetric data, such as the GEBCO Seabed 2030 Project, in the sense of the general development of the ability to explore and critically understand ocean and seafloor processes (Mayer et al., 2018).
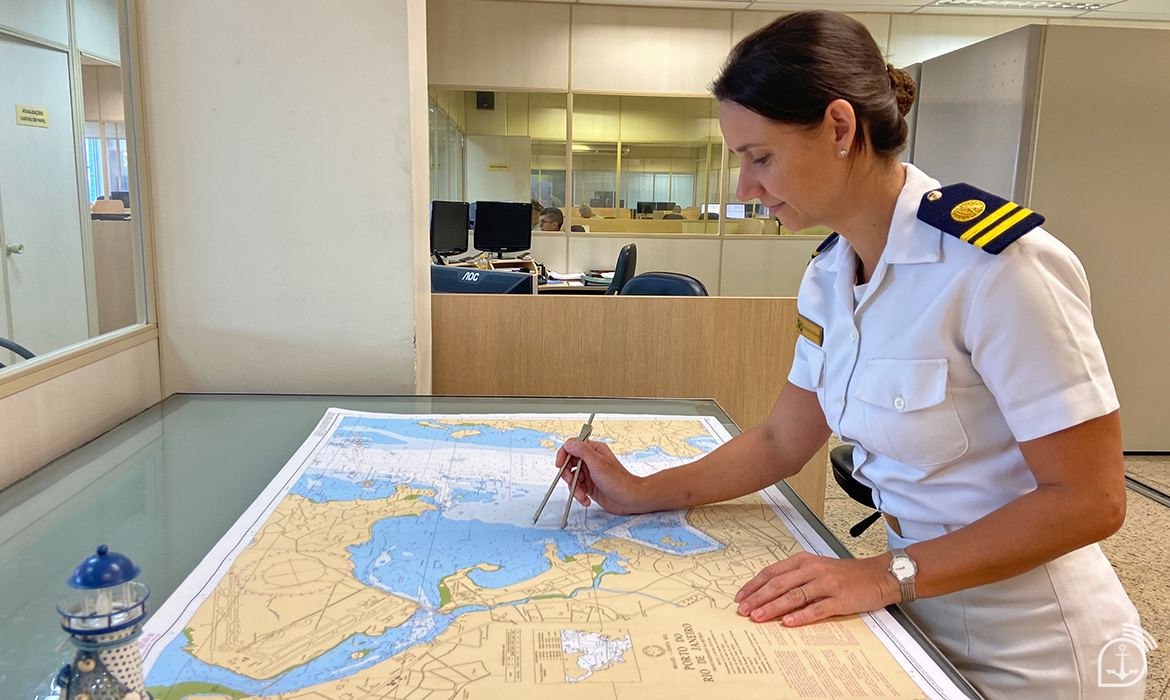
For the specific case of using bathymetric data for the construction or updating of nautical documents, such as nautical charts, hydrographic surveys are generally submitted to the appreciation of the national hydrographic offices, which have their policies for the verification and use of the data received (Fig. 2). In any case, all data received, regardless of being effectively used for editing a nautical document, are archived as long as they are valid. In this way, it is common for national hydrographic offices to become large repositories of bathymetric data, compiling datasets in a variety of formats and from multiple new and historical sources from surveys carried out in their jurisdictional waters in robust databases (Maia et al., 2017).
It has been a common practice among hydrographic offices to store processed bathymetric data in databases, usually managed by software developed for this purpose (Schwarzberg, 2019). The format of the files stored in the databases may vary from office to office, depending on the local data management policy and the system used. However, converting the files to the default XYZ file format is usually possible, ensuring smooth integration with all domain-specific software. In this condition, the data integrate a library, which gathers all valid and available data to be used for the production of marine products, such as nautical charts for example, as well as to be used as reference sources for hydrographic research or even from other areas of study.
The data visualization in the database can vary considerably, depending on the reasons for using it. Large geographic areas containing data from several hydrographic surveys can be visualized for research or work planning requiring these dimensions. On the other hand, small areas within a single survey can also be visualized in the case of a specific study or verification. For example, as part of assessing a possible anchoring area, someone could verify the presence of any unnatural feature, like parts of sunk ships, planes, or helicopters, that would make the area unsuitable for anchoring.
During the nautical cartographic production process, after a new bathymetric surface is added to the database, a check is made if it fills a previously empty area, overlaps with old surfaces, originated from old surveys already stored, or both situations at the same time (Le Deunf et al., 2023). This verification is essentially done visually by displaying the surfaces of a given location on a display device, usually a flat computer screen. In cases where new and old bathymetric surfaces overlap, a comparison is made in order to verify whether the new data present better resolution and a significant amount of alterations that justify an update of the nautical document associated with the geographic area (Kastrisios et al., 2023; Le Deunf et al., 2023).
Finally, hydrographic offices have adapted to the actual wave of digitization of hydrographic information, also known as “hydrospatial” (Ponce, 2019), using the IHO S-100 data model (Alexander et al., 2007; Ward et al., 2008; Schwarzberg, 2019), which will result in a considerable expansion of digital data services. The model explores the technique of visual two-dimensional overlaying of constantly new layers of information (Jonas, 2023).
2.4 The increasing significance of 3D data and its visualization, and the emergence of interface technologies that may support transformative information experiences
3D visualization technologies have increased in use and significance and have been considered a promising tool for various applications in many applied fields (Juřík et al., 2020), including geovisualization (Bleisch, 2012), geomorphology (Wang et al., 2020), crisis management (Lonergan et al., 2015; Rydvanskiy & Hedley, 2021), indoor navigation (Lochhead & Hedley, 2019), underwater mining operations (Bleier et al., 2019), visibility analysis (Lonergan & Hedley, 2016), and others.
As mentioned before, in hydrography, modern data processing software has offered features that allow the geovisualization of a set of bathymetric data from different perspectives, contributing to the perception and understanding of spatial information. Among the perspectives offered, the option of creating, visualizing, and manipulating digital images of 3D objects and scenes is considered of great potential for exploratory and data analysis 3D geovisualizations purposes (MacEachren & Kraak, 2001, Bleisch, 2012), where expert users (hydrographers) focus on recognizing important features or patterns in a data set, taking advantage of highly interactive features. Interaction and navigation in 2D and 3D displays have become essential to 3D geovisualization as they aim to gain insight, allowing the user to overcome occlusion or examine the dataset from different angles, where the 3D impression is received through rotation of the model on a computer screen (Lütjens et al., 2019).
In the context of spatial knowledge acquisition and cognitive perspective, previous studies (Hedley et al., 2002; Shelton & Hedley, 2004) discussed the benefits of using specific mechanisms offered by immersive environments, such as Virtual Reality and Augmented Reality, since these environments exploit 3D visualization technology. Moreover, in the field of cognitive psychology, there are many studies on the perceptual and cognitive processes in augmented reality, exploring the differences between the binocular and monocular presentation of stimuli (Dempo et al., 2022). Besides, different forms of 3D visualization may stimulate distinct types of human behavior and cognitive responses; for example, they can affect human sensorimotor and interaction approaches, cognitive processing, and, eventually, human performance (Juřík et al., 2020).
2.4.1 Pseudo-3D (monoscopic) versus true-3D (stereoscopic) visualization
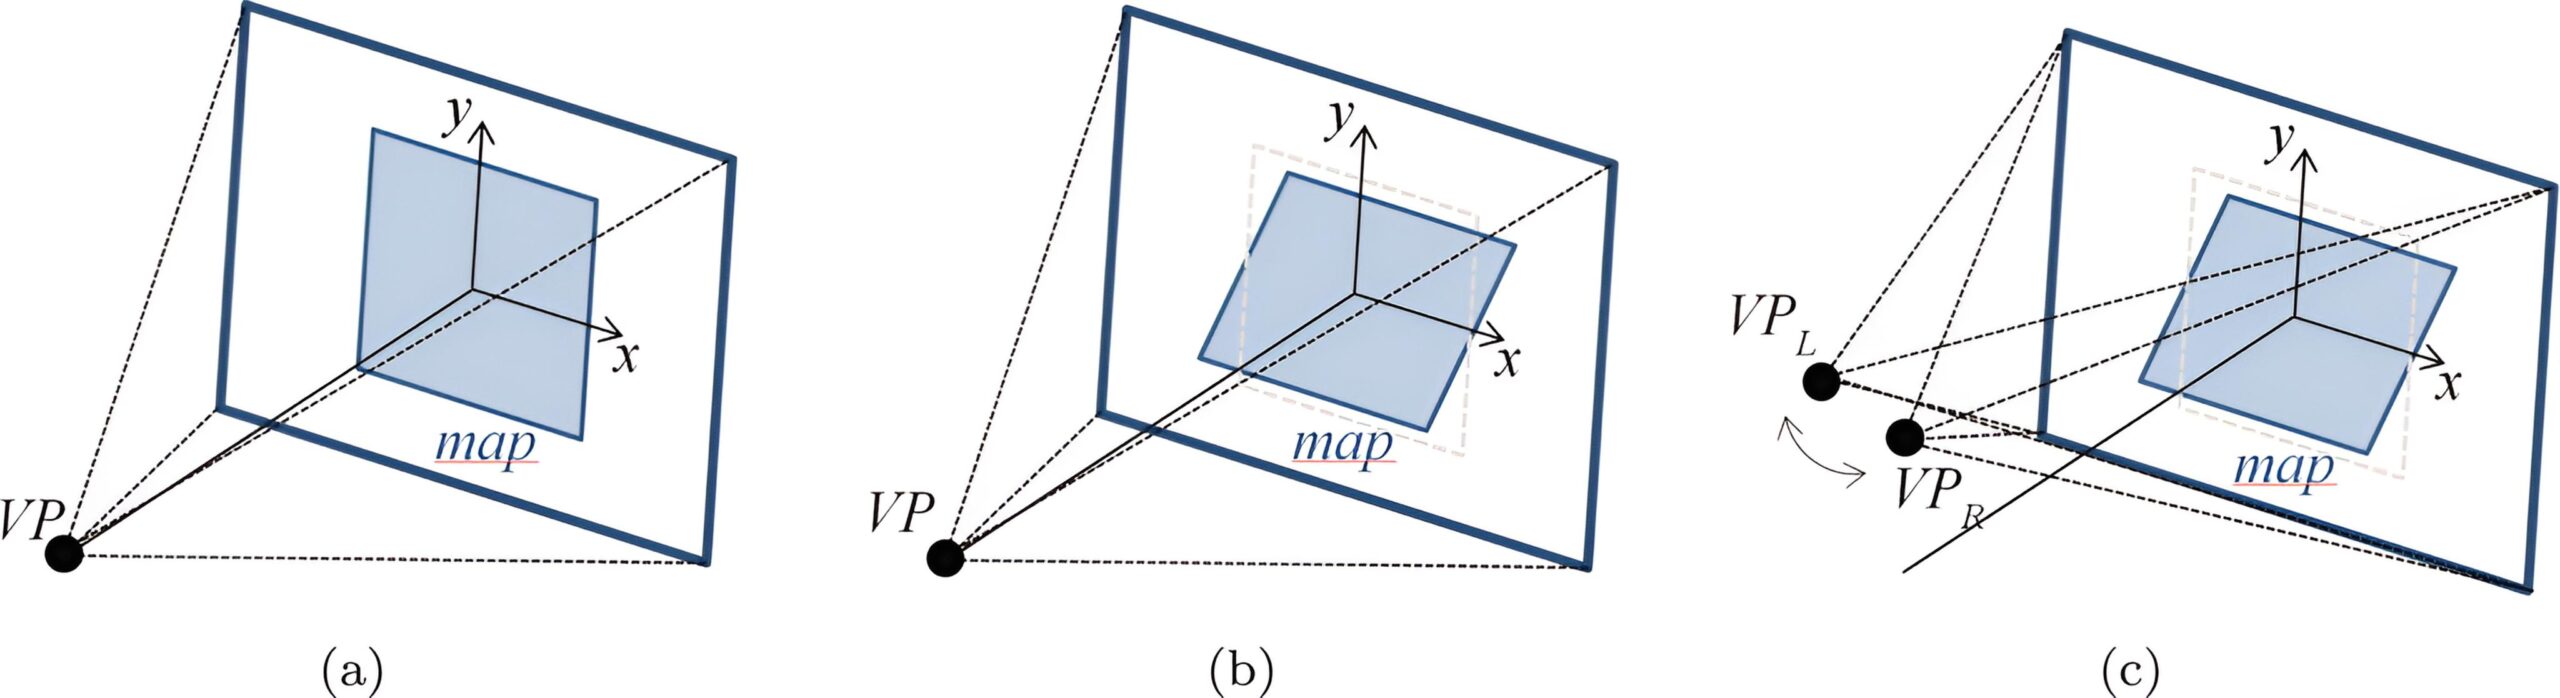
The abbreviation ‘3D’ is usually used generically and can refer to different meanings. The types of 3D visualizations depend on the principles on which they are built and the technologies used to display them, the two main types being 3D visualizations are pseudo-3D (also known as 2.5D or weak 3D) and the less common real 3D (also known as strong 3D) visualizations (Kjellin et al., 2010; Buchroithner, 2012). Real 3D visualizations employ monocular and binocular depth cues (especially binocular disparity cues) to achieve a stereoscopic vision (Juřík et al., 2020). Pseudo-3D depictions are visualized perspective-monoscopically on a two-dimensional display surface or planar media, such as on a monitor screen, and are not autostereoscopic. It requires projection of the 3D geometry, which usually means perspective distortion (Seipel, 2013). Fig. 8 illustrates the conceptual design of 2D, pseudo-3D and true-3D visualization conditions.
2.4.2 Evolving display types offer the opportunity to shift away from traditional 2D displays and explore alternative ways to interact with bathymetric data
As technology and equipment that provide immersion become more accessible, more study projects are beginning to explore applications of some degree of extended reality in bathymetric data acquisition and processing and nautical product upgrades (Jonas, 2023). The term ‘extended reality’ (or XR) has been adopted as an umbrella term for virtual, augmented, and mixed reality (VR, AR, MR) immersive technologies, which refers to technologies and conceptual propositions of spatial interfaces studied by engineering, computer science, and human-computer-interaction (HCI) researchers. The delineation between these terms remains fuzzy as XR expresses a spectrum of VR, AR, and MR (Çöltekin et al., 2020). One example is the evaluation of editing 3D point clouds using Immersive VR to speed up multibeam sonar data cleaning of spurious values during bathymetric data processing (Stevens & Butkiewicz, 2019). VR has also been used to display 3D nautical charts for navigation track control during hydrographic data acquisition, aiming to increase the spatial and situational awareness of the helmsman and allow intuitive and quicker decision-making in running desired tracks for hydrographic surveys (Ternes et al., 2008). One of the first examples of Augmented reality (AR) applied to hydrographic data use involved a first-generation Hololens mixed reality device on the bridge of a vessel – with basic observations of whether it simplified or expedited the regular updating process of nautical paper charts with new information, and to view chart update locations and their respective locations on the paper chart (Kokoszka et al., 2018). While this initial work is helpful, considerable additional work – using formal assessment of spatial perception and task analysis – is needed to empirically determine emerging interface technologies’ capabilities to support and enrich hydrographic data use.
However, in research carried out in national hydrographic offices, the usual software for processing and manipulating bathymetric data uses traditional 2D planar media, including computer monitors and presentation room projector screens. In fact, despite the hydrographic community having successfully migrated from an analog to an electronic model, the information continues to be presented in two-dimensional (Jonas, 2023). That said, this scenario tends to remain unchanged since the hydrographic community is currently interested in technological development revolve around robotics, autonomous and uncrewed systems, machine learning, and artificial intelligence, all topics that will not render hydrographic surveyors obsolete but considerably reduce their direct activities (Van Wegen, 2022).
Despite the observation that immersive visualization is currently not present at all or used only to a minimal degree in bathymetric data research and analysis indicate that the application of AR and VR in hydrographic offices workflow may offer significant benefits, including a faster and more accurate understanding of the portrayed situations when compared to their 2D counterparts. After all, immersive environments like VR and AR offer some fundamental parameters for true 3D visualization (Hedley & Lochhead, 2020; Lochhead & Hedley, 2021). For example, the degree of freedom, degree of perception, and degree of immersion are highly correlated with the spontaneity of perception regarding the third dimension. (Knust & Buchroithner, 2014). And since the visual perception of normal-sighted persons is stereoscopic, it makes sense to use modern technologies to render geovisualisations for truly three-dimensional viewing (Knust & Buchroithner, 2014). Furthermore, geospatial problems and questions are often 3D, yet data is traditionally illustrated on 2D surfaces, like maps or computer monitors, posing cognitive challenges for users (Lütjens et al., 2019). Since hydrographic data survey technologies inherently generate 3D data (Bleisch, 2012), tools that provide 3D data processing and deliver truly 3D-dimensional data visualization experiences to support interpretation should be considered.
The relative value of true 3D visualizations compared to 2D visualizations has been investigated independently by several authors studying spatial interpretation tasks. However, more and sustained empirical evaluation of the potential of these interface systems to support bathymetric data perception and task performance is needed.
3 Conclusion
Throughout this article, we observed that, despite their specificities, the world’s hydrographic services and offices have many characteristics in common. National hydrographic institutions generally establish their bases on land and equip their data acquisition platforms, usually ships, with the acquisition systems available on the market. They plan and execute their hydrographic surveys based on IHO standards. They process their data again according to IHO standards and using the processing systems available on the market. The processed data are stored in databases, used for the publication of nautical documents, and, finally, distributed or commercialized. As can be seen, uniformity is a strong characteristic of the hydrographic community, perhaps driven by a mutual commitment to comply with the norms and standards established by IHO. Most likely because it has representatives of different nationalities in its working groups, the IHO publishes, updates, and openly discusses the paths to be followed in hydrography with its members. At the same time that uniformity brings benefits to a production line, such as the elaboration and updating of nautical charts, this characteristic can also lead to the suppression of the initiative to try to use alternative technologies and innovate the process that has been done. Mainly when the existing standards are particular and detailed, and the current method is well-evaluated and considered satisfactory.
Although current data analysis interfaces are relatively successful, thanks to their development over time, there is still a need for innovation in minimizing human error and reducing time-consuming processing. With advances in cognitive science and psychology comes a better recognition of the strengths and limitations of human perception and the natural abilities of our brains. The use of new immersive interfaces should use this knowledge and be designed to support the strengths and minimize the limitations to reduce errors made by analysts.
The traditional representation method may not provide the best understanding of bathymetric data. Alternatively, methods and interfaces, such as Extended Reality, could be more efficient. Extended Reality can provide new ways to connect data-driven representations directly to real-world aspects. Therefore, virtual, mixed, or augmented reality technologies could offer unparalleled experiences with significant potential to transform how people understand and utilize geospatial data, providing new visualization and interaction methods (Çöltekin et al., 2020). Since previous studies (Torres et al., 2013; Juřík et al., 2017; Juřík et al., 2020) indicate that the advantages and disadvantages of applying true-3D visualizations are still open to discussion in various fields, especially regarding the interactivity factor, further research should explore interactive and advanced geospatial tasks that may strongly affect the cognitive processing of the stimuli.
References
Alberoni, A. A. L. et al. (2020). The new Digital Terrain Model (DTM) of the Brazilian Continental Margin: detailed morphology and revised undersea feature names. Geo-Marine Letters, 40(6), pp. 949–964. https://doi.org/10.1007/s00367-019-00606-x
Alexander, L., Brown, M., Greenslade, B. and Pharaoh, A. (2007). Development of IHO S-100: The New IHO Geospatial Standard for Hydrographic Data. The International Hydrographic Review, 8(1), pp. 56–62.
Allouis, T., Bailly, J.-S. and Feurer, D. (2007). Assessing water surface effects on LiDAR bathymetry measurements in very shallow rivers: A theoretical study. Second ESA Space for Hydrology Workshop, Geneva, CHE, pp. 12–14.
Bleier, M., Almeida, C., Ferreira, A., Pereira, R., Matias, B., Almeida, J., Pidgeon, J., van der Lucht et al. (2019). 3D Underwater Mine Modelling in the ¡VAMOS! Project. Int. Arch. Photogramm. Remote Sens. Spatial Inf. Sci., XLII-2/W10, 39–44. https://doi. org/10.5194/isprs-archives-XLII-2-W10-39-2019
Bleisch, S. (2012). 3D Geovisualization – Definition And Structures For The Assessment Of Usefulness. ISPRS Annals of the Photogrammetry, Remote Sensing and Spatial Information Sciences, I–2, pp. 129–134. https://doi.org/10.5194/isprsannals-I-2-129-2012
Bobich, R. (2020). Open Source Software and Hydrographic Survey Data: 3D Point Cloud Editing for Quick Seafloor Extraction Analysis and Visualizations. Hydro International, 1 December. https://www.hydro-international.com/content/article/open-source-software-and-hydrographic-survey-data (accessed 15 Feb. 2023).
Boers, J. (2016). Technology in Focus: Hydrographic Processing Software In What Direction is Progress Headed? Hydro International, 24 November. https://www.hydro-international.com/content/article/in-what-direction-is-progress-headed (accessed 9 Feb. 2023).
Bolton, D. K. et al. (2020). Continental-scale land surface phenology from harmonized Landsat 8 and Sentinel-2 imagery. Remote Sensing of Environment, 240, p. 111685. https://doi. org/10.1016/j.rse.2020.111685
Brown, C. et al. (2019). Multispectral Multibeam Echo Sounder Backscatter as a Tool for Improved Seafloor Characterization. Geosciences, 9(3), p. 126. https://doi.org/10.3390/geosciences9030126
Buchroithner, M. (2012). True-3D in Cartography: Autostereoscopic and Solid Visualisation of Geodata. Lecture Notes in Geoinformation and Cartography, Berlin, Heidelberg: Springer Berlin Heidelberg. https://doi.org/10.1007/978-3-642-12272-9
Calder, B. R. and Mayer, L. A. (2003). Automatic processing of high-rate, high-density multibeam echosounder data. Geochemistry, Geophysics, Geosystems, 4(6). https://doi. org/10.1029/2002GC000486
Churnside, J. H. (2013). Review of profiling oceanographic lidar’, Optical Engineering, 53(5), p. 051405. Available at: https://doi. org/10.1117/1.OE.53.5.051405.
Çöltekin, A. et al. (2020). Extended Reality in Spatial Sciences: A Review of Research Challenges and Future Directions. ISPRS International Journal of Geo-Information, 9(7), p. 439. https:// doi.org/10.3390/ijgi9070439
Connon, B. (2021). Who Is Going to Map the High Seas? Long Endurance, Low Impact Uncrewed Systems Vital to the Success of Seabed 2030. Hydro International, 17 August. https://www.hydro-international.com/content/article/who-is-going-to-map-the-high-seas (accessed 10 Feb. 2023).
de Almeida, C. M. (2023). Marinha É Líder no conhecimento de cartografia Náutica. Marinha do Brasil. Agência Marinha de Notícias. https://www.marinha.mil.br/agenciadenoticias/marinha-e-lider-no-conhecimento-de-cartografia-nautica (accessed 10 Feb. 2023).
de Jongh, C., Pont, S. and Talaya, J. (2023). Mapping the Catalan coast using airborne Lidar bathymetry. Hydro International. https://www.hydro-international.com/content/article/mapping-the-catalan-coast-using-airborne-lidar-bathymetry (accessed 9 Oct. 2023).
Dempo, A., Kimura, T. and Shinohara, K. (2022). Perceptual and cognitive processes in augmented reality – comparison between binocular and monocular presentations. Attention, Perception, & Psychophysics, 84(2), pp. 490–508. https://doi. org/10.3758/s13414-021-02346-6
EIVA (2023). NaviSuite – A complete software toolbox. EIVA a/s, Denmark. https://www.eiva.com/products/navisuite. (accessed 10 Feb. 2023).
Ferreira, I. O. et al. (2022). State of art of bathymetric surveys. Boletim de Ciências Geodésicas, 28(1), p. e2022002. https:// doi.org/10.1590/s1982-21702022000100002
Ferreira, I. O. et al. (2019). Robust Methodology for Detection of Spikes in Multibeam Echo Sounder Data. Boletim de Ciências Geodésicas, 25(3), p. e2019014. https://doi.org/10.1590/s1982-21702019000300014
Freina, L. and Ott, M. (2015). A literature review on immersive virtual reality in education: state of the art and perspectives. The international scientific conference elearning and software for education, pp. 10–1007.
Gao, J. (2009). Bathymetric mapping by means of remote sensing: methods, accuracy and limitations. Progress in Physical Geography: Earth and Environment, 33(1), pp. 103–116. https://doi. org/10.1177/0309133309105657
Giodini, S., Blom, K. and Binnerts, B. (2016). Can I Communicate with My AUV? Performance and Challenges in Shallow Water. Hydro International, 26 July. https://www.hydro-international.com/content/article/can-i-communicate-with-my-auv (accessed 10 Feb. 2023).
Guo, K. et al. (2022). Development of a single-wavelength airborne bathymetric LiDAR: System design and data processing. ISPRS Journal of Photogrammetry and Remote Sensing, 185, pp. 62–84.
Hartman, K. et al. (2017). Effective Surveying Tool for Shallow-water Zones: Satellite-derived Bathymetry. Hydro International, 5 January. https://www.hydro-international.com/content/article/effective-surveying-tool-for-shallow-water-zones (accessed 15 Feb. 2023).
Hedley, N. R., Billinghurst, M., Postner, L., May, R. and Kato, H. (2002). Explorations in the Use of Augmented Reality for Geographic Visualization. Presence: Teleoperators and Virtual Environments, 11(2), pp. 119–133. https://doi.org/10.1162/1054746021470577
Hedley, N. and Lochhead, I. (2020). Turning 3D Data Surveys of Intertidal Zones Into New Modes of 3D Visualization, Simulation and Spatial Interface Experiences. The International Archives of the Photogrammetry, Remote Sensing and Spatial Information Sciences, XLIII-B4-2020, pp. 791–794. https://doi. org/10.5194/isprs-archives-XLIII-B4-2020-791-2020
He, Y., Wang, D. B. and Ali, Z.A. (2020). A review of different designs and control models of remotely operated underwater vehicle. Measurement and Control, 53(9–10), pp. 1561–1570. https://doi.org/10.1177/0020294020952483
Holland, M., Hoggarth, A. and Nicholson, J. (2016). Hydrographic processing considerations in the “Big Data” age: An overview of technology trends in ocean and coastal surveys. IOP Conference Series: Earth and Environmental Science, 34, p. 012016. https://doi.org/10.1088/1755-1315/34/1/012016
IHO (2005). Manual on Hydrography. IHO Publication C-14, International Hydrographic Organization, Monaco, 540p.
IHO (2020). Standards for Hydrographic Surveys (6th ed.). IHO Special Publication S-44, International Hydrographic Organization, Monaco, 42p.
IHO (2022). YEARBOOK – ANNUAIRE – ANUARIO. IHO Periodic Publication P-5, International Hydrographic Organization, Monaco. Janowski, L. et al. (2021). From acoustics to underwater archaeology: Deep investigation of a shallow lake using high‐resolution hydroacoustics – The case of Lake Lednica, Poland. Archaeometry, 63(5), pp. 1059–1080. https://doi.org/10.1111/arcm.12663
Jonas, M. (2021). IHO’s Role in the Ocean Decade. Marine Technology Society Journal, 55(3), pp. 17–20.
Jonas, M. (2023). New horizons for hydrography. The International Hydrographic Review, 29(1), pp. 16–24. https://doi.org/10.58440/ihr-29-a01
Juřík, V. et al. (2017). When the display matters: A multifaceted perspective on 3D geovisualizations. Open Geosciences, 9(1). https://doi.org/10.1515/geo-2017-0007
Juřík, V. et al. (2020). The 3D hype: Evaluating the potential of real 3D visualization in geo-related applications. PLOS ONE. 15(5), p. e0233353. https://doi.org/10.1371/journal.pone.0233353
Kastrisios, C. et al. (2023). Increasing Efficiency of Nautical Chart Production and Accessibility to Marine Environment Data through an Open-Science Compilation Workflow. ISPRS International Journal of Geo-Information, 12(3), p. 116. https://doi.org/10.3390/ijgi12030116
Kearns, T. A., Breman, J., Barry, W. E., Taylor Martin, C., Meaden, G. and Vaz, S. (2010). Bathymetry –The Art and Science of Seafloor Modelling for Modern Applications, 36p. http://downloads2.esri.com/ESRIpress/images/169/OGLOBE_toc.pdf (accessed 11 Oct. 2023).
Kenny, A. J. et al. (2003). An overview of seabed-mapping technologies in the context of marine habitat classification☆. ICES Journal of Marine Science, 60(2), pp. 411–418. https://doi.org/10.1016/S1054-3139(03)00006-7
Kjellin, A. et al. (2010). Different Levels of 3D: An Evaluation of Visualized Discrete Spatiotemporal Data in Space-Time Cubes. Information Visualization, 9(2), pp. 152–164. https://doi.org/10.1057/ivs.2009.8
Knust, C., and Buchroithner, M. F. (2014). Principles and Terminology of True-3D Geovisualisation. The Cartographic Journal, 51(3), pp. 191–202. https://doi.org/10.1179/1743277413Y.0000000038
Kokoszka, T. et al. (2018). Utilizing Augmented Reality to Update Nautical Charts. IEEE Oceans 2018, Charleston, SC, USA. Oct 22-25, 2018, IEEE Oceanic Engineering Society. https://ccom. unh.edu/sites/default/files/publications/OCEANS18-ARNav.pdf (accessed 3 May 2023).
Langhorst, L. (2022). How to Choose the Right Hydrographic Processing Software: Key Considerations Before Investing. Hydro International, 22 March. https://www.hydro-international.com/content/article/how-to-choose-the-right-hydrographic-processing-software (accessed 15 Feb. 2023).
Le Deunf, J. et al. (2020). A Review of Data Cleaning Approaches in a Hydrographic Framework with a Focus on Bathymetric Multibeam Echosounder Datasets. Geosciences, 10(7), p. 254. https://doi.org/10.3390/geosciences10070254
Le Deunf, J. et al. (2023). Automating the Management of 300 Years of Ocean Mapping Effort in Order to Improve the Production of Nautical Cartography and Bathymetric Products: Shom’s Téthys Workflow. Geomatics, 3(1), pp. 239–249. https://doi. org/10.3390/geomatics3010013
Leder, N., Duplančić Leder, T. and Bačić, S. (2020). Analysis of State-of-the-Art Hydrographic Survey Technologies. Proceedings of the FIG Working Week 2020, Smart Surveyors for Land and Water Management, Amsterdam, The Netherlands, 10–14 May 2020.
Leica (2023). Leica LiDAR Survey Studio. Leica Geosystems AG Part of Hexagon. https://leica-geosystems.com/products/airborne-systems/software/leica-lidar-survey-studio. (accessed 10 Feb. 2023).
Lochhead, I. and Hedley, N. (2019). Mixed reality emergency management: bringing virtual evacuation simulations into real-world built environments. International Journal of Digital Earth, 12(2), pp. 190–208. https://doi.org/10.1080/17538947.2018.1425489
Lochhead, I. and Hedley, N. (2021). Designing Virtual Spaces for Immersive Visual Analytics. KN Journal of Cartography and Geographic Information, 71(4), pp. 223–240. https://doi.org/10.1007/s42489-021-00087-y
Lonergan, C., Hedley, N. and Clague, J. J. (2015). A visibility-based assessment of tsunami evacuation signs in Seaside, Oregon. Natural Hazards, 78(1), pp. 41–59. https://doi. org/10.1007/s11069-015-1696-8
Lonergan, C. and Hedley, N. (2016). Unpacking isovists: a framework for 3D spatial visibility analysis. Cartography and Geographic Information Science, 43(2), pp. 87–102. https://doi.or g/10.1080/15230406.2015.1065761
Lütjens, M. et al. (2019). Virtual Reality in Cartography: Immersive 3D Visualization of the Arctic Clyde Inlet (Canada) Using Digital Elevation Models and Bathymetric Data. Multimodal Technologies and Interaction, 3(1), p. 9. https://doi.org/10.3390/ mti3010009
MacEachren, A. M. and Kraak, M.-J. (2001). Research Challenges in Geovisualization. Cartography and Geographic Information Science, 28(1), pp. 3–12. https://doi.org/10.1559/152304001782173970
Macreadie, P. I. et al. (2018). Eyes in the sea: Unlocking the mysteries of the ocean using industrial, remotely operated vehicles (ROVs). Science of The Total Environment, 634, pp. 1077–1091. https://doi.org/10.1016/j.scitotenv.2018.04.049
Maia, P., Florentino, C. and Pimentel, V. (2017). Fluxo de dados hidrográficos para a produção de documentos náuticos. in. XXVII Congresso Brasileiro de Cartografia e XXVI Exposicarta, Rio de Janeiro-RJ, pp. 6–10. https://www.researchgate.net/publication/333678399 (accessed 18 Nov. 2022).
Mavraeidopoulos, A. K., Pallikaris, A. and Oikonomou, E. (2017). Satellite derived bathymetry (SDB) and safety of navigation. The International Hydrographic Review, 17, pp. 7–19.
Makar, A. (2017). Cleaning of MBES Data Using CUBE Algorithm. 17th International Multidisciplinary Scientific GeoConference SGEM 2017, pp. 841–847.
Mayer, L., Jakobsson, M., Allen, G., Dorschel, B., Falconer, R., Ferrini, V., Lamarche, G., Snaith, H. and Weatherall, P. (2018). The Nippon Foundation—GEBCO Seabed 2030 Project: The Quest to See the World’s Oceans Completely Mapped by 2030. Geosciences, 8(2), 63. https://doi.org/10.3390/geosciences8020063
Mazzeo, A. et al. (2022). Marine Robotics for Deep-Sea Specimen Collection: A Systematic Review of Underwater Grippers. Sensors, 22(2), p. 648. https://doi.org/10.3390/s22020648
Molchan, M. (2017). Changes to Data Sourcing in Modern Times: The New Data Paradigm. Hydro International, 17 February. https://www.hydro-international.com/content/article/changes-to-data-sourcing-in-modern-times (accessed 13 Feb. 2023).
CIRM (2021). NApOc “Ary Rongel” realiza Levantamento Hidrográfico na Antártica’. CIRM Programa Antartico Brasileiro, 20 November 2021. https://www.marinha.mil.br/secirm/pt-br/proantar/noticias/ary-levantamento-hidrografico. (accessed 13 Feb. 2023).
Parnum, I. M. and Gavrilov, A. N. (2011). High-frequency multibeam echo-sounder measurements of seafloor backscatter in shallow water: Part 1 – Data acquisition and processing. Underwater Technology, 30(1), pp. 3–12. https://doi.org/10.3723/ut.30.003
Pavic, I. et al. (2020). Analysis of Crowdsourced Bathymetry Concept and It’s Potential Implications on Safety of Navigation. TransNav, the International Journal on Marine Navigation and Safety of Sea Transportation, 14(3), pp. 681–686. https://doi.org/10.12716/1001.14.03.21
Pe’eri, S. and Dyer, N. (2018). Automated Depth Area Generation for Updating NOAA Nautical Charts. Hydro International, pp. 27–29.
Ponce, R. (2019). Multidimensional Marine Data: The next frontier for Hydrographic Offices. The International Hydrographic Review, 22.
Quadros, N. and Keysers, J. (2018). Emerging Trends in Bathymetric Lidar Technology: What is on the Horizon for Airborne Lidar Bathymetry? Hydro International, 13 December. https://www. hydro-international.com/content/article/emerging-trends-in-bathymetric-lidar-technology (accessed 15 Feb. 2023).
Reader, G.T., Potter, J. and Hawley, J.G. (2002). The evolution of AUV power systems. OCEANS ’02 MTS/IEEE. OCEANS ’02 MTS/IEEE, 1, pp. 191–198. https://doi.org/10.1109/ OCEANS.2002.1193270
Roberts, A. C. B. (1999). Shallow water bathymetry using integrated airborne multi-spectral remote sensing. International Journal of Remote Sensing, 20(3), pp. 497–510. https://doi. org/10.1080/014311699213299
Rydvanskiy, R. and Hedley, N. (2021). Mixed Reality Flood Visualizations: Reflections on Development and Usability of Current Systems. ISPRS International Journal of Geo-Information, 10(2), p. 82. https://doi.org/10.3390/ijgi10020082
Schwarzberg, P. (2019). Cartography at the Source New Products, New Ideas, Less Work. Hydro International, 2 April. https://www.hydro-international.com/content/article/cartography-at-the-source (accessed 10 Feb. 2023).
Seipel, S. (2013). Evaluating 2D and 3D geovisualisations for basic spatial assessment. Behaviour & Information Technology, 32(8), pp. 845–858. https://doi.org/10.1080/0144929X.2012.661555
Šiljeg, A. et al. (2022). Bathymetric Survey of the St. Anthony Channel (Croatia) Using Multibeam Echosounders (MBES) – A New Methodological Semi-Automatic Approach of Point Cloud Post-Processing. Journal of Marine Science and Engineering, 10(1), p. 101. https://doi.org/10.3390/jmse10010101
Shelton, B. E. and Hedley, N. R. (2004). Exploring a cognitive basis for learning spatial relationships with augmented reality. Technology, Instruction, Cognition and Learning, 1(4), p. 323.
Smith Menandro, P. and Cardoso Bastos, A. (2020). Seabed Mapping: A Brief History from Meaningful Words. Geosciences, 10(7), p. 273. https://doi.org/10.3390/geosciences10070273
Smith, W. H. F. and Sandwell, D. T. (1997). Global Sea Floor Topography from Satellite Altimetry and Ship Depth Soundings. Science, 277(5334), pp. 1956–1962. https://doi.org/10.1126/science.277.5334.1956
Suárez-de Vivero, J. L. (2013). The extended continental shelf: A geographical perspective of the implementation of article 76 of UNCLOS. Ocean & Coastal Management, 73, pp. 113–126. https://doi.org/10.1016/j.ocecoaman.2012.10.021
Stevens, A. H., & Butkiewicz, T. (2019). Faster Multibeam Sonar Data Cleaning: Evaluation of Editing 3D Point Clouds using Immersive VR. OCEANS 2019 MTS/IEEE SEATTLE, pp. 1–10. https://doi.org/10.23919/OCEANS40490.2019.8962793
Teledyne (2023). HIPS & SIPS – Better Results in Less Time. http://www.teledynecaris.com/en/products/hips-and-sips/ (accessed 11 Oct. 2023).
Ternes, A. et al. (2008). A User-defined Virtual Reality Chart for Track Control Navigation and Hydrographic Data Acquisition. A. Moore and I. Drecki (Eds.), Geospatial Vision. Lecture Notes in Geoinformation and Cartography. Springer, Berlin, Heidelberg. https://doi.org/10.1007/978-3-540-70970-1_2
Torres, J. et al. (2013). Comparative Study of Stereoscopic Techniques Applied to a Virtual Globe. The Cartographic Journal, 50(4), pp. 369–375. https://doi.org/10.1179/1743277413Y.0000000034
Value Market Research (2021) Global Hydrographic Acquisition Software Market Report. https://www.valuemarketresearch. com/report/hydrographic-acquisition-software-market (accessed 13 Oct. 2022).
Van Wegen, W. (2022). New Horizons for Hydrography, but Who Will Conquer Them? Industry Survey: Technology and Energy Transition Bring New Opportunities. Hydro International, 13 December. https://www.hydro-international.com/content/article/ new-horizons-for-hydrography-but-who-will-conquer-them (accessed 17 Feb. 2023).
Vilming, S. (1998). The development of the multibeam echosounder: An historical account. The Journal of the Acoustical Society of America, 103(5), p. 1637.
Wang, N., Li, S., Hu, R., Xu, Y. and Wang, X., 2020. Geomorphology of the underwater caldera of the Changbaishan Tianchi volcano using 3D virtual visualization. Geological Journal, 55, pp. 5186–5196. https://doi.org/10.1002/gj.3723
Ward, R. et al. (2008). IHO S-100: The new hydrographic geospatial standard for marine data and information. Canadian Hydrographic Conference, 425. https://scholars.unh.edu/ccom/425 (accessed 11 Oct. 2023).
Waszak, M. et al. (2022). Semantic Segmentation in Underwater Ship Inspections: Benchmark and Data Set. IEEE Journal of Oceanic Engineering, pp. 1–12. https://doi.org/10.1109/ JOE.2022.3219129
Wiehle, S., Pleskachevsky, A. and Gebhardt, C. (2019). Automatic bathymetry retrieval from SAR images. CEAS Space Journal, 11(1), pp. 105–114.
Wlodarczyk-Sielicka, M., Stateczny, A. and Lubczonek, J. (2019). The Reduction Method of Bathymetric Datasets that Preserves True Geodata. Remote Sensing, 11(13), p. 1610. https://doi.org/10.3390/rs11131610
Wlodarczyk-Sielicka, M. and Blaszczak-Bak, W. (2020). Processing of Bathymetric Data: The Fusion of New Reduction Methods for Spatial Big Data. Sensors, 20(21), p. 6207. https://doi.org/10.3390/s20216207
Wölfl, A.-C. et al. (2019). Seafloor Mapping – The Challenge of a Truly Global Ocean Bathymetry. Frontiers in Marine Science, 6, p. 283. https://doi.org/10.3389/fmars.2019.00283
Wynn, R. B. et al. (2014). Autonomous Underwater Vehicles (AUVs): Their past, present and future contributions to the advancement of marine geoscience. Marine Geology, 352, pp. 451–468. https://doi.org/10.1016/j.margeo.2014.03.012
Wu, C. (2017). Review and Classification of The Modern ROV. IJI-SET International Journal of Innovative Science, Engineering & Technology, 4(10), pp. 101–110.
Xylem (2023). HYPACK® MAX. https://www.hypack.com/product/id-HYPACK-MAX/HYPACK%C2%AE-MAX (accessed 10 Feb. 2023).
Zhang, W. et al. (2016). An Easy-to-Use Airborne LiDAR Data Filtering Method Based on Cloth Simulation. Remote Sensing, 8(6), p. 501. https://doi.org/10.3390/rs8060501
Authors’ biographies

Lieutenant Commander Andre A. Araujo holds a B.Sc. in Naval Science from Brazilian Naval College (Brazil) and a graduate diploma in hydrography completed at the Directorate of Hydrography and Navigation DHN (Brazil), recognized as an IHO/FIG/ICA Cat. A educational program. He is also a M.Sc. student of Geography at Simon Fraser University (SFU, Canada) with the research theme “Bathymetric data visualization using extended reality in applied hydrographic operations environments”. From 2015 to 2021, he worked for DHN (Brazil), where he gained most of his expertise in hydrographic surveying.

Dr. Nicholas Hedley is an Associate Professor of geovisualization and spatial interface research in the Department of Geography at Simon Fraser University, Canada. He is a multi-disciplinary spatial visualization and spatial interface designer/developer/applied scientist and also the founding director of the Spatial Interface Research Lab at SFU. His primary interests are in 3D/4D geographic visualization, spatial interface research, spatial reality capture, and applying these methods to challenging geographic phenomena. His work also involves designing 4D geovisual analysis and simulation, to facilitate powerful ways to characterize, visualize, experience, and interact with geographic data.